 Multi-family
1414 Mulford St · Killeen, TX
Flood risk 1/10 · Minimal
- FEMA flood zone
- X (unshaded)
- Chance of flooding over 30 yrs
- 0.0%
- Est. flood insurance / yr
- $507 – $1,088
Fire risk 2/10 · Minimal
- Est. fire insurance / yr
- $1,222 – $2,270
Heat risk 8/10 · Major
- Hot days now (above 107°F)
- 7 days/yr
- Hot days in 30 yrs
- 24 days/yr
Wind risk 6/10 · Moderate
- Chance of severe wind over 30 yrs
- 61.0%
Air-quality risk 1/10 · Minimal
- Unhealthy air days now
- 0 days/yr
- Unhealthy air days in 30 yrs
- 0 days/yr
Risk factors via First Street. Map © Google.
Why this score? — see what drove the B grade
The composite is a weighted blend of 9 inputs, each scored 0–100. Each bar is that input's sub-score; the figure is the points it added to the 100-point composite (weight × sub-score).
- Cash flow +30.0/30.0
- 1% rule +10.0/10.0
- DSCR +10.0/10.0
- ARV discount +7.5/15.0
- Appreciation +6.1/10.0
- Livability +3.2/5.0
- Schools +3.0/10.0
- Condition / age +2.5/5.0
- Rent growth +2.0/5.0
$95,000
🖨 Deal sheet (PDF) 📄 Offer letter ✓ Due diligence
Multi-family units
County records classify this as Multi-Family (2-4 Unit). Listing-text estimate: 1 unit. estimate disagrees with records
Listing remarks MLS
Nice home that has been converted to a 2 bedroom 2 bath. This one can be bought by itself or in a package.
Key facts
- New exterior paint
- Centrally located
- New interior paint
Tags
Property features AI
Finance
- Financial info: Property contains 2 total units; Both units currently reported with actual rent of $750 each; Tenant pays cable TV and internet
Exterior
- Utilities: Public water; Public sewer; Cable available; High-speed internet available
- Home design: Single-story; Resale property
- Construction: HardiPlank-type siding; Composition/shingle roof; Pillar/post/pier foundation; Built (year source: Assessor)
- Exterior features: City lot; Less than quarter-acre lot; City street frontage
Interior
- Kitchen: Electric range; Range; Refrigerator
- Bedrooms: Two 1-bedroom units (each unit listed as 1 bed)
- Flooring: Laminate
- Bathrooms: Two 1-bath units (each unit listed as 1 bath)
- Heating & cooling: Window unit heating; Wall/window unit cooling
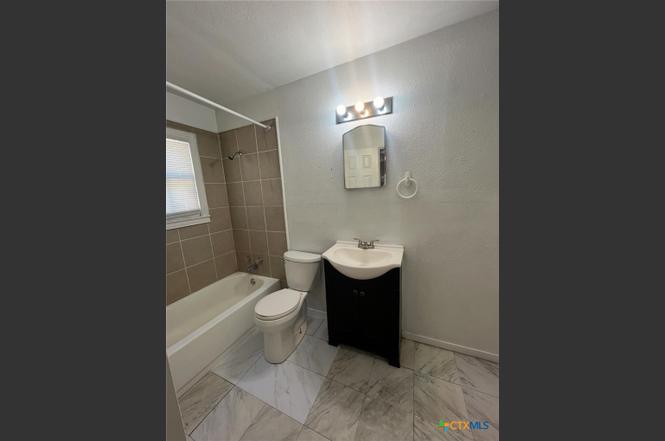
- Interior features: Ceiling fan(s); Tub with shower; Vanity; Breakfast area
- Laundry & utility: Satellite dish
Neighborhood map
What this means for you Summary
Snapshot
- This is a 2-bed/1.0-bath multifamily listed at $95k.
Deal economics
- At list price, monthly cash flow is $557 ($7k/yr) — positive.
- The deal already cash-flows at list — no discount required.
- Meets the 1% rule at list price ($2k rent vs $95k).
- Recommended offer: $84k (12.0% below list) — sets the bar for market timing.
- Cap rate 13.3% vs local median 3.9% in Killeen — top-decile yield for the area; either an underpriced asset or a hidden risk that comps aren't pricing in. Stress-test before assuming the spread holds.
Location & tenants
- Location reads 63/100 on livability (#853 in TX) — a middle-class / working-renter tenant base. Strengths: cost of living A+, housing A+; Watch: amenities D, employment D, crime D-.
- Killeen ISD (urban): math 31% / reading 38% proficiency, ranked #524 of 826 in TX (top 63%) — families likely to look elsewhere, expect single-tenant / working-renter base with shorter leases.
- Zoned schools: Killeen H S (math 29% / reading 40%, grade F, #963 of 1,632 statewide, top 61%, 2,076 students, 69% FRL) — zoned schools average 69% FRL vs 47% district-wide (22 pts higher); higher-poverty schools than district average — tighter screening recommended.
- Market conditions: Rents soft (-2.0%/yr); 126 active listings in the ZIP; 40 comparable units currently listed for rent nearby; rentals at typical pace (median 26d on market — plan ~3-4 weeks tenant-placement turnaround); 48% of comp listings sitting > 30 days — soft ceiling on asking rent; lower-income renter base — watch delinquency; 3,222 units permitted in Bell County in 2024 (246 in 5+ unit buildings).
Forward outlook
- In year one you build about $3k of equity ($657 loan paydown + $2k appreciation (2.3% local appreciation)).
- Bell County population projected at +21% by 2050 — long-run rental-demand tailwind backs the buy-and-hold thesis.
- At projected returns (2.3% appreciation + 0.0% rent growth), your $27k cash investment doubles in ~3 years — after that, you're playing with house money.
Negotiation context
- It's been on market 369 days — a 12% lower offer ($84k) is reasonable based on typical stale-listing flexibility.
- 5 sale attempts since 18y ago; this cycle's ask has dropped $22k (19%) from the opening price — seller is motivated, your offer sets the floor, not the list.
- Current owner paid $28k; list at $95k implies a 239% gain — meaningful room to come down on a strong offer.
Risks & watch-outs
- Watch-outs: built in 1956 — expect roof / HVAC / electrical / plumbing capex.
- Climate carrying-cost: major wind risk, 61% chance of damaging wind over 30y; extreme-heat days projected 7→24/yr by 2055 (HVAC capex compounding) — expect insurance premiums to compound above CPI over the hold.
Questions for the listing agent
- It's been on market 369 days. Have you received any prior offers? Is the seller open to a 12% concession, seller financing, or rate buy-down credit?
- Built in 1956 — when were the roof, HVAC, electrical panel, plumbing, and water heater last replaced?
- Why hasn't it sold? Are there any deal-killer items the seller is aware of (foundation, flood, title, zoning, code violations)?
- Is there a deadline driving the sale (1031 exchange, divorce, estate, relocation)? That informs how much negotiation room exists.
- Schools are D-rated, which usually means shorter tenancies and higher turnover. Who's the typical renter profile here, and what's been the actual vacancy rate?
- Crime grade is D in this area — have there been break-ins, vandalism, or insurance claims at this property in the last 3 years? What carrier currently insures it and at what premium?
- What's the average days-on-market for RENTAL listings here right now (not sales)? A rising rental-DOM trend means longer vacancies and softer asking-rent achievability than the comps imply.
- What's the recent tenant-quality profile in this submarket — average credit score on applications, eviction rate, late-payment / NSF rate, and stable-employment percentage? A property-management company in the area should have these aggregated.
- How much new apartment / multifamily construction is in the pipeline within 1–3 miles? Heavy new supply (>2% of stock underway) typically softens rents 12–24 months out; light construction supports rent growth.
Investment metrics
- 1% rule
- 1.68% ✓
- Cap rate
- 13.33%
- Cash-on-cash
- 25.14%
- DSCR
- 2.12
- GRM
- 5.0
CMA / ARV
No comps found within radius.
Projected returns pro-forma
2.26% appreciation · 0.0% rent growth · sell at horizon
- IRR
- 27.3%
- Equity multiple
- 2.45×
- Total profit
- $38,661
- Equity at exit
- $38,821
- IRR
- 26.9%
- Equity multiple
- 4.28×
- Total profit
- $87,183
- Equity at exit
- $56,959
Cash invested: $26,600 (down + closing). Projections, not guarantees.
Landlord ↔ Tenant lean methodology
- Overall (STATE)
- 87 Strongly Landlord-Friendly
- State Texas
- 87 Strongly Landlord-Friendly · R+5
- County
- — inherits STATE
- City
- — inherits STATE
ZIP-level market 76541
- Home prices YoY
- 1.4%
- Rents YoY
- -2.0%
- Active inventory
- 126
- Price-to-rent
- 9.9×
Monthly cashflow live
- Estimated rent
- $1,592 medium interval (Pro) →
- Mortgage (P&I)
- −$498
- Tax from tax record
- −$163 /mo · $1,952/yr
- Insurance
- −$40
- HOA
- −$0
- Vacancy / Maint / Mgmt
- −$334
- Net cashflow
- $557
Break-even live
Sensitivity live
| Price | -10% $611 | -5% $584 | +0% $557 | +5% $530 | +10% $503 |
|---|---|---|---|---|---|
| Rent | -10% $431 | -5% $494 | +0% $557 | +5% $620 | +10% $683 |
| Rate | -1.0pp $605 | -0.5pp $581 | base $557 | +0.5pp $533 | +1.0pp $508 |
2-unit breakdown (identical units grouped — click to expand)
| Units | Beds | Baths | Est. rent |
|---|---|---|---|
| 2× units | 2 | 1 | $1,592 |
| #1 | 2 | 1 | $796 |
| #2 | 2 | 1 | $796 |
| Total (2 units) | $1,592 | ||
UW: 25.0% down · 7.5% · 30yr · 1.5% tax · 5.0% vac · 8.0% maint · 8.0% mgmt
Financing live
Cash to close
- Down payment
- $23,750
- Closing costs
- $2,850
- Reserves months
- —
- Total cash needed
- —
Loan-product check · same deal, 3 products live
Conventional
25% down · 7.5% · 30yr
- Down + closing
- —
- Monthly P&I
- —
- Monthly cashflow
- —
- DSCR
- —
- Eligible?
- —
Personal DTI + credit; lowest rate.
DSCR
20% down · 8.5% · 30yr
- Down + closing
- —
- Monthly P&I
- —
- Monthly cashflow
- —
- DSCR
- —
- Eligible?
- —
No personal income docs; deal must DSCR.
Hard money
10% down · 12.0% · 12mo
- Down + closing
- —
- Monthly P&I
- —
- Monthly cashflow
- —
- DSCR
- —
- Eligible?
- —
Short-term bridge; refi at stabilization.
Rent comps 40 comps
| Address | Beds | Baths | Sqft | Rent | $/sqft | DOM | Units | Dist |
|---|---|---|---|---|---|---|---|---|
| 1507 N 8th St Unit 8 Killeen, TX | 3.0 | 2.0 | 1116 | $995 | $0.89 | 25d | 1 | 0.08mi |
| 503 E Dean Ave Killeen, TX | 2.0 | 1.0 | 776 | $825 | $1.06 | 16d | 1 | 0.08mi |
| 1705 Mulford St Unit C Killeen, TX | 1.0 | 1.0 | 572 | $495 | $0.87 | 46d | 1 | 0.12mi |
| 415 E Garrison Ave Unit B Killeen, TX | 3.0 | 1.0 | 605 | $775 | $1.28 | 16d | 1 | 0.13mi |
| 1015 N 10th St Unit B Killeen, TX | 3.0 | 2.0 | 1118 | $1,100 | $0.98 | 46d | 1 | 0.16mi |
| 1117 N 8th St Killeen, TX | 1.0–2.0 | 1.0 | 675 | $800 | $1.19 | 46d | 5 | 0.18mi |
| 1901 N 10th St Unit 3 Killeen, TX | 2.0 | 1.0 | 920 | $745 | $0.81 | 46d | 1 | 0.18mi |
| 1810 N 8th St Killeen, TX | 1.0 | 1.0 | 576 | $625 | $1.09 | 46d | 3 | 0.20mi |
| 110 E Texas Ave Killeen, TX | 2.0 | 1.0 | 832 | $825 | $0.99 | 23d | 1 | 0.21mi |
| 1015 N 14th St Unit 8 Killeen, TX | 1.0 | 1.0 | 700 | $695 | $0.99 | 46d | 1 | 0.25mi |
| 1015 N 14th St Unit 2 Killeen, TX | 2.0 | 1.0 | 850 | $845 | $0.99 | 16d | 1 | 0.25mi |
| 1015 N 14th St Unit 4 Killeen, TX | 2.0 | 1.0 | 850 | $845 | $0.99 | 25d | 1 | 0.25mi |
| 1015 N 14th St Unit 2 Killeen, TX | 2.0 | 1.0 | 850 | $845 | $0.99 | 46d | 1 | 0.25mi |
| 1015 N 14th St Apt 1 Killeen, TX | 2.0 | 1.0 | 850 | $850 | $1.00 | 46d | 1 | 0.25mi |
| 1702 N 2nd St Killeen, TX | 1.0 | 1.0 | 490 | $550 | $1.12 | 46d | 1 | 0.26mi |
| 1006 N 4th St Unit 8 Killeen, TX | 2.0 | 1.0 | 750 | $700 | $0.93 | 46d | 1 | 0.27mi |
| 1403 N 2nd St Killeen, TX | 1.0–2.0 | 1.0 | 673 | $745 | $1.11 | 16d | 5 | 0.29mi |
| 1318 N 18th St Unit 5 Killeen, TX | 1.0 | 1.0 | 600 | $575 | $0.96 | 25d | 1 | 0.29mi |
| 1104 Duncan Ave Killeen, TX | 2.0 | 1.0 | 786 | $852 | $1.08 | 23d | 1 | 0.34mi |
| 1107 White Ave Killeen, TX | 2.0 | 1.0 | 758 | $800 | $1.06 | 46d | 1 | 0.40mi |
| 1201 N College St Unit 1201-101 Killeen, TX | 2.0 | 1.0 | 640 | $675 | $1.05 | 46d | 1 | 0.44mi |
| 1201 N College St Unit 1201-127 Killeen, TX | 2.0 | 1.0 | 640 | $700 | $1.09 | 25d | 1 | 0.44mi |
| 1203 N College St Unit 1203-201 Killeen, TX | 2.0 | 1.0 | 640 | $675 | $1.05 | 46d | 1 | 0.45mi |
| 1203 N College St Unit 1203-207 Killeen, TX | 2.0 | 2.0 | 980 | $725 | $0.74 | 46d | 1 | 0.45mi |
| 1203 N College St Unit 1203-213 Killeen, TX | 2.0 | 1.0 | 685 | $675 | $0.99 | 25d | 1 | 0.45mi |
| 1801 Stewart St Unit A Killeen, TX | 3.0 | 2.0 | 872 | $1,045 | $1.20 | 16d | 1 | 0.49mi |
| 414 East Avenue A Unit 106 Killeen, TX | 2.0 | 1.0 | 800 | $705 | $0.88 | 16d | 1 | 0.50mi |
| 414 East Avenue A #200 Killeen, TX | 1.0 | 1.0 | 700 | $595 | $0.85 | 46d | 1 | 0.50mi |
| 608 N 18th St Unit B Killeen, TX | 3.0 | 1.0 | 838 | $915 | $1.09 | 16d | 1 | 0.51mi |
| 509 N 14th St Killeen, TX | 1.0 | 1.0 | 568 | $600 | $1.06 | 46d | 1 | 0.51mi |
| 509 N 14th St Unit 8 Killeen, TX | 1.0 | 1.0 | 568 | $585 | $1.03 | 16d | 1 | 0.51mi |
| 1714 Stewart St Killeen, TX | 2.0 | 1.0 | 729 | $950 | $1.30 | 46d | 1 | 0.51mi |
| 602 N 2nd St Unit 1 D Killeen, TX | 2.0 | 1.0 | 528 | $625 | $1.18 | 46d | 1 | 0.52mi |
| 602 N 2nd St Unit 3 B Killeen, TX | 2.0 | 1.0 | 528 | $600 | $1.14 | 23d | 1 | 0.52mi |
| 1108 Stewart St Killeen, TX | 3.0 | 1.0 | 995 | $1,150 | $1.16 | 25d | 1 | 0.52mi |
| 905 Parmer Ave Unit B Killeen, TX | 3.0 | 1.0 | 836 | $850 | $1.02 | 16d | 1 | 0.52mi |
| 1302 Harris Ave Killeen, TX | 1.0 | 1.0 | 550 | $575 | $1.05 | 16d | 2 | 0.53mi |
| 121 West Avenue A Unit 121 2 Killeen, TX | 2.0 | 1.0 | 661 | $900 | $1.36 | 25d | 1 | 0.56mi |
| 1710 Cole St Unit B Killeen, TX | 2.0 | 1.0 | 850 | $750 | $0.88 | 46d | 1 | 0.57mi |
| 608 W Dean Ave Killeen, TX | 2.0 | 1.0 | 775 | $1,000 | $1.29 | 25d | 1 | 0.58mi |
Listing history 17 events
-
2026-05-01status Pending
-
2026-04-21historical Active Under Contract
-
2026-03-26price $95,000
-
2025-10-21price $85,000
-
2025-10-17price $95,000
-
2025-09-17price $85,000
-
2025-08-08price $95,000
-
2025-07-18price $99,900
-
2025-07-03status Active
-
2025-06-30status Pending
-
2025-04-24$117,500 Active
-
2020-05-18soldstatus
-
2009-12-30soldstatus $28,000 106-char remark
Show marketing remark (106 chars)
Nice home that has been converted to a 2 bedroom 2 bath. This one can be bought by itself or in a package.
-
2009-05-29$28,900
Show marketing remark (106 chars)
Nice home that has been converted to a 2 bedroom 2 bath. This one can be bought by itself or in a package.
-
2009-05-29$28,900 106-char remark
Show marketing remark (106 chars)
Nice home that has been converted to a 2 bedroom 2 bath. This one can be bought by itself or in a package.
-
2009-04-30historical
-
2008-12-12$39,900
ⓘ Source: listings_history table (triggers on properties + properties_extension) + one-shot
backfill from property_details.listing_events for pre-trigger history.
Tax reassessment forecast TX · Resets to sale price
- Current annual tax
- $1,952 · $163/mo
- Projected year-2 tax
- $1,952 · $163/mo
- Expected delta
- $0/yr ($0/mo · 0.0%)
ⓘ Screening estimate from a state-policy table — verify with the county assessor before closing.
Climate risk First Street
- Flood 1/10 Low FEMA zone X (unshaded) · 0% chance over 30 yrs
- Wildfire 2/10 Low
- Heat 8/10 Severe 7 d/yr ≥107°F today · 24 d/yr by 30 yrs out
- Wind 6/10 Major 61% chance of damaging wind over 30 yrs
- Air quality 1/10 Low 0 unhealthy d/yr today · 0 by 30 yrs out
Nearby sold comps map
Loading sold comps map…
Walkable amenities ~0.75 mi
Loading nearby amenities…
Taxation est. · year 1
- Rental income
- $19,104
- − Mortgage interest
- −$5,321
- − Property taxes
- −$1,952
- − Insurance
- −$475
- − Repairs & maintenance
- −$1,528
- − Management
- −$1,528
- − Depreciation
- −$2,764
- Taxable income
- $5,536
- Est. tax owed @ 24.0%
- −$1,329
- After-tax cash flow
- $5,359/yr
For passive investors: Depreciation is non-cash, so a rental often shows a tax loss while cash-flowing — sheltering income. Rental losses are passive: they offset passive income freely, and up to $25,000/yr can offset ordinary (W-2) income if you actively participate and your MAGI is under $100k (phasing out to $0 by $150k); unused losses carry forward. On sale, claimed depreciation is recaptured at up to 25%, and gains may owe capital-gains tax (a 1031 exchange can defer both). Figures are a year-1 estimate at your 24.0% rate — not tax advice; consult a CPA.
Schools (NCES district)
- District
- Killeen ISD
- NCES district ID
- 4825660
- Math proficiency
- 31% ▼ -16.00%
- Reading proficiency
- 38% ▼ -3.00%
- Median HH income
- $47,665
- Composite
- 29.69/100
- National rank
- #6458
- State rank
- #524 of 826 in TX
Livability — Killeen
- Score
- 63/100
- State rank
- #853
- US rank
- #15359
Category grades
Schools grade is shown separately in the Schools card above.
Census & demographics
- Census place
- Killeen, TX
- County
- Bell County · 345,090 people
- City population
- 163,398
- Metro
- Killeen-Temple, TX
- Population (ZIP)
- 19,011
- Household income
- $37,349
- Rent vs Own
- Severe rent burden
- 1668.0
Population outlook (Bell County) Hauer SSP2
- Today (2025)
- 371,114 people
- By 2030
- 389,104 · +4.8%
- By 2040
- 420,592 · +13.3%
- By 2050
- 447,779 · +20.7%
- By 2075
- 499,130 · +34.5%
- By 2100
- 505,680 · +36.3%
Race, ethnicity, and origin ACS 2023
- Neighborhood character
- Highly diverse neighborhood (Simpson 0.73)
- Race & ethnicity
- Hispanic / Latino 32% White 31% Black 27% Two or more races 10% Asian 3% Pacific Islander 1%
- Hispanic origin (detail)
- Mexican 21% Puerto Rican 6% Dominican 1%
- Common ancestry
- Italian 2% Slovak 1% Lithuanian 1%
- Foreign-born
- 14% · Canada, Vietnam, South Korea
- Languages at home
- 69% English-only · Spanish 25% German/W. Germanic 2% Korean 1%
Political lean MEDSL · Bell
- 2024 margin
- R (+16.2) · D 41.3% · R 57.6% · Other 1.1%
- 2008→2024 swing
- -6.5pp toward R · 2008: -9.8pp · 2024: -16.2pp
- All cycles
- 2024: R+16.2 2020: R+8.5 2016: R+15.1 2012: R+16.4 2008: R+9.8
Not yet ingested
- Civics
- —
Market trends
- HPI YoY
- ▲ 2.26%
- Current HPI
- 168.1206
- Rent YoY
- ▼ -2.00%
- Metro
- Killeen-Temple, TX
- State GDP YoY
- ▲ 3.95%
- F500 in state
- 110
Industry mix (Fortune 500 HQ in TX)
| Industry | F500 HQs | Revenue |
|---|---|---|
| Energy | 16 | $1,198B |
|
||
| Technology | 5 | $198B |
|
||
| Engineering / Construction | 4 | $72B |
|
||
| Energy Services | 3 | $60B |
|
||
| Utilities | 3 | $41B |
|
||
| Healthcare | 2 | $330B |
|
||
Price history
+138.1% since first listed17 events — show timeline
- 2026-05-01 Pending — CTXMLS
- 2026-04-21 Contingent — CTXMLS
- 2026-03-26 Price Changed $95,000 CTXMLS
- 2025-10-21 Price Changed $85,000 CTXMLS
- 2025-10-17 Price Changed $95,000 CTXMLS
- 2025-09-17 Price Changed $85,000 CTXMLS
- 2025-08-08 Price Changed $95,000 CTXMLS
- 2025-07-18 Price Changed $99,900 CTXMLS
- 2025-07-03 Relisted — CTXMLS
- 2025-06-30 Pending — CTXMLS
- 2025-04-24 Listed $117,500 CTXMLS
- 2020-05-18 Sold (Public Records) — Public Records
- 2009-12-30 Sold (MLS) $28,000 CTXMLS
- 2009-05-29 Listed $28,900 CTXMLS
- 2009-05-29 Listed $28,900 CTXMLS
- 2009-04-30 Listing Removed — CTXMLS
- 2008-12-12 Listed $39,900 CTXMLS
Property tax history
+21.6%/yrLatest (2025): $1,952 · +20.8% YoY. Source: county tax records.
Cash-flow waterfall
monthlySold comps — $/sqft
last 12 mo · ≤1 miLoading sold comps…