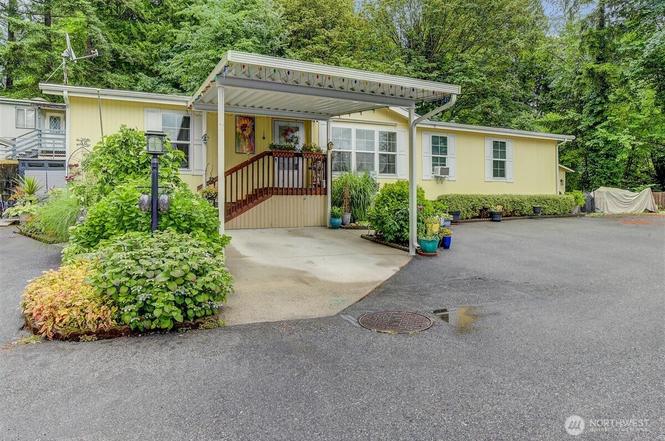
22623 31st Ave SE Unit A6 · Bothell, WA
Flood risk No data
- FEMA flood zone
- —
- Chance of flooding over 30 yrs
- —
- Est. flood insurance / yr
- —
Fire risk No data
- Est. fire insurance / yr
- —
Heat risk No data
- Hot days now (above threshold)
- —
- Hot days in 30 yrs
- —
Wind risk No data
- Chance of severe wind over 30 yrs
- —
Air-quality risk No data
- Unhealthy air days now
- —
- Unhealthy air days in 30 yrs
- —
Risk factors via First Street. Map © Google.
Why this score? — see what drove the B grade
The composite is a weighted blend of 9 inputs, each scored 0–100. Each bar is that input's sub-score; the figure is the points it added to the 100-point composite (weight × sub-score).
- Cash flow +30.0/30.0
- DSCR +10.0/10.0
- 1% rule +8.7/10.0
- ARV discount +7.5/15.0
- Schools +6.7/10.0
- Livability +4.2/5.0
- Condition / age +3.8/5.0
- Rent growth +2.9/5.0
- Appreciation +0.0/10.0
$249,950
🖨 Deal sheet 📄 Offer letter ✓ Due diligence
Listing remarks
Turn key and ready for the next chapter! Excellent condition 3 bedroom, 2 bathroom home in the desirable 55+ Canyon Park. Home is light, bright & welcoming with vaulted ceilings, skylights & covered porch perfect for your morning coffee or tea. The spacious kitchen with all appliances included is ready for your culinary artistry with plenty of cabinet & counter space, center island & large pantry. Primary bedroom with en-suite bathroom has a walk-in jetted soaking tub. Home is very private in a small cul-de-sac and has Penny Creek directly next to it. Excellent location for all amenities - shopping, restaurants, parks, freeway, mass transit, everything you need, just
Key facts
- Covered porch
- Spacious kitchen
- Small cul-de-sac
Tags
Property features AI
Finance
- Other: Mobile home remains on site; Model: MARO 28x66; Approx. 1566 total building area (per public records)
- Financial info: Accepts Cash, Conventional, FHA
- HOA & community: Located in Canyon Mobile Park (senior community); Park amenities include clubhouse, common area, sidewalks; Park approved for sale; Land lease applicable
Exterior
- Parking: Carport
- Utilities: Public water; Sewer handled by Guardian; Electric power (Snohomish PUD)
- Home design: Manufactured double-wide home; One level; West-facing
- Construction: Wood construction; Composition roof; Manufactured after 06/15/1976
- Exterior features: Wood exterior products; Located on a cul-de-sac; Paved access; Sidewalks; Has a view
Interior
- Kitchen: Dishwasher; Microwave; Refrigerator; Stove/Range
- Bedrooms: 3 bedrooms
- Flooring: Engineered hardwood; Vinyl; Carpet
- Bathrooms: 2 full bathrooms
- Heating & cooling: Forced air heating; Electric energy source
- Interior features: Vaulted ceilings; Skylights; Ceiling fan(s); Jetted/soaking tub; Bath off primary; Walk-in closet(s)
- Laundry & utility: Washer; Dryer
Neighborhood map
What this means for you Summary
Snapshot
- This is a 3-bed/2.0-bath manufactured listed at $250k. Condition is rated good.
Deal economics
- At list price, monthly cash flow is $970 ($12k/yr) — positive.
- The deal already cash-flows at list — no discount required.
- Meets the 1% rule at list price ($3k rent vs $250k).
- Cap rate 10.9% vs local median 1.5% in Bothell — top-decile yield for the area; either an underpriced asset or a hidden risk that comps aren't pricing in. Stress-test before assuming the spread holds.
Location & tenants
- Location reads 83/100 on livability (#53 in WA, #962 nationally) — a professional / high-income tenant draw. Strengths: schools A+, commute A+, employment A+; Watch: amenities C-, cost of living F.
- Northshore School District (suburban): math 69% / reading 78% proficiency, ranked #9 of 291 in WA (top 3%) — strong family-tenant draw, lease renewals of 3-5y typical; only 12% free/reduced lunch — higher-income household profile.
- Market conditions: Rents rising (+1.8%/yr); 254 active listings in the ZIP; 16 comparable units currently listed for rent nearby; rentals at typical pace (median 15d on market — plan ~3-4 weeks tenant-placement turnaround); high-income renter base; 3,982 units permitted in Snohomish County in 2024 (1,492 in 5+ unit buildings).
Forward outlook
- Local home prices are declining (-3.0%/yr); year-one equity from $2k of loan paydown is wiped out by about $7k of value loss. Plan a longer hold.
- Snohomish County population projected at +30% by 2050 — long-run rental-demand tailwind backs the buy-and-hold thesis.
- At projected returns (-3.0% appreciation + 1.8% rent growth), your $70k cash investment doubles in ~8 years — after that, you're playing with house money.
Negotiation context
- Only 8 days on market — expect competitive offers; lowballing is unlikely to land.
Questions for the listing agent
- Is there a deadline driving the sale (1031 exchange, divorce, estate, relocation)? That informs how much negotiation room exists.
- Schools are A-rated — typically a magnet for longer-tenancy family renters. What's the average tenant stay here, and is there a school-zone premium baked into asking?
- What's the average days-on-market for RENTAL listings here right now (not sales)? A rising rental-DOM trend means longer vacancies and softer asking-rent achievability than the comps imply.
- What's the recent tenant-quality profile in this submarket — average credit score on applications, eviction rate, late-payment / NSF rate, and stable-employment percentage? A property-management company in the area should have these aggregated.
- How much new for-sale + rental construction is in the pipeline within 1–3 miles? Heavy new supply typically softens prices + rents 12–24 months out; constrained supply supports both.
Investment metrics
- 1% rule
- 1.37% ✓
- Cap rate
- 10.95%
- Cash-on-cash
- 16.63%
- DSCR
- 1.74
- GRM
- 6.1
CMA / ARV
- ARV (on-the-fly)
- $140,940
- Comps found
- 2
Show comp detail 2 sales within ~0.75 mi
| Address | Dist | Beds/Ba | Sqft | Sold | Price | $/sf | Match |
|---|---|---|---|---|---|---|---|
| 3333 228th St SE #94 | 0.15mi | 2/2.0 (-1) | 1,440 (-8%) | 2mo | $30,000 | $21 | 73 |
| 3333 228th St SE #100 | 0.15mi | 3/2.0 | 1,336 (-15%) | 6mo | $120,000 | $90 | 63 |
Match score weights: distance 35% · size 25% · config 20% · recency 20%. Top-matched comps best support the ARV.
Projected returns pro-forma
-3.0% appreciation · 1.75% rent growth · sell at horizon
- IRR
- 6.4%
- Equity multiple
- 1.24×
- Total profit
- $17,071
- Equity at exit
- $37,268
- IRR
- 14.6%
- Equity multiple
- 2.11×
- Total profit
- $77,633
- Equity at exit
- $21,611
Cash invested: $69,986 (down + closing). Projections, not guarantees.
Landlord ↔ Tenant lean methodology
- Overall (STATE)
- 28 Tenant-Leaning
- State Washington
- 28 Tenant-Leaning · D+8
- County
- — inherits STATE
- City
- — inherits STATE
ZIP-level market 98021
- Rents YoY
- 1.8%
- Active inventory
- 254
- Price-to-rent
- 6.1×
Monthly cashflow live
- Estimated rent
- $3,414 high interval (Pro) →
- Mortgage (P&I)
- −$1,311
- Tax est. 1.5%
- −$312 /mo · $3,749/yr
- Insurance
- −$104
- HOA
- −$0
- Vacancy / Maint / Mgmt
- −$717
- Net cashflow
- $970
Break-even live
UW: 25.0% down · 7.5% · 30yr · 1.5% tax · 5.0% vac · 8.0% maint · 8.0% mgmt
Financing live
Cash to close
- Down payment
- $62,488
- Closing costs
- $7,498
- Reserves months
- —
- Total cash needed
- —
Loan-product check · same deal, 3 products live
Conventional
25% down · 7.5% · 30yr
- Down + closing
- —
- Monthly P&I
- —
- Monthly cashflow
- —
- DSCR
- —
- Eligible?
- —
Personal DTI + credit; lowest rate.
DSCR
20% down · 8.5% · 30yr
- Down + closing
- —
- Monthly P&I
- —
- Monthly cashflow
- —
- DSCR
- —
- Eligible?
- —
No personal income docs; deal must DSCR.
Hard money
10% down · 12.0% · 12mo
- Down + closing
- —
- Monthly P&I
- —
- Monthly cashflow
- —
- DSCR
- —
- Eligible?
- —
Short-term bridge; refi at stabilization.
Rent comps 16 comps
| Address | Beds | Baths | Sqft | Rent | $/sqft | DOM | Units | Dist |
|---|---|---|---|---|---|---|---|---|
| 23028 27th Ave SE Bothell, WA | 1.0–3.0 | 1.0–2.0 | 880 | $3,348 | $3.80 | 1d | 16 | 0.37mi |
| 3610 223rd Pl SE Bothell, WA | 4.0 | 3.0 | 2046 | $13,500 | $6.60 | 24d | 1 | 0.40mi |
| 22823 23rd Ave SE #8 Bothell, WA | 4.0 | 3.5 | 2201 | $3,900 | $1.77 | 43d | 1 | 0.54mi |
| 2207 227th St SE Bothell, WA | 1.0–3.0 | 1.0–2.0 | 846 | $2,767 | $3.27 | 1d | 8 | 0.55mi |
| 4131 228th Pl SE Bothell, WA | 4.0 | 2.5 | 2151 | $3,700 | $1.72 | 20d | 1 | 0.69mi |
| 22923 41st Dr SE Bothell, WA | 4.0 | 2.5 | 2169 | $3,500 | $1.61 | 15d | 1 | 0.71mi |
| 1630 228th St SE Bothell, WA | 1.0–3.0 | 1.0–2.0 | 940 | $3,057 | $3.25 | 1d | 11 | 0.87mi |
| 23940 40th Dr SE Bothell, WA | 1.0–3.0 | 1.0–2.5 | 1151 | $3,637 | $3.16 | 1d | 12 | 1.03mi |
| 21623 16th Dr SE Bothell, WA | 1.0–3.0 | 1.0–2.0 | 990 | $3,295 | $3.33 | 2d | 11 | 1.12mi |
| 2319 210th St SE Bothell, WA | 4.0 | 2.5 | 1742 | $3,800 | $2.18 | 24d | 1 | 1.15mi |
| 20707 31st Dr SE Bothell, WA | 2.0 | 2.0 | 1334 | $2,740 | $2.05 | 18d | 1 | 1.23mi |
| 1145 215th Pl SE Bothell, WA | 3.0 | 2.5 | 1916 | $3,195 | $1.67 | 5d | 1 | 1.36mi |
| 2129 Maltby Rd Bothell, WA | 3.0 | 2.0 | 1207 | $2,195 | $1.82 | 5d | 4 | 1.41mi |
| 20012 101st Pl NE Bothell, WA | 4.0 | 2.0 | 1593 | $3,900 | $2.45 | 15d | 1 | 1.41mi |
| 20012 101st Pl NE Bothell, WA | 4.0 | 2.0 | 1593 | $3,300 | $2.07 | 1d | 1 | 1.41mi |
| 20030 7th Dr SE Bothell, WA | 3.0 | 3.0 | 2010 | $3,900 | $1.94 | 18d | 1 | 1.43mi |
Listing history 7 events
-
2026-06-18days on market $249,950 Active 8 DOM
-
2026-06-17days on market $249,950 Active 7 DOM
-
2026-06-16days on market $249,950 Active 6 DOM
-
2026-06-15days on market $249,950 Active 5 DOM
-
2026-06-13days on market $249,950 Active 3 DOM
-
2026-06-13remarks 683-char remark
-
2026-06-13$249,950 Active 2 DOM
ⓘ Source: listings_history table (triggers on properties + properties_extension) + one-shot
backfill from property_details.listing_events for pre-trigger history.
Nearby sold comps map
Loading sold comps map…
Walkable amenities ~0.75 mi
Loading nearby amenities…
Taxation est. · year 1
- Rental income
- $40,968
- − Mortgage interest
- −$14,001
- − Property taxes
- −$3,749
- − Insurance
- −$1,250
- − Repairs & maintenance
- −$3,277
- − Management
- −$3,277
- − Depreciation
- −$7,271
- Taxable income
- $8,142
- Est. tax owed @ 24.0%
- −$1,954
- After-tax cash flow
- $9,683/yr
For passive investors: Depreciation is non-cash, so a rental often shows a tax loss while cash-flowing — sheltering income. Rental losses are passive: they offset passive income freely, and up to $25,000/yr can offset ordinary (W-2) income if you actively participate and your MAGI is under $100k (phasing out to $0 by $150k); unused losses carry forward. On sale, claimed depreciation is recaptured at up to 25%, and gains may owe capital-gains tax (a 1031 exchange can defer both). Figures are a year-1 estimate at your 24.0% rate — not tax advice; consult a CPA.
Condition & rehab AI · 14 photos
This 3-bedroom, 2-bathroom home in Canyon Park is in good condition with a turnkey setup, ready for the next chapter.
Value-add opportunities
- Resale Paint exterior siding — Enhances curb appeal and value
- Rental Clean gutters — Keeps property in good condition and reduces maintenance costs
Renovation cost estimate screening
Value-add ROI direction
- Resale Paint exterior siding — Enhances curb appeal and value ↑
- Rental Clean gutters — Keeps property in good condition and reduces maintenance costs ↑
ⓘ Cost ranges are severity-bucket heuristics (US national rule-of-thumb). Get contractor quotes + a written scope before underwriting a rehab budget.
Schools (NCES district)
- District
- Northshore School District
- NCES district ID
- 5305910
- Math proficiency
- 69% ▼ -3.00%
- Reading proficiency
- 78% ▼ -1.00%
- Median HH income
- $92,951
- Composite
- 67.41/100
- National rank
- #826
- State rank
- #9 of 291 in WA
Livability — Bothell
- Score
- 83/100
- State rank
- #53
- US rank
- #962
Category grades
Schools grade is shown separately in the Schools card above.
Census & demographics
- Census place
- Bothell, WA
- County
- Snohomish County · 786,756 people
- City population
- 141,635
- Metro
- Seattle-Tacoma-Bellevue, WA
- Population (ZIP)
- 35,631
- Household income
- $183,786
- Rent vs Own
- Severe rent burden
- 413.0
Population outlook (Snohomish County) Hauer SSP2
- Today (2025)
- 899,800 people
- By 2030
- 960,975 · +6.8%
- By 2040
- 1,074,447 · +19.4%
- By 2050
- 1,171,954 · +30.2%
- By 2075
- 1,384,849 · +53.9%
- By 2100
- 1,497,296 · +66.4%
Race, ethnicity, and origin ACS 2023
- Neighborhood character
- Diverse neighborhood (Simpson 0.61)
- Race & ethnicity
- White 55% Asian 29% Two or more races 9% Hispanic / Latino 9% Black 1%
- Hispanic origin (detail)
- Mexican 6%
- Common ancestry
- Portuguese 4% Italian 3% Lithuanian 2%
- Foreign-born
- 29% · China, Canada, South Korea
- Languages at home
- 65% English-only · Other Indo-European 11% Other Asian/Pacific 6% Chinese 6%
Political lean MEDSL · Snohomish
- 2024 margin
- D (+19.0) · D 57.8% · R 38.9% · Other 3.3%
- 2008→2024 swing
- +0.1pp no change · 2008: 18.9pp · 2024: 19.0pp
- All cycles
- 2024: D+19.0 2020: D+20.6 2016: D+16.6 2012: D+16.2 2008: D+18.9
Not yet ingested
- Civics
- —
Market trends
- HPI YoY
- ▼ -903.22%
- Current HPI
- 380.5475
- Rent YoY
- ▲ 1.75%
- Metro
- Seattle-Tacoma-Bellevue, WA
- State GDP YoY
- ▲ 4.65%
- F500 in state
- 22
Industry mix (Fortune 500 HQ in WA)
| Industry | F500 HQs | Revenue |
|---|---|---|
| Retail | 2 | $269B |
|
||
| Technology / Retail | 1 | $638B |
|
||
| Technology | 1 | $245B |
|
||
| Telecommunications | 1 | $38B |
|
||
| Food / Beverage | 1 | $36B |
|
||
| Automotive / Trucks | 1 | $34B |
|
||
Price history
1 event — show timeline
- 2026-06-10 Listed $249,950 NWMLS as Distributed by MLS Grid
Cash-flow waterfall
monthlySold comps — $/sqft
last 12 mo · ≤1 miLoading sold comps…