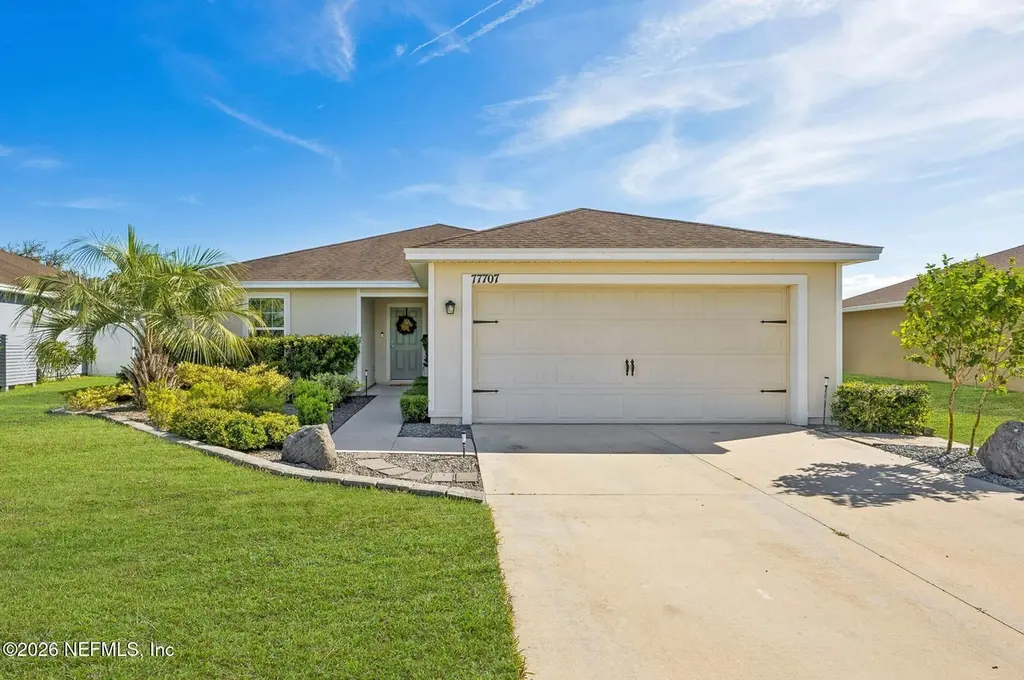
77707 Lumber Creek Blvd · Yulee, FL
Flood risk 1/10 · Minimal
- FEMA flood zone
- X (unshaded)
- Chance of flooding over 30 yrs
- 0.0%
- Est. flood insurance / yr
- $507 – $1,088
Fire risk 9/10 · Severe
- Est. fire insurance / yr
- $947 – $1,759
Heat risk 9/10 · Severe
- Hot days now (above 106°F)
- 7 days/yr
- Hot days in 30 yrs
- 20 days/yr
Wind risk 9/10 · Severe
- Chance of severe wind over 30 yrs
- 99.0%
Air-quality risk 5/10 · Moderate
- Unhealthy air days now
- 6 days/yr
- Unhealthy air days in 30 yrs
- 7 days/yr
Risk factors via First Street. Map © Google.
Why this score? — see what drove the F grade
The composite is a weighted blend of 9 inputs, each scored 0–100. Each bar is that input's sub-score; the figure is the points it added to the 100-point composite (weight × sub-score).
- Appreciation +10.0/10.0
- Cash flow +6.6/30.0
- Schools +6.0/10.0
- Livability +3.3/5.0
- Rent growth +3.2/5.0
- Condition / age +2.5/5.0
- 1% rule +1.5/10.0
- DSCR +0.9/10.0
- ARV discount +0.0/15.0
$360,000
🖨 Deal sheet (PDF) 📄 Offer letter ✓ Due diligence
Listing remarks MLS
The beautiful Sunnyside floor plan by LGI Homes is located within the masterly planned community of Lumber Creek. This new one-story home features an open floor plan, 3 bedrooms and 2 full bathrooms complete with more $10,000 in upgrades including energy-efficient appliances, custom built cabinets, granite counters and an attached 2 car garage. This spacious home includes a master suite, complete with a full bath and walk-in closet, as well as a utility room, covered back patio and front yard landscaping, all just steps from beautiful amenities including a pool, walking trails and playground.
Key facts
- Community pool
- Upgraded kitchen
- Finished garage
Tags
Property features AI
Finance
- Other: Community pool (not private)
- HOA & community: Community association with playground; Association fee of $336 semi-annually; Sidewalks in the community
Exterior
- Parking: Garage; 2-car garage
- Utilities: Public sewer; Electricity connected; Water connected; Asphalt road access
- Home design: Single-family residence; One level
- Construction: Frame construction; Shingle roof
- Exterior features: Fire pit; Awning-covered patio and rear porch; Porch; Patio; Shed(s); Vinyl fenced backyard
Interior
- Kitchen: Dishwasher; Electric range; Microwave; Refrigerator
- Bedrooms: 4 bedrooms
- Flooring: Carpet; Laminate
- Bathrooms: 2 full bathrooms
- Heating & cooling: Central heating; Central air conditioning
- Interior features: Breakfast bar; Breakfast nook; Ceiling fans; Open floor plan; Split bedroom layout
Neighborhood map
What this means for you Summary
Snapshot
- This is a 3-bed/2.0-bath single-family listed at $360k.
Deal economics
- At list price, monthly cash flow is $-590 ($-7k/yr) — negative.
- To cash-flow at today's rent, offer at most $256k (29.0% below list).
- To meet the 1% rule (rent ≥ 1% of price), the offer needs to be $232k (35.4% below list).
- Recommended offer: $232k (35.4% below list) — sets the bar for 1% rule.
- Cap rate 4.3% vs local median 3.3% in Yulee — top-decile yield for the area; either an underpriced asset or a hidden risk that comps aren't pricing in. Stress-test before assuming the spread holds.
Location & tenants
- Location reads 66/100 on livability (#605 in FL) — a middle-class / working-renter tenant base. Strengths: housing A+, cost of living A-, crime B+; Watch: amenities F, commute F, health & safety F.
- Nassau (town): math 74% / reading 65% proficiency, ranked #4 of 73 in FL (top 6%) — acceptable for families but not a draw, mixed tenant base, ~2y average lease.
- Market conditions: Rents rising (+2.9%/yr); 601 active listings in the ZIP; 8 comparable units currently listed for rent nearby; rentals at typical pace (median 26d on market — plan ~3-4 weeks tenant-placement turnaround); solid renter incomes; 953 units permitted in Nassau County in 2024 (24 in 5+ unit buildings).
Forward outlook
- In year one you build about $38k of equity ($2k loan paydown + $36k appreciation (10.0% local appreciation)).
- Nassau County population projected at +17% by 2050 — long-run rental-demand tailwind backs the buy-and-hold thesis.
- By year 2, paydown + projected appreciation supports a ~$62k cash-out refi (75% LTV) — recoverable capital for the next deal without selling this one.
Negotiation context
- Only 10 days on market — expect competitive offers; lowballing is unlikely to land.
- 2 sale attempts since 7y ago with the ask held roughly flat each time — persistent listings suggest the price (not the market) is what's stuck; bring a comps-based counter.
- Current owner paid $225k; list at $360k implies a 60% gain — meaningful room to come down on a strong offer.
Risks & watch-outs
- Climate carrying-cost: severe wind risk, 99% chance of damaging wind over 30y; severe wildfire risk; extreme-heat days projected 7→20/yr by 2055 (HVAC capex compounding) — expect insurance premiums to compound above CPI over the hold.
Questions for the listing agent
- What do current leases actually rent for vs. the listed asking? Can we see a recent rent roll and the last 12 months of T-12 income?
- What does the HOA fee cover, when was the last increase, and are there any pending special assessments or reserve-fund shortfalls?
- Is there a deadline driving the sale (1031 exchange, divorce, estate, relocation)? That informs how much negotiation room exists.
- Schools are B-rated — typically a magnet for longer-tenancy family renters. What's the average tenant stay here, and is there a school-zone premium baked into asking?
- The area grade is low — what's the realistic commute time and amenity access for the typical tenant pool here? Any planned neighborhood developments (good or bad) we should know about?
- What's the average days-on-market for RENTAL listings here right now (not sales)? A rising rental-DOM trend means longer vacancies and softer asking-rent achievability than the comps imply.
- What's the recent tenant-quality profile in this submarket — average credit score on applications, eviction rate, late-payment / NSF rate, and stable-employment percentage? A property-management company in the area should have these aggregated.
- How much new for-sale + rental construction is in the pipeline within 1–3 miles? Heavy new supply typically softens prices + rents 12–24 months out; constrained supply supports both.
Investment metrics
- 1% rule
- 0.65% ✗
- Cap rate
- 4.33%
- Cash-on-cash
- -7.03%
- DSCR
- 0.69
- GRM
- 12.9
CMA / ARV
- ARV (on-the-fly)
- $297,799
- Comps found
- 12
Show comp detail 12 sales within ~0.75 mi
| Address | Dist | Beds/Ba | Sqft | Sold | Price | $/sf | Match |
|---|---|---|---|---|---|---|---|
| 77720 Lumber Creek Blvd | 0.04mi | 3/2.0 | 1,543 (0%) | 3mo | $335,000 | $217 | 96 |
| 77723 Lumber Creek Blvd | 0.04mi | 3/2.0 | 1,629 (+6%) | 2mo | $287,000 | $176 | 87 |
| 77314 Mosswood Dr | 0.15mi | 3/2.0 | 1,543 (0%) | 11mo | $325,000 | $211 | 84 |
| 77422 Lumber Creek Blvd | 0.33mi | 3/2.0 | 1,543 (0%) | 2mo | $320,000 | $207 | 83 |
| 77799 Lumber Creek Blvd | 0.25mi | 3/2.0 | 1,629 (+6%) | 1mo | $298,000 | $183 | 78 |
| 77814 Lumber Creek Blvd | 0.29mi | 3/2.0 | 1,629 (+6%) | 2mo | $288,000 | $177 | 76 |
| 77175 Sawmill Ct | 0.14mi | 3/2.0 | 1,686 (+9%) | 7mo | $324,900 | $193 | 72 |
| 77009 Birdseye Ct | 0.14mi | 3/2.0 | 1,629 (+6%) | 16mo | $307,500 | $189 | 71 |
| 77447 Lumber Creek Blvd | 0.32mi | 3/2.0 | 1,686 (+9%) | 13mo | $320,000 | $190 | 58 |
| 77338 Lumber Creek Blvd | 0.42mi | 3/2.0 | 1,383 (-10%) | 12mo | $315,000 | $228 | 53 |
| 85402 Trinity Cir | 0.68mi | 3/2.0 | 1,479 (-4%) | 11mo | $210,000 | $142 | 52 |
| 86774 Cartesian Pointe Dr | 0.73mi | 3/2.0 | 1,356 (-12%) | 12mo | $310,000 | $229 | 36 |
Match score weights: distance 35% · size 25% · config 20% · recency 20%. Top-matched comps best support the ARV.
Projected returns pro-forma
10.0% appreciation · 2.88% rent growth · sell at horizon
- IRR
- 19.3%
- Equity multiple
- 2.57×
- Total profit
- $158,198
- Equity at exit
- $324,317
- IRR
- 17.8%
- Equity multiple
- 5.91×
- Total profit
- $494,852
- Equity at exit
- $699,401
Cash invested: $100,800 (down + closing). Projections, not guarantees.
Landlord ↔ Tenant lean methodology
- Overall (STATE)
- 87 Strongly Landlord-Friendly
- State Florida
- 87 Strongly Landlord-Friendly · R+3
- County
- — inherits STATE
- City
- — inherits STATE
ZIP-level market 32097
- Home prices YoY
- 19.5%
- Rents YoY
- 2.9%
- Active inventory
- 601
- Price-to-rent
- 12.9×
Monthly cashflow live
- Estimated rent
- $2,325 high interval (Pro) →
- Mortgage (P&I)
- −$1,888
- Tax from tax record
- −$333 /mo · $3,995/yr
- Insurance
- −$150
- HOA
- −$56
- Vacancy / Maint / Mgmt
- −$488
- Net cashflow
- $-590
Break-even live
Sensitivity live
| Price | -10% $-386 | -5% $-488 | +0% $-590 | +5% $-692 | +10% $-794 |
|---|---|---|---|---|---|
| Rent | -10% $-774 | -5% $-682 | +0% $-590 | +5% $-498 | +10% $-406 |
| Rate | -1.0pp $-409 | -0.5pp $-499 | base $-590 | +0.5pp $-683 | +1.0pp $-778 |
UW: 25.0% down · 7.5% · 30yr · 1.5% tax · 5.0% vac · 8.0% maint · 8.0% mgmt
Financing live
Cash to close
- Down payment
- $90,000
- Closing costs
- $10,800
- Reserves months
- —
- Total cash needed
- —
Loan-product check · same deal, 3 products live
Conventional
25% down · 7.5% · 30yr
- Down + closing
- —
- Monthly P&I
- —
- Monthly cashflow
- —
- DSCR
- —
- Eligible?
- —
Personal DTI + credit; lowest rate.
DSCR
20% down · 8.5% · 30yr
- Down + closing
- —
- Monthly P&I
- —
- Monthly cashflow
- —
- DSCR
- —
- Eligible?
- —
No personal income docs; deal must DSCR.
Hard money
10% down · 12.0% · 12mo
- Down + closing
- —
- Monthly P&I
- —
- Monthly cashflow
- —
- DSCR
- —
- Eligible?
- —
Short-term bridge; refi at stabilization.
Rent comps 8 comps
| Address | Beds | Baths | Sqft | Rent | $/sqft | DOM | Units | Dist |
|---|---|---|---|---|---|---|---|---|
| 77822 Lumber Creek Blvd Yulee, FL | 3.0 | 2.0 | 1543 | $2,200 | $1.43 | 25d | 1 | 0.28mi |
| 78295 Saddle Rock Rd Yulee, FL | 4.0 | 2.0 | 1846 | $2,191 | $1.19 | 25d | 1 | 0.37mi |
| 75530 Harvester St Yulee, FL | 2.0 | 2.5 | 1168 | $1,895 | $1.62 | 6d | 1 | 0.62mi |
| 8701 Hillpointe Cir Yulee, FL | 2.0 | 2.0 | 1170 | $1,647 | $1.41 | 9d | 15 | 1.11mi |
| 86624 Mainline Rd Yulee, FL | 2.0 | 2.5 | 1168 | $1,695 | $1.45 | 25d | 1 | 1.28mi |
| 86215 Buggy Ct Yulee, FL | 3.0 | 2.0 | 1675 | $2,295 | $1.37 | 22d | 1 | 1.38mi |
| 86229 Mainline Rd Yulee, FL | 3.0 | 2.0 | 1219 | $2,195 | $1.80 | 25d | 1 | 1.41mi |
| 86467 Moonlit Walk Cir Yulee, FL | 4.0 | 3.0 | 2010 | $3,100 | $1.54 | 25d | 1 | 1.47mi |
HOA detail
- Monthly dues
- $56 · $672/yr
- Likely covers
- landscapingpool
Listing history 8 events
-
2026-06-21days on market $360,000 Active 10 DOM
-
2026-06-18days on market $360,000 Active 7 DOM
-
2026-06-17days on market $360,000 Active 6 DOM
-
2026-06-16days on market $360,000 Active 5 DOM
-
2026-06-15days on market $360,000 Active 4 DOM
-
2026-06-13days on market $360,000 Active 2 DOM
-
2026-06-13remarks 691-char remark
-
2026-06-13$360,000 Active 1 DOM
ⓘ Source: listings_history table (triggers on properties + properties_extension) + one-shot
backfill from property_details.listing_events for pre-trigger history.
Tax reassessment forecast FL · Resets to sale price
- Current annual tax
- $3,995 · $333/mo
- Projected year-2 tax
- $3,995 · $333/mo
- Expected delta
- $0/yr ($0/mo · 0.0%)
ⓘ Screening estimate from a state-policy table — verify with the county assessor before closing.
Climate risk First Street
- Flood 1/10 Low FEMA zone X (unshaded) · 0% chance over 30 yrs
- Wildfire 9/10 Extreme
- Heat 9/10 Extreme 7 d/yr ≥106°F today · 20 d/yr by 30 yrs out
- Wind 9/10 Extreme 99% chance of damaging wind over 30 yrs
- Air quality 5/10 Major 6 unhealthy d/yr today · 7 by 30 yrs out
Nearby sold comps map
Loading sold comps map…
Walkable amenities ~0.75 mi
Loading nearby amenities…
Taxation est. · year 1
- Rental income
- $27,899
- − Mortgage interest
- −$20,166
- − Property taxes
- −$3,995
- − Insurance
- −$1,800
- − Repairs & maintenance
- −$2,232
- − Management
- −$2,232
- − HOA
- −$672
- − Depreciation
- −$10,473
- Taxable loss
- −$13,670
- Est. tax savings @ 24.0%
- +$3,281
- After-tax cash flow
- $-3,801/yr
For passive investors: Depreciation is non-cash, so a rental often shows a tax loss while cash-flowing — sheltering income. Rental losses are passive: they offset passive income freely, and up to $25,000/yr can offset ordinary (W-2) income if you actively participate and your MAGI is under $100k (phasing out to $0 by $150k); unused losses carry forward. On sale, claimed depreciation is recaptured at up to 25%, and gains may owe capital-gains tax (a 1031 exchange can defer both). Figures are a year-1 estimate at your 24.0% rate — not tax advice; consult a CPA.
Schools (NCES district)
- District
- Nassau
- NCES district ID
- 1201350
- Math proficiency
- 74% ▼ -2.00%
- Reading proficiency
- 65% ▼ -2.00%
- Median HH income
- $58,267
- Composite
- 59.79/100
- National rank
- #899
- State rank
- #4 of 73 in FL
Livability — Yulee
- Score
- 66/100
- State rank
- #605
- US rank
- #11615
Category grades
Schools grade is shown separately in the Schools card above.
Census & demographics
- County
- Nassau County · 67,729 people
- City population
- 26,700
- Metro
- Jacksonville, FL
- Population (ZIP)
- 26,700
- Household income
- $93,161
- Rent vs Own
- Severe rent burden
- 404.0
Population outlook (Nassau County) Hauer SSP2
- Today (2025)
- 88,419 people
- By 2030
- 92,679 · +4.8%
- By 2040
- 99,257 · +12.3%
- By 2050
- 103,378 · +16.9%
- By 2075
- 109,726 · +24.1%
- By 2100
- 107,006 · +21.0%
Race, ethnicity, and origin ACS 2023
- Neighborhood character
- Predominantly White (75%)
- Race & ethnicity
- White 75% Two or more races 9% Black 9% Hispanic / Latino 8% Asian 1% Native American 1%
- Hispanic origin (detail)
- Mexican 2% Puerto Rican 2%
- Common ancestry
- Lithuanian 4% Italian 3% Romanian 2%
- Foreign-born
- 4% · Canada, Vietnam
- Languages at home
- 93% English-only · Spanish 5% Vietnamese 1%
Political lean MEDSL · Nassau
- 2024 margin
- Solid R (+46.9) · D 26.1% · R 73.1%
- 2008→2024 swing
- -3.1pp toward R · 2008: -43.8pp · 2024: -46.9pp
- All cycles
- 2024: R+46.9 2020: R+45.9 2016: R+50.2 2012: R+48.6 2008: R+43.8
Not yet ingested
- Civics
- —
Market trends
- HPI YoY
- ▲ 49.35%
- Current HPI
- 301.9299
- Rent YoY
- ▲ 2.88%
- Metro
- Jacksonville, FL
- State GDP YoY
- ▲ 3.28%
- F500 in state
- 36
Industry mix (Fortune 500 HQ in FL)
| Industry | F500 HQs | Revenue |
|---|---|---|
| Industrial Technology | 2 | $29B |
|
||
| Insurance | 2 | $17B |
|
||
| Retail | 1 | $60B |
|
||
| Technology Distribution | 1 | $58B |
|
||
| Homebuilding | 1 | $35B |
|
||
| Technology Manufacturing | 1 | $35B |
|
||
Price history
+60.1% since first listed3 events — show timeline
- 2026-06-11 Listed $360,000 realMLS
- 2019-07-05 Sold (MLS) $224,900 realMLS
- 2019-04-10 Listed $224,900 realMLS
Property tax history
+38.5%/yrLatest (2025): $3,995 · +3.6% YoY. Source: county tax records.
Cash-flow waterfall
monthlySold comps — $/sqft
last 12 mo · ≤1 miLoading sold comps…