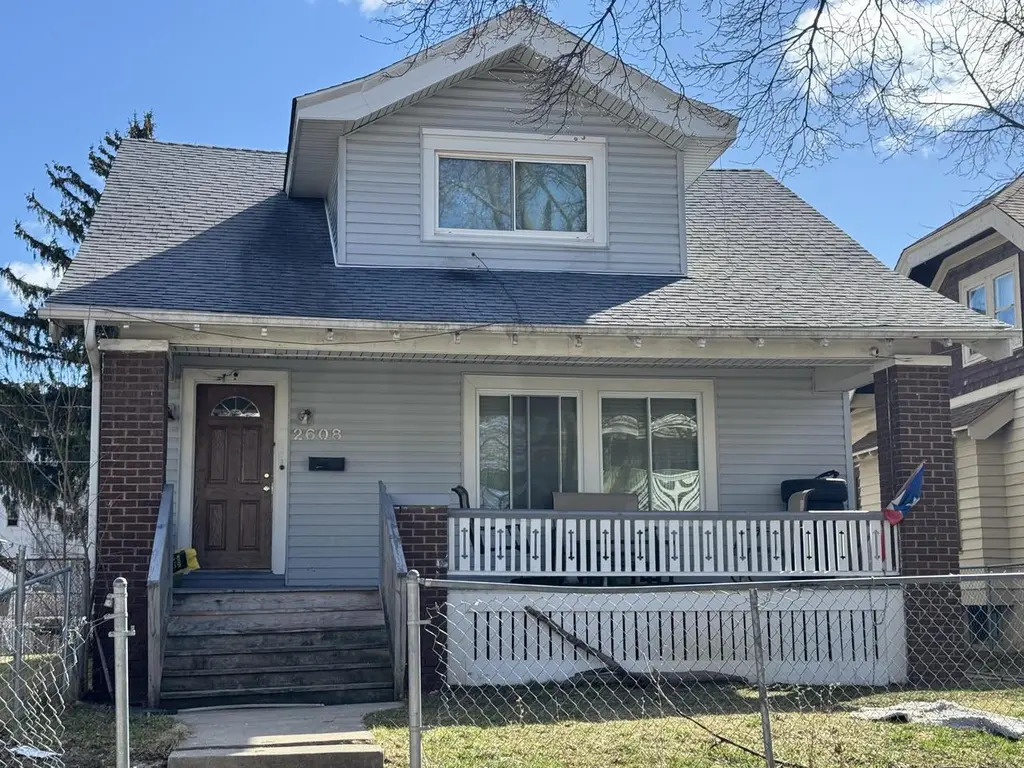
2608 N 45th St · Milwaukee, WI
Flood risk 1/10 · Minimal
- FEMA flood zone
- X (unshaded)
- Chance of flooding over 30 yrs
- 0.0%
- Est. flood insurance / yr
- $473 – $860
Fire risk 1/10 · Minimal
- Est. fire insurance / yr
- $636 – $1,182
Heat risk 2/10 · Minimal
- Hot days now (above 98°F)
- 7 days/yr
- Hot days in 30 yrs
- 13 days/yr
Wind risk 2/10 · Minimal
- Chance of severe wind over 30 yrs
- —
Air-quality risk 2/10 · Minimal
- Unhealthy air days now
- 2 days/yr
- Unhealthy air days in 30 yrs
- 2 days/yr
Risk factors via First Street. Map © Google.
Why this score? — see what drove the B- grade
The composite is a weighted blend of 9 inputs, each scored 0–100. Each bar is that input's sub-score; the figure is the points it added to the 100-point composite (weight × sub-score).
- Cash flow +23.5/30.0
- ARV discount +15.0/15.0
- 1% rule +8.6/10.0
- DSCR +7.5/10.0
- Livability +4.0/5.0
- Rent growth +3.5/5.0
- Condition / age +2.5/5.0
- Schools +1.2/10.0
- Appreciation +0.0/10.0
$137,500
🖨 Deal sheet 📄 Offer letter ✓ Due diligence
Listing remarks MLS
Don't miss this rare investor portfolio! Four Milwaukee properties offered together: 2608 N 45th St; 1114 N 25th St; 3048 N 36th St, A (duplex); and 2631 N 47th St; A (duplex). Priced at $499,900 for the entire package, this portfolio offers a mix of single-family and duplex units, with both occupied and vacant properties. Investors will benefit from immediate rental income along with significant value-add potential. Whether you're looking to expand your holdings or start building scale, this portfolio offers cash flow today and upside tomorrow. Sold as is. Cash or Hard Money preferred. Buyer to verify all information.
Key facts
- 4,791 sq ft lot
- Parking
- Built 1919
Property features AI
Exterior
- Parking: 1 parking space
- Utilities: Municipal water; Municipal sewer
- Home design: 1.5-story single-family home; Less than 1/2 acre lot
- Construction: Aluminum/steel exterior; Aluminum siding
- Exterior features: Patio; Sidewalks
Interior
- Kitchen: Kitchen on main level (approx. 10 x 10)
- Bedrooms: Master bedroom on main level (approx. 12 x 10); Second bedroom on main level (approx. 12 x 12); Two bedrooms on upper level (approx. 12 x 10 and 10 x 10); Fifth bedroom on upper level (approx. 10 x 10)
- Bathrooms: Two full bathrooms; Shower over tub
- Heating & cooling: Forced air heating; Natural gas
- Interior features: Living room on main level (approx. 15 x 12); Full block basement
Neighborhood map
What this means for you Summary
Snapshot
- This is a 5-bed/2.0-bath single-family listed at $138k.
Deal economics
- At list price, monthly cash flow is $255 ($3k/yr) — positive.
- The deal already cash-flows at list — no discount required.
- Meets the 1% rule at list price ($2k rent vs $138k).
- Recommended offer: $129k (6.0% below list) — sets the bar for market timing.
- Cap rate 8.5% vs local median 5.1% in Milwaukee — top-decile yield for the area; either an underpriced asset or a hidden risk that comps aren't pricing in. Stress-test before assuming the spread holds.
Location & tenants
- Location reads 81/100 on livability (#55 in WI, #1,534 nationally) — a professional / high-income tenant draw. Strengths: amenities A+, commute A+, cost of living A+; Watch: employment D+, schools F, crime F.
- Milwaukee School District (urban): math 10% / reading 18% proficiency, ranked #337 of 342 in WI (top 98%) — low school quality limits family demand, transient renter base, plan for 1-2y turnover; 77% free/reduced lunch — lower-income household profile, screen leases tightly.
- Market conditions: Rents rising (+3.8%/yr); 142 active listings in the ZIP; 5 comparable units currently listed for rent nearby; rentals at typical pace (median 24d on market — plan ~3-4 weeks tenant-placement turnaround); 1,017 units permitted in Milwaukee County in 2024 (803 in 5+ unit buildings).
- At $1,866/mo this rent would consume 46% of the median local household income ($48k/yr) (locally 1730% of renters already pay >50% of income on rent) — very limited rent-growth headroom before tenants either downsize or default.
Forward outlook
- Local home prices are declining (-3.0%/yr); year-one equity from $951 of loan paydown is wiped out by about $4k of value loss. Plan a longer hold.
- Milwaukee County population projected at +4% by 2050 — modest demand growth; plan on rents tracking national, not racing it.
Negotiation context
- It's been on market 85 days — a 6% lower offer ($129k) is reasonable based on typical stale-listing flexibility.
- 6 sale attempts since 13y ago with the ask held roughly flat each time — persistent listings suggest the price (not the market) is what's stuck; bring a comps-based counter.
Risks & watch-outs
- Watch-outs: property tax is 3.8% of price; built in 1919 — expect roof / HVAC / electrical / plumbing capex.
Questions for the listing agent
- It's been on market 85 days. Have you received any prior offers? Is the seller open to a 6% concession, seller financing, or rate buy-down credit?
- Built in 1919 — when were the roof, HVAC, electrical panel, plumbing, and water heater last replaced?
- Property tax is high relative to price — has the assessment been appealed recently, and will the sale trigger a re-assessment?
- Why hasn't it sold? Are there any deal-killer items the seller is aware of (foundation, flood, title, zoning, code violations)?
- Is there a deadline driving the sale (1031 exchange, divorce, estate, relocation)? That informs how much negotiation room exists.
- Schools are F-rated, which usually means shorter tenancies and higher turnover. Who's the typical renter profile here, and what's been the actual vacancy rate?
- Crime grade is F in this area — have there been break-ins, vandalism, or insurance claims at this property in the last 3 years? What carrier currently insures it and at what premium?
- What's the average days-on-market for RENTAL listings here right now (not sales)? A rising rental-DOM trend means longer vacancies and softer asking-rent achievability than the comps imply.
- What's the recent tenant-quality profile in this submarket — average credit score on applications, eviction rate, late-payment / NSF rate, and stable-employment percentage? A property-management company in the area should have these aggregated.
- How much new for-sale + rental construction is in the pipeline within 1–3 miles? Heavy new supply typically softens prices + rents 12–24 months out; constrained supply supports both.
Investment metrics
- 1% rule
- 1.36% ✓
- Cap rate
- 8.52%
- Cash-on-cash
- 7.96%
- DSCR
- 1.35
- GRM
- 6.1
CMA / ARV
- ARV (on-the-fly)
- $181,230
- Comps found
- 12
Show comp detail 12 sales within ~0.75 mi
| Address | Dist | Beds/Ba | Sqft | Sold | Price | $/sf | Match |
|---|---|---|---|---|---|---|---|
| 2335 N 44th St | 0.34mi | 5/2.0 | 1,811 (+5%) | 2mo | $210,000 | $116 | 74 |
| 2424 N 44th St | 0.23mi | 4/2.0 (-1) | 1,813 (+5%) | 3mo | $40,000 | $22 | 74 |
| 2804 N 38th St | 0.52mi | 5/2.0 | 1,800 (+4%) | 4mo | $196,000 | $109 | 65 |
| 2824 N 39th Street St N | 0.48mi | 5/1.5 | 1,621 (-6%) | 3mo | $111,920 | $69 | 63 |
| 2915 N 38th St | 0.58mi | 4/2.0 (-1) | 1,767 (+2%) | 2mo | $160,000 | $91 | 62 |
| 2956 N 39th St | 0.60mi | 5/2.0 | 1,812 (+5%) | 2mo | $206,000 | $114 | 62 |
| 2530 N 52nd St | 0.45mi | 4/1.0 (-1) | 1,681 (-3%) | 5mo | $135,000 | $80 | 61 |
| 2631 N 40th St | 0.31mi | 4/1.0 (-1) | 1,532 (-11%) | 0mo | $156,000 | $102 | 58 |
| 3061 N 52nd St | 0.75mi | 4/2.0 (-1) | 1,712 (-1%) | 4mo | $96,000 | $56 | 55 |
| 2702 N 38th St | 0.47mi | 4/2.0 (-1) | 1,536 (-11%) | 0mo | $162,000 | $105 | 54 |
| 2978 N 54th St | 0.73mi | 4/2.0 (-1) | 1,845 (+7%) | 2mo | $285,000 | $154 | 48 |
| 2180 N 51st St | 0.64mi | 4/2.0 (-1) | 1,469 (-15%) | 2mo | $280,000 | $191 | 38 |
Match score weights: distance 35% · size 25% · config 20% · recency 20%. Top-matched comps best support the ARV.
Projected returns pro-forma
-3.0% appreciation · 3.82% rent growth · sell at horizon
- IRR
- -2.9%
- Equity multiple
- 0.89×
- Total profit
- $-4,267
- Equity at exit
- $20,502
- IRR
- 8.0%
- Equity multiple
- 1.64×
- Total profit
- $24,492
- Equity at exit
- $11,888
Cash invested: $38,500 (down + closing). Projections, not guarantees.
Landlord ↔ Tenant lean methodology
- Overall (STATE)
- 73 Landlord-Friendly
- State Wisconsin
- 73 Landlord-Friendly · R+2
- County
- — inherits STATE
- City
- — inherits STATE
ZIP-level market 53210
- Home prices YoY
- -21.5%
- Rents YoY
- 3.8%
- Active inventory
- 142
- Price-to-rent
- 6.1×
Monthly cashflow live
- Estimated rent
- $1,866 high interval (Pro) →
- Mortgage (P&I)
- −$721
- Tax from tax record
- −$440 /mo · $5,281/yr
- Insurance
- −$57
- HOA
- −$0
- Vacancy / Maint / Mgmt
- −$392
- Net cashflow
- $255
Break-even live
UW: 25.0% down · 7.5% · 30yr · 1.5% tax · 5.0% vac · 8.0% maint · 8.0% mgmt
Financing live
Cash to close
- Down payment
- $34,375
- Closing costs
- $4,125
- Reserves months
- —
- Total cash needed
- —
Loan-product check · same deal, 3 products live
Conventional
25% down · 7.5% · 30yr
- Down + closing
- —
- Monthly P&I
- —
- Monthly cashflow
- —
- DSCR
- —
- Eligible?
- —
Personal DTI + credit; lowest rate.
DSCR
20% down · 8.5% · 30yr
- Down + closing
- —
- Monthly P&I
- —
- Monthly cashflow
- —
- DSCR
- —
- Eligible?
- —
No personal income docs; deal must DSCR.
Hard money
10% down · 12.0% · 12mo
- Down + closing
- —
- Monthly P&I
- —
- Monthly cashflow
- —
- DSCR
- —
- Eligible?
- —
Short-term bridge; refi at stabilization.
Rent comps 5 comps
| Address | Beds | Baths | Sqft | Rent | $/sqft | DOM | Units | Dist |
|---|---|---|---|---|---|---|---|---|
| 2137 N 47th St Milwaukee, WI | 5.0 | 2.0 | 1723 | $1,850 | $1.07 | 14d | 1 | 0.57mi |
| 3123 N 42nd St Milwaukee, WI | 4.0 | 1.0 | 1500 | $1,700 | $1.13 | 23d | 1 | 0.70mi |
| 2432 N 28th St Milwaukee, WI | 5.0 | 1.5 | 1876 | $1,600 | $0.85 | 43d | 1 | 1.11mi |
| 2308 W Clarke St Milwaukee, WI | 4.0 | 2.0 | 1545 | $1,750 | $1.13 | 23d | 1 | 1.43mi |
| 2704 W Concordia Ave Unit Na Milwaukee, WI | 5.0 | 2.0 | 1856 | $2,500 | $1.35 | 23d | 1 | 1.46mi |
Listing history 30 events
-
2026-06-18days on market $137,500 Active 85 DOM
-
2026-06-17days on market $137,500 Active 84 DOM
-
2026-06-16days on market $137,500 Active 83 DOM
-
2026-06-15days on market $137,500 Active 82 DOM
-
2026-06-13days on market $137,500 Active 80 DOM
-
2026-06-13days on market $137,500 Active 79 DOM
-
2026-06-10status $137,500 Active 76 DOM
-
2026-06-09days on market $137,500 Contingent 76 DOM
-
2026-06-08days on market $137,500 Contingent 75 DOM
-
2026-06-07days on market $137,500 Contingent 74 DOM
-
2026-06-05days on market $137,500 Contingent 71 DOM
-
2026-06-03days on market $137,500 Contingent 70 DOM
-
2026-06-02days on market $137,500 Contingent 69 DOM
-
2026-06-01days on market $137,500 Contingent 68 DOM
-
2026-05-31days on market $137,500 Contingent 67 DOM
-
2026-04-22historical Contingent
-
2026-03-25$137,500 Active
-
2025-10-07historical 627-char remark
Show marketing remark (627 chars)
Don't miss this rare investor portfolio! Four Milwaukee properties offered together: 2608 N 45th St; 1114 N 25th St; 3048 N 36th St, A (duplex); and 2631 N 47th St; A (duplex). Priced at $499,900 for the entire package, this portfolio offers a mix of single-family and duplex units, with both occupied and vacant properties. Investors will benefit from immediate rental income along with significant value-add potential. Whether you're looking to expand your holdings or start building scale, this portfolio offers cash flow today and upside tomorrow. Sold as is. Cash or Hard Money preferred. Buyer to verify all information.
-
2025-08-21$499,900 Active 627-char remark
Show marketing remark (627 chars)
Don't miss this rare investor portfolio! Four Milwaukee properties offered together: 2608 N 45th St; 1114 N 25th St; 3048 N 36th St, A (duplex); and 2631 N 47th St; A (duplex). Priced at $499,900 for the entire package, this portfolio offers a mix of single-family and duplex units, with both occupied and vacant properties. Investors will benefit from immediate rental income along with significant value-add potential. Whether you're looking to expand your holdings or start building scale, this portfolio offers cash flow today and upside tomorrow. Sold as is. Cash or Hard Money preferred. Buyer to verify all information.
-
2022-11-02soldstatus $388,000
-
2013-02-08$30,000 246-char remark
Show marketing remark (246 chars)
SPACIOUS AND BEAUTIFUL. WELL PRESERVED MAGNIFICENT NATURAL WOOD. GENEROUS SIZE ROOMS WITH PLENTY OF VARIETY TO CHOOSE FROM. HUGE PANTRY AREA. FIRE PLACE. HUGE DINING ROOM AREA. WILLING TO WORK DILIGENTLY WITH MOTIVATED BUYER. NEWLY REMODELED!!!!!
-
2013-02-08historical 246-char remark
Show marketing remark (246 chars)
SPACIOUS AND BEAUTIFUL. WELL PRESERVED MAGNIFICENT NATURAL WOOD. GENEROUS SIZE ROOMS WITH PLENTY OF VARIETY TO CHOOSE FROM. HUGE PANTRY AREA. FIRE PLACE. HUGE DINING ROOM AREA. WILLING TO WORK DILIGENTLY WITH MOTIVATED BUYER. NEWLY REMODELED!!!!!
-
2013-02-06$57,900
-
2013-02-06historical
-
2013-02-01historical
-
2013-02-01$114,900
-
2013-01-31$31,900
-
2013-01-31historical
-
2012-12-10soldstatus $38,000
-
2005-03-01soldstatus $63,000
ⓘ Source: listings_history table (triggers on properties + properties_extension) + one-shot
backfill from property_details.listing_events for pre-trigger history.
Tax reassessment forecast WI · Partial reset (capped growth)
- Current annual tax
- $5,281 · $440/mo
- Projected year-2 tax
- $5,281 · $440/mo
- Expected delta
- $0/yr ($0/mo · 0.0%)
ⓘ Screening estimate from a state-policy table — verify with the county assessor before closing.
Climate risk First Street
- Flood 1/10 Low FEMA zone X (unshaded) · 0% chance over 30 yrs
- Wildfire 1/10 Low
- Heat 2/10 Low 7 d/yr ≥98°F today · 13 d/yr by 30 yrs out
- Wind 2/10 Low
- Air quality 2/10 Low 2 unhealthy d/yr today · 2 by 30 yrs out
Nearby sold comps map
Loading sold comps map…
Walkable amenities ~0.75 mi
Loading nearby amenities…
Taxation est. · year 1
- Rental income
- $22,387
- − Mortgage interest
- −$7,702
- − Property taxes
- −$5,281
- − Insurance
- −$688
- − Repairs & maintenance
- −$1,791
- − Management
- −$1,791
- − Depreciation
- −$4,000
- Taxable income
- $1,135
- Est. tax owed @ 24.0%
- −$272
- After-tax cash flow
- $2,793/yr
For passive investors: Depreciation is non-cash, so a rental often shows a tax loss while cash-flowing — sheltering income. Rental losses are passive: they offset passive income freely, and up to $25,000/yr can offset ordinary (W-2) income if you actively participate and your MAGI is under $100k (phasing out to $0 by $150k); unused losses carry forward. On sale, claimed depreciation is recaptured at up to 25%, and gains may owe capital-gains tax (a 1031 exchange can defer both). Figures are a year-1 estimate at your 24.0% rate — not tax advice; consult a CPA.
Schools (NCES district)
- District
- Milwaukee School District
- NCES district ID
- 5509600
- Math proficiency
- 10% ▼ -5.00%
- Reading proficiency
- 18% ▬ 0.00%
- Median HH income
- $36,339
- Composite
- 11.61/100
- National rank
- #9696
- State rank
- #337 of 342 in WI
Livability — Milwaukee
- Score
- 81/100
- State rank
- #55
- US rank
- #1534
Category grades
Schools grade is shown separately in the Schools card above.
Census & demographics
- Census place
- Milwaukee, WI
- County
- Milwaukee County · 926,379 people
- City population
- 573,768
- Metro
- Milwaukee-Waukesha, WI
- Population (ZIP)
- 23,922
- Household income
- $48,217
- Rent vs Own
- Severe rent burden
- 1730.0
Population outlook (Milwaukee County) Hauer SSP2
- Today (2025)
- 995,758 people
- By 2030
- 1,009,124 · +1.3%
- By 2040
- 1,028,128 · +3.3%
- By 2050
- 1,040,066 · +4.4%
- By 2075
- 1,057,849 · +6.2%
- By 2100
- 1,039,774 · +4.4%
Race, ethnicity, and origin ACS 2023
- Neighborhood character
- Predominantly Black (71%)
- Race & ethnicity
- Black 71% White 17% Hispanic / Latino 6% Two or more races 6% Asian 2%
- Hispanic origin (detail)
- Mexican 3% Puerto Rican 1%
- Common ancestry
- Romanian 2% Portuguese 1% Italian 1%
- Foreign-born
- 3% · Canada, Philippines
- Languages at home
- 94% English-only · Spanish 3% Other Asian/Pacific 2%
Political lean MEDSL · Milwaukee
- 2024 margin
- Solid D (+38.5) · D 68.3% · R 29.8% · Other 1.8%
- 2008→2024 swing
- +2.7pp toward D · 2008: 35.9pp · 2024: 38.5pp
- All cycles
- 2024: D+38.5 2020: D+39.9 2016: D+37.5 2012: D+34.6 2008: D+35.9
Not yet ingested
- Civics
- —
Market trends
- HPI YoY
- ▼ -76.77%
- Current HPI
- 280.0133
- Rent YoY
- ▲ 3.82%
- Metro
- Milwaukee-Waukesha, WI
- State GDP YoY
- ▲ 2.10%
- F500 in state
- 20
Industry mix (Fortune 500 HQ in WI)
| Industry | F500 HQs | Revenue |
|---|---|---|
| Industrial Machinery | 4 | $23B |
|
||
| Industrial Technology | 2 | $36B |
|
||
| Insurance | 1 | $36B |
|
||
| Professional Services | 1 | $19B |
|
||
| Utilities | 1 | $9B |
|
||
| Consumer Goods | 1 | $3B |
|
||
Price history
+118.3% since first listed15 events — show timeline
- 2026-04-22 Contingent — METROMLS
- 2026-03-25 Listed $137,500 METROMLS
- 2025-10-07 Listing Removed — METROMLS
- 2025-08-21 Listed $499,900 METROMLS
- 2022-11-02 Sold (Public Records) $388,000 Public Records
- 2013-02-08 Listing Removed — METROMLS
- 2013-02-08 Listed $30,000 METROMLS
- 2013-02-06 Listing Removed — METROMLS
- 2013-02-06 Listed $57,900 METROMLS
- 2013-02-01 Listed $114,900 METROMLS
- 2013-02-01 Listing Removed — METROMLS
- 2013-01-31 Listing Removed — METROMLS
- 2013-01-31 Listed $31,900 METROMLS
- 2012-12-10 Sold (Public Records) $38,000 Public Records
- 2005-03-01 Sold (Public Records) $63,000 Public Records
Property tax history
+5.4%/yrLatest (2024): $5,281 · +31.0% YoY. Source: county tax records.
Cash-flow waterfall
monthlySold comps — $/sqft
last 12 mo · ≤1 miLoading sold comps…