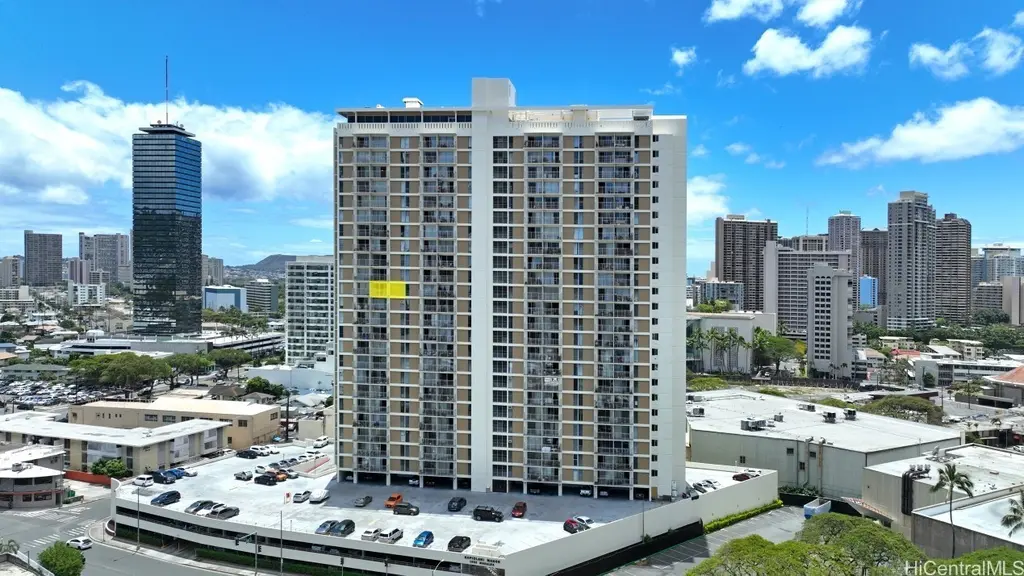
1655 Makaloa St #1616 · Urban Honolulu, HI
Flood risk 8/10 · Major
- FEMA flood zone
- X (unshaded)
- Chance of flooding over 30 yrs
- 0.99%
- Est. flood insurance / yr
- $507 – $1,088
Fire risk No data
- Est. fire insurance / yr
- —
Heat risk No data
- Hot days now (above threshold)
- —
- Hot days in 30 yrs
- —
Wind risk No data
- Chance of severe wind over 30 yrs
- —
Air-quality risk 1/10 · Minimal
- Unhealthy air days now
- —
- Unhealthy air days in 30 yrs
- —
Risk factors via First Street. Map © Google.
Why this score? — see what drove the F grade
The composite is a weighted blend of 9 inputs, each scored 0–100. Each bar is that input's sub-score; the figure is the points it added to the 100-point composite (weight × sub-score).
- Cash flow +6.3/30.0
- Appreciation +6.0/10.0
- Schools +3.7/10.0
- 1% rule +3.5/10.0
- Rent growth +3.3/5.0
- Livability +2.5/5.0
- Condition / age +2.5/5.0
- ARV discount +2.1/15.0
- DSCR +0.6/10.0
$349,000
🖨 Deal sheet (PDF) 📄 Offer letter ✓ Due diligence
Listing remarks MLS
Location, Location, Location!!! Newly painted, electrical upgrade, and renovated flooring with travertine marble tile. Natural light fills the space with nice views of town . Centrally Located in town with an easy commute for all your needs. The Kpiolani Manor locates directly across from Don Quijote, Palama Market, WalMart, Sam's Clum and many restaurant. near Super Markets , offers rooftop amenities with views of the water. The neighborhood amenities and services are only a block away for all you will need. Monthly maintenance fee includes everything from electricity, water , sewage, and cable. There is a trash shoot and community laundry room on every floor for convenience. There is so convenience many bus lines.
Key facts
- Views of the water
- Natural light
- Renovated flooring
Tags
Neighborhood map
What this means for you Summary
Snapshot
- This is a 1-bed/1.0-bath condo listed at $349k.
Deal economics
- At list price, monthly cash flow is $-687 ($-8k/yr) — negative.
- To cash-flow at today's rent, offer at most $228k (34.8% below list).
- To meet the 1% rule (rent ≥ 1% of price), the offer needs to be $298k (14.6% below list).
- Recommended offer: $228k (34.8% below list) — sets the bar for cash-flow.
- Cap rate 4.2% vs local median 1.5% in Urban Honolulu — top-decile yield for the area; either an underpriced asset or a hidden risk that comps aren't pricing in. Stress-test before assuming the spread holds.
Location & tenants
- Location reads: area grade F — affects rentability + tenant quality, not the cash-flow math above.
- Hawaii Department Of Education (suburban): math 32% / reading 50% proficiency, ranked #1 of 1 in HI (top 100%) — families likely to look elsewhere, expect single-tenant / working-renter base with shorter leases.
- Zoned schools: Queen Kaahumanu Elementary School (math 27% / reading 43%, grade F, #107 of 183 statewide, top 58%, 430 students, 63% FRL); President George Washington Middle School (math 30% / reading 46%, grade F, #17 of 42 statewide, top 39%, 569 students, 61% FRL); President William Mckinley High School (math 28% / reading 69%, grade D, #13 of 43 statewide, top 33%, 1,502 students, 50% FRL) — zoned schools average 58% FRL vs 39% district-wide (19 pts higher); higher-poverty schools than district average — tighter screening recommended.
- Market conditions: Rents rising (+3.1%/yr); 561 active listings in the ZIP; 14 comparable units currently listed for rent nearby; rentals at typical pace (median 26d on market — plan ~3-4 weeks tenant-placement turnaround); solid renter incomes; 1,638 units permitted in Honolulu County in 2024 (793 in 5+ unit buildings).
Forward outlook
- In year one you build about $9k of equity ($2k loan paydown + $7k appreciation (2.0% local appreciation)).
- Honolulu County population projected at +17% by 2050 — long-run rental-demand tailwind backs the buy-and-hold thesis.
- By year 4, paydown + projected appreciation supports a ~$32k cash-out refi (75% LTV) — recoverable capital for the next deal without selling this one.
Negotiation context
- It's been on market 194 days — a 12% lower offer ($307k) is reasonable based on typical stale-listing flexibility.
- 2 sale attempts since 15y ago with the ask held roughly flat each time — persistent listings suggest the price (not the market) is what's stuck; bring a comps-based counter.
- Current owner paid $235k; 49% above their basis — modest negotiation headroom, anchor on the comps not their cost.
Risks & watch-outs
- Watch-outs: flood insurance adds $66/mo; HOA is 30% of rent.
- Climate carrying-cost: severe flood risk — expect insurance premiums to compound above CPI over the hold.
Questions for the listing agent
- What do current leases actually rent for vs. the listed asking? Can we see a recent rent roll and the last 12 months of T-12 income?
- It's been on market 194 days. Have you received any prior offers? Is the seller open to a 35% concession, seller financing, or rate buy-down credit?
- Built in 1970 — when were the roof, HVAC, electrical panel, plumbing, and water heater last replaced?
- What's the actual annual flood-insurance premium (NFIP or private), and is the property in a SFHA with mandatory coverage?
- What does the HOA fee cover, when was the last increase, and are there any pending special assessments or reserve-fund shortfalls?
- Any open or pending special assessments — roof, HVAC, plumbing, elevator, façade? What's the per-unit balance and payoff schedule, and is the seller paying it off at close or rolling it to the buyer?
- Why hasn't it sold? Are there any deal-killer items the seller is aware of (foundation, flood, title, zoning, code violations)?
- Is there a deadline driving the sale (1031 exchange, divorce, estate, relocation)? That informs how much negotiation room exists.
- The area grade is low — what's the realistic commute time and amenity access for the typical tenant pool here? Any planned neighborhood developments (good or bad) we should know about?
- What's the average days-on-market for RENTAL listings here right now (not sales)? A rising rental-DOM trend means longer vacancies and softer asking-rent achievability than the comps imply.
- What's the recent tenant-quality profile in this submarket — average credit score on applications, eviction rate, late-payment / NSF rate, and stable-employment percentage? A property-management company in the area should have these aggregated.
- How much new apartment / multifamily construction is in the pipeline within 1–3 miles? Heavy new supply (>2% of stock underway) typically softens rents 12–24 months out; light construction supports rent growth.
Investment metrics
- 1% rule
- 0.85% ✗
- Cap rate
- 4.16%
- Cash-on-cash
- -7.62%
- DSCR
- 0.66
- GRM
- 9.8
CMA / ARV
- ARV (median comp)
- $311,655
- List price
- $349,000
- Delta
- 11.98%
- Verdict
- OVERPRICED
- Comps
- 20 within 1.0 mi
Projected returns pro-forma
1.98% appreciation · 3.1% rent growth · sell at horizon
- IRR
- -3.7%
- Equity multiple
- 0.80×
- Total profit
- $-19,537
- Equity at exit
- $137,210
- IRR
- 1.3%
- Equity multiple
- 1.17×
- Total profit
- $16,931
- Equity at exit
- $197,243
Cash invested: $97,720 (down + closing). Projections, not guarantees.
Landlord ↔ Tenant lean methodology
- Overall (STATE)
- 37 Tenant-Leaning
- State Hawaii
- 37 Tenant-Leaning · D+13
- County
- — inherits STATE
- City
- — inherits STATE
ZIP-level market 96814
- Home prices YoY
- 0.5%
- Rents YoY
- 3.1%
- Active inventory
- 561
- Price-to-rent
- 9.8×
Monthly cashflow live
- Estimated rent
- $2,980 high interval (Pro) →
- Mortgage (P&I)
- −$1,830
- Tax from tax record
- −$94 /mo · $1,132/yr
- Insurance
- −$145
- Flood insurance flood zone
- −$66 /mo · $798/yr
- HOA
- −$905
- Vacancy / Maint / Mgmt
- −$626
- Net cashflow
- $-687
Break-even live
Sensitivity live
| Price | -10% $-490 | -5% $-589 | +0% $-687 | +5% $-786 | +10% $-885 |
|---|---|---|---|---|---|
| Rent | -10% $-923 | -5% $-805 | +0% $-687 | +5% $-570 | +10% $-452 |
| Rate | -1.0pp $-512 | -0.5pp $-599 | base $-687 | +0.5pp $-778 | +1.0pp $-870 |
UW: 25.0% down · 7.5% · 30yr · 1.5% tax · 5.0% vac · 8.0% maint · 8.0% mgmt
Financing live
Cash to close
- Down payment
- $87,250
- Closing costs
- $10,470
- Reserves months
- —
- Total cash needed
- —
Loan-product check · same deal, 3 products live
Conventional
25% down · 7.5% · 30yr
- Down + closing
- —
- Monthly P&I
- —
- Monthly cashflow
- —
- DSCR
- —
- Eligible?
- —
Personal DTI + credit; lowest rate.
DSCR
20% down · 8.5% · 30yr
- Down + closing
- —
- Monthly P&I
- —
- Monthly cashflow
- —
- DSCR
- —
- Eligible?
- —
No personal income docs; deal must DSCR.
Hard money
10% down · 12.0% · 12mo
- Down + closing
- —
- Monthly P&I
- —
- Monthly cashflow
- —
- DSCR
- —
- Eligible?
- —
Short-term bridge; refi at stabilization.
Rent comps 14 comps
| Address | Beds | Baths | Sqft | Rent | $/sqft | DOM | Units | Dist |
|---|---|---|---|---|---|---|---|---|
| 440 Olohana St Unit 1327703P Honolulu, HI | 1.0 | 1.0 | 355 | $4,055 | $11.42 | 13d | 1 | 0.72mi |
| 440 Olohana St Unit 1327711P Honolulu, HI | 1.0 | 1.0 | 355 | $3,741 | $10.54 | 3d | 1 | 0.72mi |
| 902 University Ave Unit C Honolulu, HI | 2.0 | 1.0 | 415 | $2,318 | $5.58 | 25d | 1 | 0.96mi |
| 987 Queen St Honolulu, HI | 2.0 | 1.0–2.0 | 554 | $3,925 | $7.08 | 19d | 9 | 1.03mi |
| 987 Queen St Honolulu, HI | 2.0 | 1.0–2.0 | 554 | $4,000 | $7.22 | 18d | 8 | 1.03mi |
| 987 Queen St Honolulu, HI | 1.0 | 1.0 | 453 | $3,800 | $8.39 | 12d | 9 | 1.03mi |
| 1568 Pensacola St Honolulu, HI | 1.0–2.0 | 1.0 | 523 | $2,280 | $4.36 | 25d | 1 | 1.06mi |
| 1000 Auahi St Honolulu, HI | 2.0 | 1.0–2.0 | 629 | $4,425 | $7.03 | 25d | 2 | 1.09mi |
| 242 Kaʻiulani Ave Unit 4 Honolulu, HI | — | 1.0 | 253 | $1,200 | $4.74 | 25d | 1 | 1.34mi |
| 242 Kaiulani Ave Honolulu, HI | — | 1.0 | 253 | $1,250 | $4.94 | 25d | 1 | 1.34mi |
| 232 Kaiulani Ave Honolulu, HI | 3.0 | 1.0 | 656 | $3,088 | $4.71 | 25d | 8 | 1.34mi |
| 2442 Tusitala St Apt 103 Honolulu, HI | — | 1.0 | 300 | $1,900 | $6.33 | 45d | 1 | 1.43mi |
| 249 Kapili St Unit 1 Honolulu, HI | — | 1.0 | 290 | $1,350 | $4.66 | 23d | 1 | 1.46mi |
| 249 Kapili St #101 Honolulu, HI | — | 1.0 | 225 | $1,500 | $6.67 | 25d | 1 | 1.46mi |
HOA detail condo
- Monthly dues
- $905 · $10,860/yr
- Likely covers
- watertrashelectriccable
- Assessments
- None detected in remarks — confirm with the listing agent.
Listing history 20 events
-
2026-06-21days on market $349,000 Active 194 DOM
-
2026-06-18days on market $349,000 Active 191 DOM
-
2026-06-17days on market $349,000 Active 190 DOM
-
2026-06-15days on market $349,000 Active 188 DOM
-
2026-06-13days on market $349,000 Active 186 DOM
-
2026-06-13days on market $349,000 Active 185 DOM
-
2026-06-10days on market $349,000 Active 183 DOM
-
2026-06-09days on market $349,000 Active 182 DOM
-
2026-06-08days on market $349,000 Active 181 DOM
-
2026-06-07days on market $349,000 Active 180 DOM
-
2026-06-05days on market $349,000 Active 177 DOM
-
2026-06-03days on market $349,000 Active 176 DOM
-
2026-06-02days on market $349,000 Active 175 DOM
-
2026-06-01days on market $349,000 Active 174 DOM
-
2026-05-31days on market $349,000 Active 173 DOM
-
2025-12-08$349,000 Active 730-char remark
Show marketing remark (730 chars)
Location, Location, Location!!! Newly painted, electrical upgrade, and renovated flooring with travertine marble tile. Natural light fills the space with nice views of town . Centrally Located in town with an easy commute for all your needs. The Kpiolani Manor locates directly across from Don Quijote, Palama Market, WalMart, Sam's Clum and many restaurant. near Super Markets , offers rooftop amenities with views of the water. The neighborhood amenities and services are only a block away for all you will need. Monthly maintenance fee includes everything from electricity, water , sewage, and cable. There is a trash shoot and community laundry room on every floor for convenience. There is so convenience many bus lines.
-
2012-01-27soldstatus $235,000 363-char remark
Show marketing remark (363 chars)
Cool mauka views from this higher floor apartment. It has new paint and new wall-wall carpet and vinyl flooring, and the original wood cabinets are looking good! And, it is difficult to beat this location - close to shopping at Ala Moana or Don Quixote, the Convention Center, public transportation, and Ala Moana Beach park. Easy to see - call the office and go!
-
2012-01-27soldstatus $235,000
Show marketing remark (363 chars)
Cool mauka views from this higher floor apartment. It has new paint and new wall-wall carpet and vinyl flooring, and the original wood cabinets are looking good! And, it is difficult to beat this location - close to shopping at Ala Moana or Don Quixote, the Convention Center, public transportation, and Ala Moana Beach park. Easy to see - call the office and go!
-
2011-11-01$245,000 363-char remark
Show marketing remark (363 chars)
Cool mauka views from this higher floor apartment. It has new paint and new wall-wall carpet and vinyl flooring, and the original wood cabinets are looking good! And, it is difficult to beat this location - close to shopping at Ala Moana or Don Quixote, the Convention Center, public transportation, and Ala Moana Beach park. Easy to see - call the office and go!
-
1970-08-01soldstatus $23,100
ⓘ Source: listings_history table (triggers on properties + properties_extension) + one-shot
backfill from property_details.listing_events for pre-trigger history.
Tax reassessment forecast HI · Partial reset (capped growth)
- Current annual tax
- $1,132 · $94/mo
- Projected year-2 tax
- $1,132 · $94/mo
- Expected delta
- $0/yr ($0/mo · 0.0%)
ⓘ Screening estimate from a state-policy table — verify with the county assessor before closing.
Climate risk First Street
- Flood 8/10 Severe FEMA zone X (unshaded) · 99% chance over 30 yrs
- Air quality 1/10 Low
Nearby sold comps map
Loading sold comps map…
Walkable amenities ~0.75 mi
Loading nearby amenities…
Taxation est. · year 1
- Rental income
- $35,757
- − Mortgage interest
- −$19,549
- − Property taxes
- −$1,132
- − Insurance
- −$2,542
- − Repairs & maintenance
- −$2,861
- − Management
- −$2,861
- − HOA
- −$10,860
- − Depreciation
- −$10,153
- Taxable loss
- −$14,200
- Est. tax savings @ 24.0%
- +$3,408
- After-tax cash flow
- $-4,840/yr
For passive investors: Depreciation is non-cash, so a rental often shows a tax loss while cash-flowing — sheltering income. Rental losses are passive: they offset passive income freely, and up to $25,000/yr can offset ordinary (W-2) income if you actively participate and your MAGI is under $100k (phasing out to $0 by $150k); unused losses carry forward. On sale, claimed depreciation is recaptured at up to 25%, and gains may owe capital-gains tax (a 1031 exchange can defer both). Figures are a year-1 estimate at your 24.0% rate — not tax advice; consult a CPA.
Schools (NCES district)
- District
- Hawaii Department Of Education
- NCES district ID
- 1500030
- Math proficiency
- 32% ▼ -10.00%
- Reading proficiency
- 50% ▼ -3.00%
- Median HH income
- $69,005
- Composite
- 37.07/100
- National rank
- #4504
- State rank
- #1 of 1 in HI
Livability — Urban Honolulu
No livability data for this city. (Only ~50 U.S. cities are tracked.)
Census & demographics
- Census place
- Urban Honolulu, HI
- County
- Honolulu County · 963,448 people
- City population
- 309,956
- Metro
- Urban Honolulu, HI
- Population (ZIP)
- 24,689
- Household income
- $77,768
- Rent vs Own
- Severe rent burden
- 1641.0
Population outlook (Honolulu County) Hauer SSP2
- Today (2025)
- 1,072,641 people
- By 2030
- 1,110,460 · +3.5%
- By 2040
- 1,181,593 · +10.2%
- By 2050
- 1,257,584 · +17.2%
- By 2075
- 1,501,120 · +39.9%
- By 2100
- 1,764,430 · +64.5%
Race, ethnicity, and origin ACS 2023
- Neighborhood character
- Diverse neighborhood (Simpson 0.58)
- Race & ethnicity
- Asian 64% Two or more races 14% White 13% Pacific Islander 6% Hispanic / Latino 5% Black 1%
- Hispanic origin (detail)
- Mexican 2% Puerto Rican 2%
- Common ancestry
- Russian 1% Lithuanian 1% Italian 1%
- Foreign-born
- 35% · China, South Korea, Vietnam
- Languages at home
- 58% English-only · Other Asian/Pacific 15% Chinese 10% Korean 9%
Political lean MEDSL · Honolulu
- 2024 margin
- Strong D (+21.6) · D 59.9% · R 38.3% · Other 1.8%
- 2008→2024 swing
- -19.4pp toward R · 2008: 41.1pp · 2024: 21.6pp
- All cycles
- 2024: D+21.6 2020: D+26.9 2016: D+29.9 2012: D+39.1 2008: D+41.1
Not yet ingested
- Civics
- —
Market trends
- HPI YoY
- ▲ 1.98%
- Current HPI
- 376.4197
- Rent YoY
- ▲ 3.10%
- Metro
- Urban Honolulu, HI
- State GDP YoY
- —
- F500 in state
- 0
Price history
+1410.8% since first listed5 events — show timeline
- 2025-12-08 Listed $349,000 HiCentral MLS
- 2012-01-27 Sold (Public Records) $235,000 Public Records
- 2012-01-27 Sold (MLS) $235,000 HiCentral MLS
- 2011-11-01 Listed $245,000 HiCentral MLS
- 1970-08-01 Sold (Public Records) $23,100 Public Records
Property tax history
+2.7%/yrLatest (2022): $1,132 · +5.0% YoY. Source: county tax records.
Cash-flow waterfall
monthlySold comps — $/sqft
last 12 mo · ≤1 miLoading sold comps…