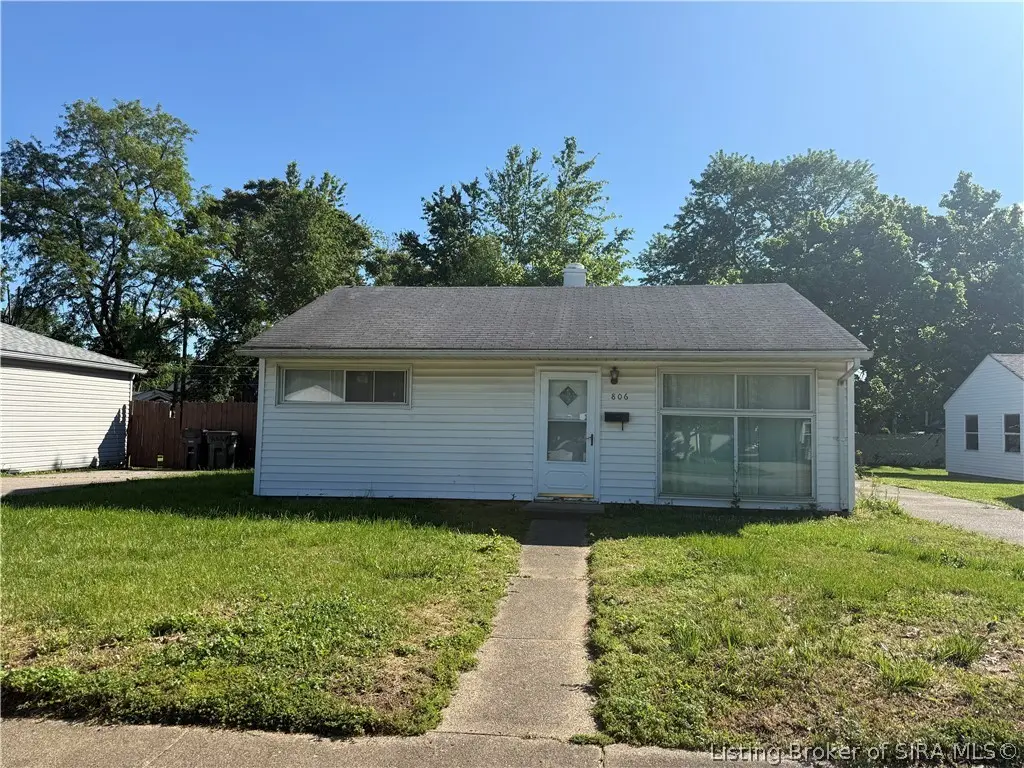
806 Sharon Dr · Jeffersonville, IN
Flood risk 1/10 · Minimal
- FEMA flood zone
- X (unshaded)
- Chance of flooding over 30 yrs
- 0.0%
- Est. flood insurance / yr
- $507 – $1,088
Fire risk 1/10 · Minimal
- Est. fire insurance / yr
- $717 – $1,331
Heat risk 5/10 · Moderate
- Hot days now (above 104°F)
- 7 days/yr
- Hot days in 30 yrs
- 20 days/yr
Wind risk 2/10 · Minimal
- Chance of severe wind over 30 yrs
- 1.0%
Air-quality risk 3/10 · Minor
- Unhealthy air days now
- 2 days/yr
- Unhealthy air days in 30 yrs
- 4 days/yr
Risk factors via First Street. Map © Google.
Why this score? — see what drove the C- grade
The composite is a weighted blend of 9 inputs, each scored 0–100. Each bar is that input's sub-score; the figure is the points it added to the 100-point composite (weight × sub-score).
- Cash flow +16.6/30.0
- ARV discount +14.4/15.0
- DSCR +5.1/10.0
- Livability +4.2/5.0
- 1% rule +3.7/10.0
- Schools +2.7/10.0
- Rent growth +2.6/5.0
- Condition / age +2.5/5.0
- Appreciation +0.0/10.0
$165,000
🖨 Deal sheet 📄 Offer letter ✓ Due diligence
Listing remarks
Welcome home to this charming 4-bedroom, 1-bath home located at 806 Sharon Drive in Jeffersonville. Proudly owned by the same family for over 60 years, this well-loved property offers timeless character, solid construction, and endless potential for its next chapter. Home is being sold as-is.
Key facts
- 6,098 sq ft lot
- Built 1950
- Listed 49 days
Property features AI
Finance
- Financial info: Annual tax amount reported
Exterior
- Utilities: Public water; Public sewer
- Home design: Single-story home; Shingle roof
- Construction: Slab foundation; Above-grade finished area reported
- Exterior features: Residential lot (approx. 0.14 acre); Resale condition
Interior
- Kitchen: Kitchen on main level (approx. 8.4 x 11.10); Oven, Range, Refrigerator
- Bedrooms: Four first-floor bedrooms (approx. 10.9 x 8.11; 13.7 x 11.5; 9.2 x 11.10; 12.4 x 11.11)
- Flooring: Linoleum flooring in bedrooms and kitchen
- Bathrooms: One full bathroom
- Heating & cooling: Forced air heating; Central air conditioning
- Interior features: Six total rooms
- Laundry & utility: Main-level laundry closet with Washer and Dryer
Neighborhood map
What this means for you Summary
Snapshot
- This is a 3-bed/1.0-bath single-family listed at $165k.
Deal economics
- At list price, monthly cash flow is $99 ($1k/yr) — positive.
- The deal already cash-flows at list — no discount required.
- To meet the 1% rule (rent ≥ 1% of price), the offer needs to be $144k (13.0% below list).
- Recommended offer: $144k (13.0% below list) — sets the bar for 1% rule.
- Cap rate 7.0% vs local median 3.5% in Jeffersonville — top-decile yield for the area; either an underpriced asset or a hidden risk that comps aren't pricing in. Stress-test before assuming the spread holds.
Location & tenants
- Location reads 83/100 on livability (#8 in IN, #843 nationally) — a professional / high-income tenant draw. Strengths: commute A+, cost of living A+, housing A+; Watch: schools C-.
- Greater Clark County Schools (suburban): math 26% / reading 37% proficiency, ranked #224 of 301 in IN (top 74%) — families likely to look elsewhere, expect single-tenant / working-renter base with shorter leases.
- Market conditions: Rents flat; 425 active listings in the ZIP; 16 comparable units currently listed for rent nearby; rentals at typical pace (median 24d on market — plan ~3-4 weeks tenant-placement turnaround); 44% of comp listings sitting > 30 days — soft ceiling on asking rent; 911 units permitted in Clark County in 2024 (133 in 5+ unit buildings).
Forward outlook
- Local home prices are declining (-3.0%/yr); year-one equity from $1k of loan paydown is wiped out by about $5k of value loss. Plan a longer hold.
- Clark County population projected at +17% by 2050 — long-run rental-demand tailwind backs the buy-and-hold thesis.
Negotiation context
- It's been on market 49 days — a 3% lower offer ($160k) is reasonable based on typical stale-listing flexibility.
Risks & watch-outs
- Watch-outs: built in 1950 — expect roof / HVAC / electrical / plumbing capex.
- Climate carrying-cost: extreme-heat days projected 7→20/yr by 2055 (HVAC capex compounding) — expect insurance premiums to compound above CPI over the hold.
Questions for the listing agent
- It's been on market 49 days. Have you received any prior offers? Is the seller open to a 13% concession, seller financing, or rate buy-down credit?
- Built in 1950 — when were the roof, HVAC, electrical panel, plumbing, and water heater last replaced?
- Is there a deadline driving the sale (1031 exchange, divorce, estate, relocation)? That informs how much negotiation room exists.
- What's the average days-on-market for RENTAL listings here right now (not sales)? A rising rental-DOM trend means longer vacancies and softer asking-rent achievability than the comps imply.
- What's the recent tenant-quality profile in this submarket — average credit score on applications, eviction rate, late-payment / NSF rate, and stable-employment percentage? A property-management company in the area should have these aggregated.
- How much new for-sale + rental construction is in the pipeline within 1–3 miles? Heavy new supply typically softens prices + rents 12–24 months out; constrained supply supports both.
Investment metrics
- 1% rule
- 0.87% ✗
- Cap rate
- 7.01%
- Cash-on-cash
- 2.57%
- DSCR
- 1.11
- GRM
- 9.6
CMA / ARV
- ARV (median comp)
- $194,938
- List price
- $165,000
- Delta
- -15.36%
- Verdict
- UNDERPRICED
- Comps
- 20 within 1.0 mi
Show comp detail 12 sales within ~0.75 mi
| Address | Dist | Beds/Ba | Sqft | Sold | Price | $/sf | Match |
|---|---|---|---|---|---|---|---|
| 9 Louise St | 0.04mi | 2/2.0 (-1) | 1,206 (+4%) | 0mo | $210,000 | $174 | 83 |
| 1006 Morris Ave | 0.27mi | 3/1.0 | 1,134 (-3%) | 3mo | $199,000 | $175 | 81 |
| 1706 Herby Dr | 0.22mi | 3/1.0 | 1,091 (-6%) | 0mo | $190,000 | $174 | 79 |
| 1009 Morris Ave | 0.28mi | 3/1.0 | 1,091 (-6%) | 2mo | $185,000 | $170 | 75 |
| 1414 E 9th St | 0.44mi | 3/1.5 | 1,144 (-2%) | 1mo | $110,000 | $96 | 74 |
| 1400 Frederick Ave | 0.54mi | 3/2.0 | 1,158 (-0%) | 2mo | $224,900 | $194 | 68 |
| 789 Rose Ave | 0.45mi | 2/2.0 (-1) | 1,212 (+4%) | 2mo | $223,000 | $184 | 61 |
| 828 Marigold Dr | 0.56mi | 3/2.0 | 1,115 (-4%) | 3mo | $211,000 | $189 | 60 |
| 1424 E 8th St | 0.46mi | 3/1.0 | 1,292 (+11%) | 2mo | $77,000 | $60 | 59 |
| 808 Cherry Dr | 0.63mi | 3/1.0 | 1,042 (-10%) | 2mo | $205,000 | $197 | 52 |
| 1943 Cheryl Dr | 0.67mi | 3/1.0 | 1,000 (-14%) | 1mo | $202,000 | $202 | 45 |
| 1808 Wesley Ct | 0.58mi | 2/2.0 (-1) | 1,300 (+12%) | 2mo | $220,000 | $169 | 43 |
Match score weights: distance 35% · size 25% · config 20% · recency 20%. Top-matched comps best support the ARV.
Projected returns pro-forma
-3.0% appreciation · 0.58% rent growth · sell at horizon
- IRR
- -14.8%
- Equity multiple
- 0.48×
- Total profit
- $-23,898
- Equity at exit
- $24,602
- IRR
- -10.4%
- Equity multiple
- 0.43×
- Total profit
- $-26,220
- Equity at exit
- $14,266
Cash invested: $46,200 (down + closing). Projections, not guarantees.
Landlord ↔ Tenant lean methodology
- Overall (STATE)
- 90 Strongly Landlord-Friendly
- State Indiana
- 90 Strongly Landlord-Friendly · R+11
- County
- — inherits STATE
- City
- — inherits STATE
ZIP-level market 47130
- Rents YoY
- 0.6%
- Active inventory
- 425
- Price-to-rent
- 9.6×
Monthly cashflow live
- Estimated rent
- $1,435 high interval (Pro) →
- Mortgage (P&I)
- −$865
- Tax from tax record
- −$101 /mo · $1,212/yr
- Insurance
- −$69
- HOA
- −$0
- Vacancy / Maint / Mgmt
- −$301
- Net cashflow
- $99
Break-even live
UW: 25.0% down · 7.5% · 30yr · 1.5% tax · 5.0% vac · 8.0% maint · 8.0% mgmt
Financing live
Cash to close
- Down payment
- $41,250
- Closing costs
- $4,950
- Reserves months
- —
- Total cash needed
- —
Loan-product check · same deal, 3 products live
Conventional
25% down · 7.5% · 30yr
- Down + closing
- —
- Monthly P&I
- —
- Monthly cashflow
- —
- DSCR
- —
- Eligible?
- —
Personal DTI + credit; lowest rate.
DSCR
20% down · 8.5% · 30yr
- Down + closing
- —
- Monthly P&I
- —
- Monthly cashflow
- —
- DSCR
- —
- Eligible?
- —
No personal income docs; deal must DSCR.
Hard money
10% down · 12.0% · 12mo
- Down + closing
- —
- Monthly P&I
- —
- Monthly cashflow
- —
- DSCR
- —
- Eligible?
- —
Short-term bridge; refi at stabilization.
Rent comps 16 comps
| Address | Beds | Baths | Sqft | Rent | $/sqft | DOM | Units | Dist |
|---|---|---|---|---|---|---|---|---|
| 725 Goyne Dr Jeffersonville, IN | 3.0 | 1.0 | 925 | $1,600 | $1.73 | 11d | 1 | 0.25mi |
| 1514 Elliott Ave Jeffersonville, IN | 2.0 | 1.0 | 800 | $1,500 | $1.88 | 23d | 1 | 0.29mi |
| 1008 Sharon Dr Jeffersonville, IN | 3.0 | 1.0 | 1000 | $1,200 | $1.20 | 43d | 1 | 0.31mi |
| 1512 E 10th St Jeffersonville, IN | 1.0–2.0 | 1.0 | 720 | $949 | $1.32 | 3d | 1 | 0.33mi |
| 1919 Viking Dr Jeffersonville, IN | 2.0 | 1.5 | 932 | $1,065 | $1.14 | 3d | 2 | 0.61mi |
| 1448 Plank Rd Jeffersonville, IN | 2.0 | 1.0 | 832 | $1,250 | $1.50 | 43d | 1 | 0.61mi |
| 1115 E 8th St Jeffersonville, IN | 2.0 | 1.0 | 984 | $1,360 | $1.38 | 43d | 1 | 0.73mi |
| 1229 Cedarview Dr Jeffersonville, IN | 3.0 | 1.0 | 1100 | $1,595 | $1.45 | 14d | 1 | 0.99mi |
| 805 Penn St Jeffersonville, IN | 2.0 | 1.0 | 896 | $1,200 | $1.34 | 23d | 1 | 0.99mi |
| 2067 Aster Dr Jeffersonville, IN | 3.0 | 2.0 | 1200 | $1,900 | $1.58 | 43d | 1 | 1.07mi |
| 729 E Court Ave Jeffersonville, IN | 2.0 | 1.5 | 1088 | $1,350 | $1.24 | 43d | 1 | 1.07mi |
| 917 Mechanic St Jeffersonville, IN | 2.0–3.0 | 1.0–2.0 | 1012 | $950 | $0.94 | 43d | 2 | 1.13mi |
| 531 E Chestnut St Jeffersonville, IN | 2.0 | 2.0 | 1250 | $1,700 | $1.36 | 43d | 1 | 1.31mi |
| 2125 E 10th St Jeffersonville, IN | 1.0–2.0 | 1.0 | 725 | $1,470 | $2.03 | 17d | 4 | 1.41mi |
| 2727 Middle Rd Jeffersonville, IN | 1.0–2.0 | 1.0–1.5 | 850 | $977 | $1.15 | 1d | 13 | 1.41mi |
| 1029 Thomas V Bryant Dr Jeffersonville, IN | 3.0 | 2.0 | 1216 | $1,800 | $1.48 | 23d | 1 | 1.47mi |
Listing history 16 events
-
2026-06-18days on market $165,000 Active 49 DOM
-
2026-06-17days on market $165,000 Active 48 DOM
-
2026-06-16days on market $165,000 Active 47 DOM
-
2026-06-15days on market $165,000 Active 46 DOM
-
2026-06-13days on market $165,000 Active 44 DOM
-
2026-06-13days on market $165,000 Active 43 DOM
-
2026-06-10days on market $165,000 Active 41 DOM
-
2026-06-09days on market $165,000 Active 40 DOM
-
2026-06-08days on market $165,000 Active 39 DOM
-
2026-06-07days on market $165,000 Active 38 DOM
-
2026-06-03days on market $165,000 Active 34 DOM
-
2026-06-02days on market $165,000 Active 33 DOM
-
2026-06-02price $165,000 Active 32 DOM
-
2026-06-01days on market $173,500 Active 32 DOM
-
2026-05-31days on market $173,500 Active 31 DOM
-
2026-04-30$173,500 Active 293-char remark
ⓘ Source: listings_history table (triggers on properties + properties_extension) + one-shot
backfill from property_details.listing_events for pre-trigger history.
Tax reassessment forecast IN · Partial reset (capped growth)
- Current annual tax
- $1,212 · $101/mo
- Projected year-2 tax
- $1,307 · $109/mo
- Expected delta
- +$95/yr (+$8/mo · 7.9%)
ⓘ Screening estimate from a state-policy table — verify with the county assessor before closing.
Climate risk First Street
- Flood 1/10 Low FEMA zone X (unshaded) · 0% chance over 30 yrs
- Wildfire 1/10 Low
- Heat 5/10 Major 7 d/yr ≥104°F today · 20 d/yr by 30 yrs out
- Wind 2/10 Low 100% chance of damaging wind over 30 yrs
- Air quality 3/10 Moderate 2 unhealthy d/yr today · 4 by 30 yrs out
Nearby sold comps map
Loading sold comps map…
Walkable amenities ~0.75 mi
Loading nearby amenities…
Taxation est. · year 1
- Rental income
- $17,223
- − Mortgage interest
- −$9,243
- − Property taxes
- −$1,212
- − Insurance
- −$825
- − Repairs & maintenance
- −$1,378
- − Management
- −$1,378
- − Depreciation
- −$4,800
- Taxable loss
- −$1,612
- Est. tax savings @ 24.0%
- +$387
- After-tax cash flow
- $1,573/yr
For passive investors: Depreciation is non-cash, so a rental often shows a tax loss while cash-flowing — sheltering income. Rental losses are passive: they offset passive income freely, and up to $25,000/yr can offset ordinary (W-2) income if you actively participate and your MAGI is under $100k (phasing out to $0 by $150k); unused losses carry forward. On sale, claimed depreciation is recaptured at up to 25%, and gains may owe capital-gains tax (a 1031 exchange can defer both). Figures are a year-1 estimate at your 24.0% rate — not tax advice; consult a CPA.
Schools (NCES district)
- District
- Greater Clark County Schools
- NCES district ID
- 1803940
- Math proficiency
- 26% ▼ -15.00%
- Reading proficiency
- 37% ▼ -13.00%
- Median HH income
- $47,838
- Composite
- 27.2/100
- National rank
- #7020
- State rank
- #224 of 301 in IN
Livability — Jeffersonville
- Score
- 83/100
- State rank
- #8
- US rank
- #843
Category grades
Schools grade is shown separately in the Schools card above.
Census & demographics
- Census place
- Jeffersonville, IN
- County
- Clark County · 108,879 people
- City population
- 50,514
- Metro
- Louisville/Jefferson County, KY-IN
- Population (ZIP)
- 50,514
- Household income
- $70,290
- Rent vs Own
- Severe rent burden
- 1088.0
Population outlook (Clark County) Hauer SSP2
- Today (2025)
- 126,401 people
- By 2030
- 131,455 · +4.0%
- By 2040
- 140,471 · +11.1%
- By 2050
- 147,677 · +16.8%
- By 2075
- 161,702 · +27.9%
- By 2100
- 164,078 · +29.8%
Race, ethnicity, and origin ACS 2023
- Neighborhood character
- Predominantly White (73%)
- Race & ethnicity
- White 73% Black 12% Two or more races 8% Hispanic / Latino 6% Asian 2%
- Hispanic origin (detail)
- Mexican 3% Puerto Rican 1%
- Common ancestry
- Slovak 3% Lithuanian 2% Romanian 2%
- Foreign-born
- 4% · Canada
- Languages at home
- 95% English-only · Spanish 3% Other Indo-European 1%
Political lean MEDSL · Clark
- 2024 margin
- Strong R (+20.4) · D 38.9% · R 59.3% · Other 1.8%
- 2008→2024 swing
- -13.3pp toward R · 2008: -7.1pp · 2024: -20.4pp
- All cycles
- 2024: R+20.4 2020: R+18.3 2016: R+22.0 2012: R+9.9 2008: R+7.1
Not yet ingested
- Civics
- —
Market trends
- HPI YoY
- ▼ -149.13%
- Current HPI
- 218.1985
- Rent YoY
- ▲ 0.58%
- Metro
- Louisville/Jefferson County, KY-IN
- State GDP YoY
- ▲ 2.90%
- F500 in state
- 18
Industry mix (Fortune 500 HQ in IN)
| Industry | F500 HQs | Revenue |
|---|---|---|
| Industrial Machinery | 2 | $37B |
|
||
| Healthcare | 1 | $177B |
|
||
| Pharmaceuticals | 1 | $45B |
|
||
| Metals / Steel | 1 | $18B |
|
||
| Agriculture | 1 | $17B |
|
||
| Packaging | 1 | $12B |
|
||
Price history
-4.9% since first listed2 events — show timeline
- 2026-06-01 Price Changed $165,000 SIRA
- 2026-04-30 Listed $173,500 SIRA
Property tax history
+34.6%/yrLatest (2024): $1,212 · +34.3% YoY. Source: county tax records.
Cash-flow waterfall
monthlySold comps — $/sqft
last 12 mo · ≤1 miLoading sold comps…