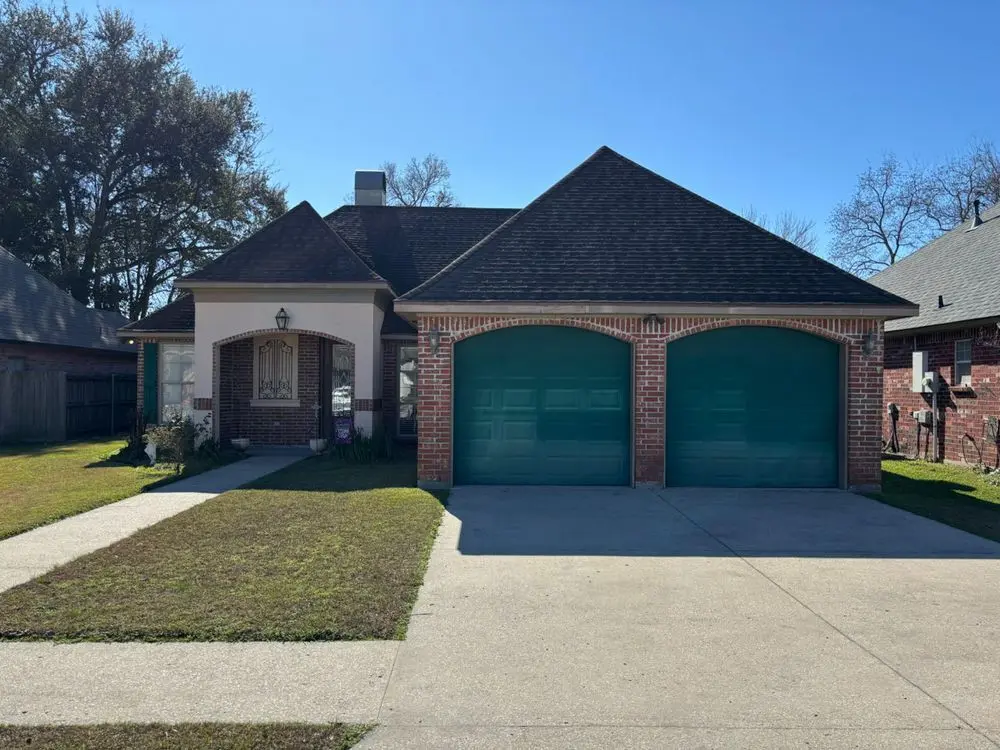
102 Shumard Dr · Lafayette, LA
Flood risk 1/10 · Minimal
- FEMA flood zone
- X (unshaded)
- Chance of flooding over 30 yrs
- 0.0%
- Est. flood insurance / yr
- $507 – $1,088
Fire risk 1/10 · Minimal
- Est. fire insurance / yr
- $1,269 – $2,357
Heat risk 9/10 · Severe
- Hot days now (above 108°F)
- 7 days/yr
- Hot days in 30 yrs
- 21 days/yr
Wind risk 9/10 · Severe
- Chance of severe wind over 30 yrs
- 99.0%
Air-quality risk 1/10 · Minimal
- Unhealthy air days now
- 0 days/yr
- Unhealthy air days in 30 yrs
- 0 days/yr
Risk factors via First Street. Map © Google.
Why this score? — see what drove the C- grade
The composite is a weighted blend of 9 inputs, each scored 0–100. Each bar is that input's sub-score; the figure is the points it added to the 100-point composite (weight × sub-score).
- Cash flow +17.3/30.0
- ARV discount +15.0/15.0
- DSCR +5.4/10.0
- 1% rule +4.0/10.0
- Schools +3.6/10.0
- Livability +3.5/5.0
- Rent growth +2.8/5.0
- Condition / age +2.5/5.0
- Appreciation +0.0/10.0
$289,900
🖨 Deal sheet (PDF) 📄 Offer letter ✓ Due diligence
Listing remarks MLS
Located off Kaliste Saloom by St. Thomas Moore HS. This four bedroom, two bath home features wood floors in living room with wood burning fireplace, kitchen with granite tile countertops and large master bedroom and master bath with seperate jacuzzi tub and shower. Home is in need of some TLC, repainting and priced accordingly. Agent/Owner, pre qualified buyers, appointment required, 337/316/3594.
Key facts
- Separate jacuzzi tub
- Master bath
- Wood floors
Tags
Neighborhood map
What this means for you Summary
Snapshot
- This is a 4-bed/2.0-bath single-family listed at $290k.
Deal economics
- At list price, monthly cash flow is $214 ($3k/yr) — positive.
- The deal already cash-flows at list — no discount required.
- To meet the 1% rule (rent ≥ 1% of price), the offer needs to be $262k (9.7% below list).
- Recommended offer: $255k (12.0% below list) — sets the bar for market timing.
- Cap rate 7.2% vs local median 4.7% in Lafayette — top-decile yield for the area; either an underpriced asset or a hidden risk that comps aren't pricing in. Stress-test before assuming the spread holds.
Location & tenants
- Location reads 70/100 on livability (#63 in LA) — a middle-class / working-renter tenant base. Strengths: cost of living A+, housing A+, health & safety A+; Watch: amenities C-, employment C-, crime F.
- Lafayette Parish (urban): math 38% / reading 46% proficiency, ranked #19 of 98 in LA (top 19%) — families likely to look elsewhere, expect single-tenant / working-renter base with shorter leases.
- Market conditions: Rents rising (+1.2%/yr); 464 active listings in the ZIP; 12 comparable units currently listed for rent nearby; rentals lingering (median 45d on market — plan ~5-8 weeks vacancy on turnover, expect pricing pressure); 58% of comp listings sitting > 30 days — soft ceiling on asking rent; solid renter incomes; 1,585 units permitted in Lafayette Parish in 2024 (10 in 5+ unit buildings).
- This rent runs 37% of the median local income ($86k/yr) — at the standard rent-burdened threshold; future hikes will face affordability resistance.
Forward outlook
- Local home prices are declining (-3.0%/yr); year-one equity from $2k of loan paydown is wiped out by about $9k of value loss. Plan a longer hold.
- Lafayette County population projected at +34% by 2050 — long-run rental-demand tailwind backs the buy-and-hold thesis.
Negotiation context
- It's been on market 132 days — a 12% lower offer ($255k) is reasonable based on typical stale-listing flexibility.
- 4 sale attempts since 20y ago with the ask held roughly flat each time — persistent listings suggest the price (not the market) is what's stuck; bring a comps-based counter.
- Current owner paid $211k; 38% above their basis — modest negotiation headroom, anchor on the comps not their cost.
Risks & watch-outs
- Climate carrying-cost: severe wind risk, 99% chance of damaging wind over 30y; extreme-heat days projected 7→21/yr by 2055 (HVAC capex compounding) — expect insurance premiums to compound above CPI over the hold.
Questions for the listing agent
- It's been on market 132 days. Have you received any prior offers? Is the seller open to a 12% concession, seller financing, or rate buy-down credit?
- Why hasn't it sold? Are there any deal-killer items the seller is aware of (foundation, flood, title, zoning, code violations)?
- Is there a deadline driving the sale (1031 exchange, divorce, estate, relocation)? That informs how much negotiation room exists.
- Schools are B-rated — typically a magnet for longer-tenancy family renters. What's the average tenant stay here, and is there a school-zone premium baked into asking?
- Crime grade is F in this area — have there been break-ins, vandalism, or insurance claims at this property in the last 3 years? What carrier currently insures it and at what premium?
- What's the average days-on-market for RENTAL listings here right now (not sales)? A rising rental-DOM trend means longer vacancies and softer asking-rent achievability than the comps imply.
- What's the recent tenant-quality profile in this submarket — average credit score on applications, eviction rate, late-payment / NSF rate, and stable-employment percentage? A property-management company in the area should have these aggregated.
- How much new for-sale + rental construction is in the pipeline within 1–3 miles? Heavy new supply typically softens prices + rents 12–24 months out; constrained supply supports both.
Investment metrics
- 1% rule
- 0.90% ✗
- Cap rate
- 7.18%
- Cash-on-cash
- 3.17%
- DSCR
- 1.14
- GRM
- 9.2
CMA / ARV
- ARV (median comp)
- $369,660
- List price
- $289,900
- Delta
- -21.58%
- Verdict
- UNDERPRICED
- Comps
- 20 within 1.0 mi
Show comp detail 8 sales within ~0.75 mi
| Address | Dist | Beds/Ba | Sqft | Sold | Price | $/sf | Match |
|---|---|---|---|---|---|---|---|
| 113 Edinburgh Dr | 0.28mi | 3/2.0 (-1) | 1,856 (-10%) | 4mo | $315,000 | $170 | 62 |
| 200 Cherokee Ln | 0.46mi | 3/2.0 (-1) | 2,096 (+2%) | 12mo | $248,000 | $118 | 60 |
| 108 Kensington Dr | 0.40mi | 3/2.0 (-1) | 2,150 (+5%) | 18mo | $279,000 | $130 | 54 |
| 100 New London Dr | 0.22mi | 3/2.0 (-1) | 2,327 (+13%) | 13mo | $439,000 | $189 | 51 |
| 127 Milan Cir | 0.57mi | 4/2.5 | 2,168 (+6%) | 14mo | $360,000 | $166 | 51 |
| 401 Cherokee Ln | 0.57mi | 3/2.0 (-1) | 2,174 (+6%) | 14mo | $130,000 | $60 | 47 |
| 114 Rose Of Sharon Ln | 0.69mi | 3/2.0 (-1) | 1,953 (-5%) | 11mo | $260,000 | $133 | 46 |
| 149 Milan Cir | 0.62mi | 3/2.0 (-1) | 1,902 (-7%) | 13mo | $293,000 | $154 | 43 |
Match score weights: distance 35% · size 25% · config 20% · recency 20%. Top-matched comps best support the ARV.
Projected returns pro-forma
-3.0% appreciation · 1.23% rent growth · sell at horizon
- IRR
- -13.2%
- Equity multiple
- 0.53×
- Total profit
- $-37,959
- Equity at exit
- $43,225
- IRR
- -7.1%
- Equity multiple
- 0.58×
- Total profit
- $-33,832
- Equity at exit
- $25,065
Cash invested: $81,172 (down + closing). Projections, not guarantees.
Landlord ↔ Tenant lean methodology
- Overall (STATE)
- 90 Strongly Landlord-Friendly
- State Louisiana
- 90 Strongly Landlord-Friendly · R+12
- County
- — inherits STATE
- City
- — inherits STATE
ZIP-level market 70508
- Home prices YoY
- -34.7%
- Rents YoY
- 1.2%
- Active inventory
- 464
- Price-to-rent
- 9.2×
Monthly cashflow live
- Estimated rent
- $2,618 high interval (Pro) →
- Mortgage (P&I)
- −$1,520
- Tax from tax record
- −$213 /mo · $2,553/yr
- Insurance
- −$121
- HOA
- −$0
- Vacancy / Maint / Mgmt
- −$550
- Net cashflow
- $214
Break-even live
Sensitivity live
| Price | -10% $378 | -5% $296 | +0% $214 | +5% $132 | +10% $50 |
|---|---|---|---|---|---|
| Rent | -10% $8 | -5% $111 | +0% $214 | +5% $318 | +10% $421 |
| Rate | -1.0pp $360 | -0.5pp $288 | base $214 | +0.5pp $139 | +1.0pp $63 |
UW: 25.0% down · 7.5% · 30yr · 1.5% tax · 5.0% vac · 8.0% maint · 8.0% mgmt
Financing live
Cash to close
- Down payment
- $72,475
- Closing costs
- $8,697
- Reserves months
- —
- Total cash needed
- —
Loan-product check · same deal, 3 products live
Conventional
25% down · 7.5% · 30yr
- Down + closing
- —
- Monthly P&I
- —
- Monthly cashflow
- —
- DSCR
- —
- Eligible?
- —
Personal DTI + credit; lowest rate.
DSCR
20% down · 8.5% · 30yr
- Down + closing
- —
- Monthly P&I
- —
- Monthly cashflow
- —
- DSCR
- —
- Eligible?
- —
No personal income docs; deal must DSCR.
Hard money
10% down · 12.0% · 12mo
- Down + closing
- —
- Monthly P&I
- —
- Monthly cashflow
- —
- DSCR
- —
- Eligible?
- —
Short-term bridge; refi at stabilization.
Rent comps 12 comps
| Address | Beds | Baths | Sqft | Rent | $/sqft | DOM | Units | Dist |
|---|---|---|---|---|---|---|---|---|
| 3606 Kaliste Saloom Rd Unit 201 Lafayette, LA | 3.0 | 2.0 | 1402 | $1,450 | $1.03 | 21d | 1 | 0.76mi |
| 106 Shadow Springs Dr Lafayette, LA | 3.0 | 2.0 | 1850 | $2,295 | $1.24 | 44d | 1 | 0.99mi |
| 5530 Ambassador Caffrey Blvd Lafayette, LA | 1.0–3.0 | 1.0–2.0 | 1194 | $1,875 | $1.57 | 14d | 15 | 1.13mi |
| 903 Canberra Rd Lafayette, LA | 3.0 | 2.0 | 1752 | $1,975 | $1.13 | 21d | 1 | 1.19mi |
| 107 Papwood Cir Lafayette, LA | 3.0 | 2.0 | 1805 | $2,000 | $1.11 | 21d | 1 | 1.33mi |
| 150 La Rue Vil Lafayette, LA | 3.0 | 2.0 | 1650 | $1,650 | $1.00 | 14d | 1 | 1.37mi |
| 204 Student Ln Lafayette, LA | 3.0 | 2.0 | 1976 | $3,500 | $1.77 | 44d | 1 | 1.44mi |
| 115 La Rue Vil Lafayette, LA | 3.0 | 2.0 | 1860 | $1,900 | $1.02 | 45d | 1 | 1.44mi |
| 202 Student Ln Lafayette, LA | 4.0 | 2.0 | 2017 | $4,000 | $1.98 | 44d | 1 | 1.45mi |
| 402 E Martial Ave Lafayette, LA | 3.0 | 2.0 | 1500 | $4,000 | $2.67 | 44d | 1 | 1.47mi |
| 404 E Martial Ave Lafayette, LA | 4.0 | 2.0 | 2017 | $4,000 | $1.98 | 44d | 1 | 1.47mi |
| 406 E Martial Ave Lafayette, LA | 4.0 | 2.0 | 2017 | $5,000 | $2.48 | 44d | 1 | 1.47mi |
Listing history 13 events
-
2026-06-03days on market $289,900 Active 132 DOM
-
2026-06-02days on market $289,900 Active 131 DOM
-
2026-06-01days on market $289,900 Active 130 DOM
-
2026-05-31days on market $289,900 Active 129 DOM
-
2026-05-30days on market $289,900 Active 128 DOM
-
2026-02-10price $279,900
-
2026-02-03$285,500 Active
-
2026-01-22$289,900 Active 400-char remark
Show marketing remark (400 chars)
Located off Kaliste Saloom by St. Thomas Moore HS. This four bedroom, two bath home features wood floors in living room with wood burning fireplace, kitchen with granite tile countertops and large master bedroom and master bath with seperate jacuzzi tub and shower. Home is in need of some TLC, repainting and priced accordingly. Agent/Owner, pre qualified buyers, appointment required, 337/316/3594.
-
2011-05-27soldstatus $210,700
-
2011-05-27soldstatus $210,700
-
2011-01-28$220,000
-
2006-07-18soldstatus $247,900
-
2006-03-08$247,900
ⓘ Source: listings_history table (triggers on properties + properties_extension) + one-shot
backfill from property_details.listing_events for pre-trigger history.
Tax reassessment forecast LA · Resets to sale price
- Current annual tax
- $2,553 · $213/mo
- Projected year-2 tax
- $2,553 · $213/mo
- Expected delta
- $0/yr ($0/mo · 0.0%)
ⓘ Screening estimate from a state-policy table — verify with the county assessor before closing.
Climate risk First Street
- Flood 1/10 Low FEMA zone X (unshaded) · 0% chance over 30 yrs
- Wildfire 1/10 Low
- Heat 9/10 Extreme 7 d/yr ≥108°F today · 21 d/yr by 30 yrs out
- Wind 9/10 Extreme 99% chance of damaging wind over 30 yrs
- Air quality 1/10 Low 0 unhealthy d/yr today · 0 by 30 yrs out
Nearby sold comps map
Loading sold comps map…
Walkable amenities ~0.75 mi
Loading nearby amenities…
Taxation est. · year 1
- Rental income
- $31,415
- − Mortgage interest
- −$16,239
- − Property taxes
- −$2,553
- − Insurance
- −$1,450
- − Repairs & maintenance
- −$2,513
- − Management
- −$2,513
- − Depreciation
- −$8,433
- Taxable loss
- −$2,286
- Est. tax savings @ 24.0%
- +$549
- After-tax cash flow
- $3,121/yr
For passive investors: Depreciation is non-cash, so a rental often shows a tax loss while cash-flowing — sheltering income. Rental losses are passive: they offset passive income freely, and up to $25,000/yr can offset ordinary (W-2) income if you actively participate and your MAGI is under $100k (phasing out to $0 by $150k); unused losses carry forward. On sale, claimed depreciation is recaptured at up to 25%, and gains may owe capital-gains tax (a 1031 exchange can defer both). Figures are a year-1 estimate at your 24.0% rate — not tax advice; consult a CPA.
Schools (NCES district)
- District
- Lafayette Parish
- NCES district ID
- 2200870
- Math proficiency
- 38% ▼ -32.00%
- Reading proficiency
- 46% ▼ -24.00%
- Median HH income
- $50,238
- Composite
- 36.15/100
- National rank
- #4741
- State rank
- #19 of 98 in LA
Livability — Lafayette
- Score
- 70/100
- State rank
- #63
- US rank
- #8133
Category grades
Schools grade is shown separately in the Schools card above.
Census & demographics
- Census place
- Lafayette, LA
- County
- Lafayette Parish · 207,544 people
- City population
- 158,114
- Metro
- Lafayette, LA
- Population (ZIP)
- 40,592
- Household income
- $86,005
- Rent vs Own
- Severe rent burden
- 1860.0
Population outlook (Lafayette County) Hauer SSP2
- Today (2025)
- 280,930 people
- By 2030
- 301,092 · +7.2%
- By 2040
- 339,456 · +20.8%
- By 2050
- 375,156 · +33.5%
- By 2075
- 451,672 · +60.8%
- By 2100
- 497,203 · +77.0%
Race, ethnicity, and origin ACS 2023
- Neighborhood character
- Predominantly White (75%)
- Race & ethnicity
- White 75% Black 13% Two or more races 7% Hispanic / Latino 5% Asian 3%
- Common ancestry
- Lithuanian 20% Slovak 2% Italian 1%
- Foreign-born
- 5% · Canada, China
- Languages at home
- 91% English-only · Spanish 3% French/Haitian/Cajun 2% Other Indo-European 1%
Political lean MEDSL · Lafayette
- 2024 margin
- Solid R (+31.4) · D 33.5% · R 64.8% · Other 1.7%
- 2008→2024 swing
- -0.1pp no change · 2008: -31.3pp · 2024: -31.4pp
- All cycles
- 2024: R+31.4 2020: R+28.7 2016: R+33.6 2012: R+33.7 2008: R+31.3
Not yet ingested
- Civics
- —
Market trends
- HPI YoY
- ▼ -76.28%
- Current HPI
- 143.6305
- Rent YoY
- ▲ 1.23%
- Metro
- Lafayette, LA
- State GDP YoY
- ▲ 3.29%
- F500 in state
- 10
Industry mix (Fortune 500 HQ in LA)
| Industry | F500 HQs | Revenue |
|---|---|---|
| Telecommunications | 2 | $23B |
|
||
| Utilities | 1 | $12B |
|
||
| Wholesale / Distribution | 1 | $5B |
|
||
| Advertising | 1 | $2B |
|
||
Price history
+12.9% since first listed8 events — show timeline
- 2026-02-10 Price Changed $279,900 AcadianaMLS
- 2026-02-03 Listed $285,500 AcadianaMLS
- 2026-01-22 Listed $289,900 ForSaleByOwner.com
- 2011-05-27 Sold (Public Records) $210,700 Public Records
- 2011-05-27 Sold (MLS) $210,700 AcadianaMLS
- 2011-01-28 Listed $220,000 AcadianaMLS
- 2006-07-18 Sold (MLS) $247,900 AcadianaMLS
- 2006-03-08 Listed $247,900 AcadianaMLS
Property tax history
+5.7%/yrLatest (2025): $2,553 · -1.1% YoY. Source: county tax records.
Cash-flow waterfall
monthlySold comps — $/sqft
last 12 mo · ≤1 miLoading sold comps…