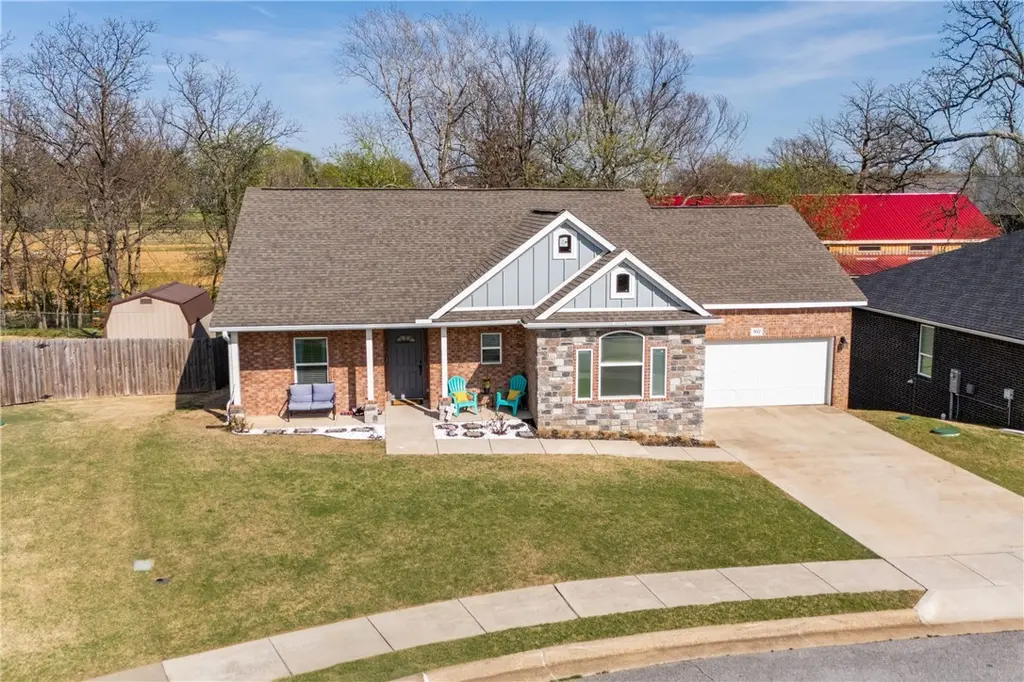
952 Glass St · Cave Springs, AR
Flood risk 1/10 · Minimal
- FEMA flood zone
- X (unshaded)
- Chance of flooding over 30 yrs
- 0.0%
- Est. flood insurance / yr
- $507 – $1,088
Fire risk 5/10 · Moderate
- Est. fire insurance / yr
- $1,499 – $2,785
Heat risk 5/10 · Moderate
- Hot days now (above 105°F)
- 7 days/yr
- Hot days in 30 yrs
- 20 days/yr
Wind risk 2/10 · Minimal
- Chance of severe wind over 30 yrs
- 2.0%
Air-quality risk 1/10 · Minimal
- Unhealthy air days now
- 0 days/yr
- Unhealthy air days in 30 yrs
- 0 days/yr
Risk factors via First Street. Map © Google.
Why this score? — see what drove the C grade
The composite is a weighted blend of 9 inputs, each scored 0–100. Each bar is that input's sub-score; the figure is the points it added to the 100-point composite (weight × sub-score).
- ARV discount +15.0/15.0
- Cash flow +10.9/30.0
- Appreciation +10.0/10.0
- Schools +5.2/10.0
- Livability +3.6/5.0
- DSCR +3.2/10.0
- 1% rule +2.6/10.0
- Rent growth +2.5/5.0
- Condition / age +2.5/5.0
$359,000
🖨 Deal sheet (PDF) 📄 Offer letter ✓ Due diligence
Listing remarks
Location! Enjoy the convenience of living in the heart of Cave Springs without the upkeep of a large, high-maintenance yard. This one-owner home is just minutes from I-49, Pinnacle Country Club, Hwy 112, restaurants, shopping, and all that Northwest Arkansas has to offer. Inside, you'll love the spacious open-concept floor plan and beautifully appointed kitchen with abundant cabinetry and generous counter space, seamlessly connecting the kitchen, dining, and living areas for easy everyday living and entertaining. Step out to the back deck—perfect for relaxing, grilling, and watching the neighbor's horses play. Enjoy peaceful Arkansas scenery and expansive views from your backyard retr
Key facts
- Master suite
- Beautiful kitchen
- Split floor plan
Tags
Property features AI
Finance
- HOA & community: HOA fees billed monthly; Curbs in community
Exterior
- Parking: Attached garage with garage door opener; 2 covered spaces
- Utilities: Cable available; Electricity available; Natural gas available; Public water; Public sewer
- Home design: Single-story home; Brick construction; Slab foundation; Architectural shingle roof
- Construction: Brick exterior; Slab foundation; Architectural shingle roof
- Exterior features: Concrete driveway; Deck; Patio; Back yard fencing (chain link); Landscaped lot; Subdivision setting; Sloped lot; Road frontage on public road/highway
Interior
- Kitchen: Dishwasher; Gas cooktop; Gas oven; Self-cleaning oven; Microwave; Disposal; Plumbed for ice maker; Granite counters; Eat-in kitchen; Pantry
- Bedrooms: Main level bedroom (11 x 11); Main level bedroom (15 x 11)
- Flooring: Carpet; Laminate; Simulated wood; Tile
- Bathrooms: 2 full bathrooms
- Heating & cooling: Central heating; Central air conditioning
- Interior features: Cathedral ceilings; Eat-in kitchen; Granite counters; Pantry; Gas log fireplace (1)
- Laundry & utility: Main level utility room (7 x 6); Gas water heater
Neighborhood map
What this means for you Summary
Snapshot
- This is a 3-bed/2.0-bath single-family listed at $359k.
Deal economics
- At list price, monthly cash flow is $-159 ($-2k/yr) — negative.
- To cash-flow at today's rent, offer at most $331k (7.8% below list).
- To meet the 1% rule (rent ≥ 1% of price), the offer needs to be $274k (23.7% below list).
- Recommended offer: $274k (23.7% below list) — sets the bar for 1% rule.
- Cap rate 5.8% vs local median 3.4% in Cave Springs — top-decile yield for the area; either an underpriced asset or a hidden risk that comps aren't pricing in. Stress-test before assuming the spread holds.
Location & tenants
- Location reads 71/100 on livability (#41 in AR) — a middle-class / working-renter tenant base. Strengths: crime A+, employment A+, housing A+; Watch: cost of living C-, schools D, amenities F.
- Bentonville School District (urban): math 59% / reading 59% proficiency, ranked #3 of 238 in AR (top 1%) — acceptable for families but not a draw, mixed tenant base, ~2y average lease.
- Market conditions: 111 active listings in the ZIP; 3 comparable units currently listed for rent nearby; rentals at typical pace (median 15d on market — plan ~3-4 weeks tenant-placement turnaround); 4,359 units permitted in Benton County in 2024 (402 in 5+ unit buildings).
Forward outlook
- In year one you build about $38k of equity ($2k loan paydown + $36k appreciation (10.0% local appreciation)).
- Benton County population projected at +56% by 2050 — long-run rental-demand tailwind backs the buy-and-hold thesis.
- By year 2, paydown + projected appreciation supports a ~$62k cash-out refi (75% LTV) — recoverable capital for the next deal without selling this one.
Negotiation context
- It's been on market 79 days — a 6% lower offer ($337k) is reasonable based on typical stale-listing flexibility.
- 2 sale attempts since 7y ago; this cycle's ask has dropped $26k (7%) from the opening price — seller is motivated, your offer sets the floor, not the list.
- Current owner paid $247k; 46% above their basis — modest negotiation headroom, anchor on the comps not their cost.
Risks & watch-outs
- Climate carrying-cost: moderate wildfire risk; extreme-heat days projected 7→20/yr by 2055 (HVAC capex compounding) — expect insurance premiums to compound above CPI over the hold.
Questions for the listing agent
- What do current leases actually rent for vs. the listed asking? Can we see a recent rent roll and the last 12 months of T-12 income?
- It's been on market 79 days. Have you received any prior offers? Is the seller open to a 24% concession, seller financing, or rate buy-down credit?
- Why hasn't it sold? Are there any deal-killer items the seller is aware of (foundation, flood, title, zoning, code violations)?
- Is there a deadline driving the sale (1031 exchange, divorce, estate, relocation)? That informs how much negotiation room exists.
- Schools are D-rated, which usually means shorter tenancies and higher turnover. Who's the typical renter profile here, and what's been the actual vacancy rate?
- What's the average days-on-market for RENTAL listings here right now (not sales)? A rising rental-DOM trend means longer vacancies and softer asking-rent achievability than the comps imply.
- What's the recent tenant-quality profile in this submarket — average credit score on applications, eviction rate, late-payment / NSF rate, and stable-employment percentage? A property-management company in the area should have these aggregated.
- How much new for-sale + rental construction is in the pipeline within 1–3 miles? Heavy new supply typically softens prices + rents 12–24 months out; constrained supply supports both.
Investment metrics
- 1% rule
- 0.76% ✗
- Cap rate
- 5.76%
- Cash-on-cash
- -1.90%
- DSCR
- 0.92
- GRM
- 10.9
CMA / ARV
- ARV (on-the-fly)
- $452,733
- Comps found
- 12
Show comp detail 12 sales within ~0.75 mi
| Address | Dist | Beds/Ba | Sqft | Sold | Price | $/sf | Match |
|---|---|---|---|---|---|---|---|
| 962 Glass St | 0.07mi | 3/2.0 | 1,901 (-4%) | 11mo | $405,000 | $213 | 81 |
| 960 Glass St | 0.06mi | 3/2.5 | 1,886 (-5%) | 10mo | $389,900 | $207 | 79 |
| 806 Dollar St | 0.11mi | 3/2.5 | 1,839 (-7%) | 10mo | $452,500 | $246 | 73 |
| 434 Alton St | 0.54mi | 3/2.0 | 1,970 (-0%) | 2mo | $485,000 | $246 | 72 |
| 691 Weston Cir | 0.34mi | 3/2.0 | 1,898 (-4%) | 7mo | $420,000 | $221 | 72 |
| 1200 Sycamore St | 0.27mi | 4/2.0 (+1) | 1,902 (-4%) | 5mo | $445,000 | $234 | 72 |
| 951 Piper St | 0.20mi | 4/2.0 (+1) | 1,700 (-14%) | 1mo | $389,900 | $229 | 62 |
| 1370 Shook Dr | 0.71mi | 3/2.0 | 1,920 (-3%) | 2mo | $429,331 | $224 | 61 |
| 1009 Peak St | 0.39mi | 4/2.0 (+1) | 2,106 (+6%) | 8mo | $375,000 | $178 | 59 |
| 360 Clayton Rd | 0.59mi | 3/2.0 | 1,850 (-6%) | 10mo | $395,000 | $214 | 54 |
| 493 E Lowell Ave | 0.69mi | 3/2.0 | 1,898 (-4%) | 11mo | $545,000 | $287 | 52 |
| 1208 Hickory St | 0.34mi | 4/2.0 (+1) | 2,250 (+14%) | 9mo | $539,900 | $240 | 49 |
Match score weights: distance 35% · size 25% · config 20% · recency 20%. Top-matched comps best support the ARV.
Projected returns pro-forma
10.0% appreciation · 3.0% rent growth · sell at horizon
- IRR
- 22.9%
- Equity multiple
- 2.84×
- Total profit
- $185,337
- Equity at exit
- $323,416
- IRR
- 20.5%
- Equity multiple
- 6.51×
- Total profit
- $553,638
- Equity at exit
- $697,458
Cash invested: $100,520 (down + closing). Projections, not guarantees.
Landlord ↔ Tenant lean methodology
- Overall (STATE)
- 92 Strongly Landlord-Friendly
- State Arkansas
- 92 Strongly Landlord-Friendly · R+14
- County
- — inherits STATE
- City
- — inherits STATE
ZIP-level market 72718
- Home prices YoY
- 14.1%
- Active inventory
- 111
- Price-to-rent
- 10.9×
Monthly cashflow live
- Estimated rent
- $2,737 medium interval (Pro) →
- Mortgage (P&I)
- −$1,883
- Tax from tax record
- −$289 /mo · $3,472/yr
- Insurance
- −$150
- HOA
- −$0
- Vacancy / Maint / Mgmt
- −$575
- Net cashflow
- $-159
Break-even live
Sensitivity live
| Price | -10% $44 | -5% $-57 | +0% $-159 | +5% $-261 | +10% $-362 |
|---|---|---|---|---|---|
| Rent | -10% $-375 | -5% $-267 | +0% $-159 | +5% $-51 | +10% $57 |
| Rate | -1.0pp $22 | -0.5pp $-68 | base $-159 | +0.5pp $-252 | +1.0pp $-347 |
UW: 25.0% down · 7.5% · 30yr · 1.5% tax · 5.0% vac · 8.0% maint · 8.0% mgmt
Financing live
Cash to close
- Down payment
- $89,750
- Closing costs
- $10,770
- Reserves months
- —
- Total cash needed
- —
Loan-product check · same deal, 3 products live
Conventional
25% down · 7.5% · 30yr
- Down + closing
- —
- Monthly P&I
- —
- Monthly cashflow
- —
- DSCR
- —
- Eligible?
- —
Personal DTI + credit; lowest rate.
DSCR
20% down · 8.5% · 30yr
- Down + closing
- —
- Monthly P&I
- —
- Monthly cashflow
- —
- DSCR
- —
- Eligible?
- —
No personal income docs; deal must DSCR.
Hard money
10% down · 12.0% · 12mo
- Down + closing
- —
- Monthly P&I
- —
- Monthly cashflow
- —
- DSCR
- —
- Eligible?
- —
Short-term bridge; refi at stabilization.
Rent comps 3 comps
| Address | Beds | Baths | Sqft | Rent | $/sqft | DOM | Units | Dist |
|---|---|---|---|---|---|---|---|---|
| 967 Glass St Unit 1241330P Cave Springs, AR | 3.0 | 2.0 | 1679 | $2,966 | $1.77 | 15d | 1 | 0.09mi |
| 1021 Clayton Rd Cave Springs, AR | 3.0 | 2.0 | 1721 | $2,100 | $1.22 | 24d | 1 | 0.27mi |
| 599 S Main St Cave Springs, AR | 3.0 | 3.0 | 2399 | $2,895 | $1.21 | 14d | 1 | 0.93mi |
Listing history 28 events
-
2026-06-18days on market $359,000 Active 79 DOM
-
2026-06-17days on market $359,000 Active 78 DOM
-
2026-06-15days on market $359,000 Active 76 DOM
-
2026-06-14days on market $359,000 Active 74 DOM
-
2026-06-10days on market $359,000 Active 71 DOM
-
2026-06-09days on market $359,000 Active 70 DOM
-
2026-06-09price $359,000 Active 69 DOM
-
2026-06-08days on market $365,000 Active 69 DOM
-
2026-06-07remarks 693-char remark
-
2026-06-07days on market $365,000 Active 68 DOM
-
2026-06-05days on market $365,000 Active 65 DOM
-
2026-06-03days on market $365,000 Active 64 DOM
-
2026-06-02pricedays on market $365,000 Active 63 DOM
-
2026-06-01days on market $375,000 Active 62 DOM
-
2026-05-31days on market $375,000 Active 61 DOM
-
2026-05-31days on market $375,000 Active 60 DOM
-
2026-05-19price $375,000
-
2026-04-14price $379,900
-
2026-03-31$385,000 Active
-
2026-01-28price $387,000
-
2025-11-12price $393,000
-
2023-06-09price $370,000
-
2023-03-14price $373,000
-
2023-01-25price $381,000
-
2020-07-16soldstatus $246,650
-
2019-12-11$239,900
-
2017-12-12soldstatus $44,100
-
2017-12-12soldstatus $44,100
ⓘ Source: listings_history table (triggers on properties + properties_extension) + one-shot
backfill from property_details.listing_events for pre-trigger history.
Tax reassessment forecast AR · Resets to sale price
- Current annual tax
- $3,472 · $289/mo
- Projected year-2 tax
- $3,472 · $289/mo
- Expected delta
- $0/yr ($0/mo · 0.0%)
ⓘ Screening estimate from a state-policy table — verify with the county assessor before closing.
Climate risk First Street
- Flood 1/10 Low FEMA zone X (unshaded) · 0% chance over 30 yrs
- Wildfire 5/10 Major
- Heat 5/10 Major 7 d/yr ≥105°F today · 20 d/yr by 30 yrs out
- Wind 2/10 Low 2% chance of damaging wind over 30 yrs
- Air quality 1/10 Low 0 unhealthy d/yr today · 0 by 30 yrs out
Nearby sold comps map
Loading sold comps map…
Walkable amenities ~0.75 mi
Loading nearby amenities…
Taxation est. · year 1
- Rental income
- $32,849
- − Mortgage interest
- −$20,110
- − Property taxes
- −$3,472
- − Insurance
- −$1,795
- − Repairs & maintenance
- −$2,628
- − Management
- −$2,628
- − Depreciation
- −$10,444
- Taxable loss
- −$8,227
- Est. tax savings @ 24.0%
- +$1,975
- After-tax cash flow
- $66/yr
For passive investors: Depreciation is non-cash, so a rental often shows a tax loss while cash-flowing — sheltering income. Rental losses are passive: they offset passive income freely, and up to $25,000/yr can offset ordinary (W-2) income if you actively participate and your MAGI is under $100k (phasing out to $0 by $150k); unused losses carry forward. On sale, claimed depreciation is recaptured at up to 25%, and gains may owe capital-gains tax (a 1031 exchange can defer both). Figures are a year-1 estimate at your 24.0% rate — not tax advice; consult a CPA.
Schools (NCES district)
- District
- Bentonville School District
- NCES district ID
- 0503060
- Math proficiency
- 59% ▼ -8.00%
- Reading proficiency
- 59% ▼ -6.00%
- Median HH income
- $66,721
- Composite
- 51.85/100
- National rank
- #1661
- State rank
- #3 of 238 in AR
Livability — Cave Springs
- Score
- 71/100
- State rank
- #41
- US rank
- #6981
Category grades
Schools grade is shown separately in the Schools card above.
Census & demographics
- Census place
- Cave Springs, AR
- City population
- 5,528
- Population (ZIP)
- 5,528
Population outlook (Benton County) Hauer SSP2
- Today (2025)
- 318,683 people
- By 2030
- 353,481 · +10.9%
- By 2040
- 425,280 · +33.4%
- By 2050
- 497,239 · +56.0%
- By 2075
- 662,114 · +107.8%
- By 2100
- 776,431 · +143.6%
Race, ethnicity, and origin ACS 2023
- Neighborhood character
- Predominantly White (69%)
- Race & ethnicity
- White 69% Two or more races 25% Hispanic / Latino 7%
- Hispanic origin (detail)
- Mexican 5%
- Common ancestry
- Slovak 4% Romanian 3% Lithuanian 2%
- Foreign-born
- 3% · Canada
- Languages at home
- 92% English-only · Spanish 6% Other Asian/Pacific 2%
Political lean MEDSL · Benton
- 2024 margin
- Strong R (+27.0) · D 35.2% · R 62.1% · Other 2.7%
- 2008→2024 swing
- +9.6pp toward D · 2008: -36.5pp · 2024: -27.0pp
- All cycles
- 2024: R+27.0 2020: R+26.4 2016: R+34.9 2012: R+40.4 2008: R+36.5
Not yet ingested
- Civics
- —
Market trends
- HPI YoY
- ▲ 41.26%
- Current HPI
- 334.6594
- Rent YoY
- —
- Metro
- —
- State GDP YoY
- ▲ 3.80%
- F500 in state
- 10
Industry mix (Fortune 500 HQ in AR)
| Industry | F500 HQs | Revenue |
|---|---|---|
| Retail | 1 | $681B |
|
||
| Food / Agriculture | 1 | $53B |
|
||
| Retail / Energy | 1 | $22B |
|
||
| Transportation / Logistics | 1 | $12B |
|
||
| Energy | 1 | $4B |
|
||
Price history
+750.3% since first listed12 events — show timeline
- 2026-05-19 Price Changed $375,000 NWARMLS
- 2026-04-14 Price Changed $379,900 NWARMLS
- 2026-03-31 Listed $385,000 NWARMLS
- 2026-01-28 Price Changed $387,000 NWARMLS
- 2025-11-12 Price Changed $393,000 NWARMLS
- 2023-06-09 Price Changed $370,000 NWARMLS
- 2023-03-14 Price Changed $373,000 NWARMLS
- 2023-01-25 Price Changed $381,000 NWARMLS
- 2020-07-16 Sold (MLS) $246,650 NWARMLS
- 2019-12-11 Listed $239,900 NWARMLS
- 2017-12-12 Sold (Public Records) $44,100 Public Records
- 2017-12-12 Sold (Public Records) $44,100 Public Records
Property tax history
+30.6%/yrLatest (2025): $3,472 · +2.0% YoY. Source: county tax records.
Cash-flow waterfall
monthlySold comps — $/sqft
last 12 mo · ≤1 miLoading sold comps…