 🔨 Auction
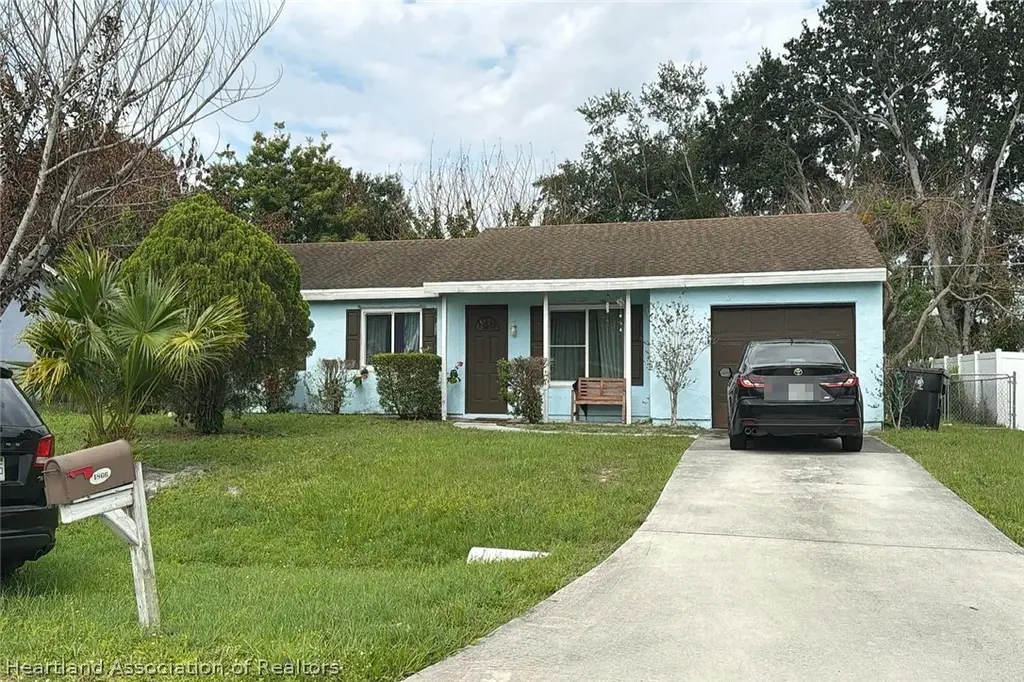
1866 SE Aneci St · Port St. Lucie, FL
Flood risk 1/10 · Minimal
- FEMA flood zone
- X (unshaded)
- Chance of flooding over 30 yrs
- 0.0%
- Est. flood insurance / yr
- $507 – $1,088
Fire risk 1/10 · Minimal
- Est. fire insurance / yr
- $947 – $1,759
Heat risk 10/10 · Severe
- Hot days now (above 106°F)
- 7 days/yr
- Hot days in 30 yrs
- 25 days/yr
Wind risk 10/10 · Severe
- Chance of severe wind over 30 yrs
- 99.0%
Air-quality risk 2/10 · Minimal
- Unhealthy air days now
- 1 days/yr
- Unhealthy air days in 30 yrs
- 1 days/yr
Risk factors via First Street. Map © Google.
Why this score? — see what drove the F grade
The composite is a weighted blend of 9 inputs, each scored 0–100. Each bar is that input's sub-score; the figure is the points it added to the 100-point composite (weight × sub-score).
- Cash flow +7.8/30.0
- ARV discount +7.5/15.0
- Schools +3.7/10.0
- Rent growth +2.9/5.0
- Livability +2.5/5.0
- Condition / age +2.5/5.0
- 1% rule +2.3/10.0
- DSCR +1.9/10.0
- Appreciation +0.0/10.0
$5,000
🖨 Deal sheet 📄 Offer letter ✓ Due diligence
Listing remarks
Foreclosure Auction Ends June 10, 2026 at 8:00 AM EST. Explore this charming 3-bedroom, 2-bath residence set in a peaceful and well-located Port Saint Lucie community. The list price is the opening bid for the online auction. Sold As-is. Explore more details and submit your bid through Federa Home App.
Key facts
- 0.23 acre lot
- Garage
- Built 1979
Property features AI
Finance
- Other: Zoning: RS-2
Exterior
- Parking: 1-car garage
- Utilities: Other water source; Other sewer
- Home design: Single family residence; One level; Residential property
- Construction: Construction materials: see remarks
- Exterior features: Front porch; Other roof
Interior
- Bedrooms: 1 total room
- Flooring: Other
- Bathrooms: 2 full bathrooms
- Heating & cooling: No heating; No cooling
- Interior features: Other flooring
Neighborhood map
What this means for you Summary
Snapshot
- This is a 3-bed/2.0-bath single-family listed at $5k.
Deal economics
- At list price, monthly cash flow is $-358 ($-4k/yr) — negative.
- The deal already cash-flows at list — no discount required.
- Meets the 1% rule at list price ($2k rent vs $5k).
- Cap rate 5.0% vs local median 3.9% in Port St. Lucie — meaningfully above typical; check what's discounted (condition, days-on-market, listing class) to confirm the premium yield is real.
Location & tenants
- Location reads: area grade F — affects rentability + tenant quality, not the cash-flow math above.
- St. Lucie (urban): math 40% / reading 48% proficiency, ranked #51 of 73 in FL (top 70%) — families likely to look elsewhere, expect single-tenant / working-renter base with shorter leases.
- Market conditions: Rents rising (+1.5%/yr); 358 active listings in the ZIP; 16 comparable units currently listed for rent nearby; rentals at typical pace (median 24d on market — plan ~3-4 weeks tenant-placement turnaround); solid renter incomes; 4,868 units permitted in St. Lucie County in 2024 (268 in 5+ unit buildings).
- This rent runs 38% of the median local income ($75k/yr) — at the standard rent-burdened threshold; future hikes will face affordability resistance.
Forward outlook
- Local home prices are declining (-3.0%/yr); year-one equity from $2k of loan paydown is wiped out by about $10k of value loss. Plan a longer hold.
- St. Lucie County population projected at +20% by 2050 — long-run rental-demand tailwind backs the buy-and-hold thesis.
Negotiation context
- Only 8 days on market — expect competitive offers; lowballing is unlikely to land.
- 5 sale attempts since 22y ago with the ask held roughly flat each time — persistent listings suggest the price (not the market) is what's stuck; bring a comps-based counter.
Risks & watch-outs
- Watch-outs: property tax is 97.0% of price.
- Climate carrying-cost: severe wind risk, 99% chance of damaging wind over 30y; extreme-heat days projected 7→25/yr by 2055 (HVAC capex compounding) — expect insurance premiums to compound above CPI over the hold.
Questions for the listing agent
- What do current leases actually rent for vs. the listed asking? Can we see a recent rent roll and the last 12 months of T-12 income?
- Built in 1979 — when were the roof, HVAC, electrical panel, plumbing, and water heater last replaced?
- Property tax is high relative to price — has the assessment been appealed recently, and will the sale trigger a re-assessment?
- Is there a deadline driving the sale (1031 exchange, divorce, estate, relocation)? That informs how much negotiation room exists.
- The area grade is low — what's the realistic commute time and amenity access for the typical tenant pool here? Any planned neighborhood developments (good or bad) we should know about?
- What's the average days-on-market for RENTAL listings here right now (not sales)? A rising rental-DOM trend means longer vacancies and softer asking-rent achievability than the comps imply.
- What's the recent tenant-quality profile in this submarket — average credit score on applications, eviction rate, late-payment / NSF rate, and stable-employment percentage? A property-management company in the area should have these aggregated.
- How much new for-sale + rental construction is in the pipeline within 1–3 miles? Heavy new supply typically softens prices + rents 12–24 months out; constrained supply supports both.
Investment metrics
- 1% rule
- 0.73% ✗
- Cap rate
- 4.96%
- Cash-on-cash
- -4.75%
- DSCR
- 0.79
- GRM
- 11.3
CMA / ARV
- ARV (on-the-fly)
- $323,400
- Comps found
- 12
Show comp detail 12 sales within ~0.75 mi
| Address | Dist | Beds/Ba | Sqft | Sold | Price | $/sf | Match |
|---|---|---|---|---|---|---|---|
| 433 SE Seahouse Dr | 0.24mi | 3/2.0 | 1,221 (+4%) | 3mo | $347,000 | $284 | 80 |
| 2142 SE Watercrest St | 0.49mi | 3/2.0 | 1,176 (0%) | 2mo | $300,000 | $255 | 75 |
| 417 SE Seahouse Dr | 0.24mi | 3/2.0 | 1,274 (+8%) | 3mo | $355,000 | $279 | 72 |
| 634 SE Whitmore Dr | 0.33mi | 3/2.0 | 1,096 (-7%) | 5mo | $395,000 | $360 | 69 |
| 118 SW Lancaster Ave | 0.54mi | 3/2.0 | 1,190 (+1%) | 6mo | $333,000 | $280 | 68 |
| 1650 SE Ocean Ln | 0.55mi | 3/2.0 | 1,178 (+0%) | 8mo | $324,000 | $275 | 68 |
| 1941 SE Aires Ln | 0.38mi | 2/2.0 (-1) | 1,241 (+6%) | 4mo | $250,000 | $201 | 65 |
| 392 SE Walters Ter | 0.72mi | 3/2.0 | 1,143 (-3%) | 4mo | $320,000 | $280 | 58 |
| 1657 SE Sandia Dr | 0.53mi | 2/2.0 (-1) | 1,259 (+7%) | 4mo | $290,000 | $230 | 55 |
| 1718 SE Aires Ln | 0.72mi | 3/2.0 | 1,257 (+7%) | 2mo | $310,000 | $247 | 53 |
| 1722 SE Biddle Ln | 0.56mi | 3/2.0 | 1,329 (+13%) | 4mo | $350,000 | $263 | 49 |
| 2065 SW Gemini Ln | 0.75mi | 3/2.0 | 1,300 (+10%) | 3mo | $350,000 | $269 | 45 |
Match score weights: distance 35% · size 25% · config 20% · recency 20%. Top-matched comps best support the ARV.
Projected returns pro-forma
-3.0% appreciation · 1.53% rent growth · sell at horizon
- IRR
- -26.0%
- Equity multiple
- 0.13×
- Total profit
- $-78,640
- Equity at exit
- $48,220
- IRR
- -28.2%
- Equity multiple
- -0.23×
- Total profit
- $-111,500
- Equity at exit
- $27,962
Cash invested: $90,552 (down + closing). Projections, not guarantees.
Landlord ↔ Tenant lean methodology
- Overall (STATE)
- 87 Strongly Landlord-Friendly
- State Florida
- 87 Strongly Landlord-Friendly · R+3
- County
- — inherits STATE
- City
- — inherits STATE
ZIP-level market 34983
- Home prices YoY
- -33.9%
- Rents YoY
- 1.5%
- Active inventory
- 358
- Price-to-rent
- 0.2×
Monthly cashflow live
- Estimated rent
- $2,376 high interval (Pro) →
- Mortgage (P&I)
- −$1,696
- Tax est. 1.5%
- −$404 /mo · $4,851/yr
- Insurance
- −$135
- HOA
- −$0
- Vacancy / Maint / Mgmt
- −$499
- Net cashflow
- $-358
Break-even live
UW: 25.0% down · 7.5% · 30yr · 1.5% tax · 5.0% vac · 8.0% maint · 8.0% mgmt
Financing live
Cash to close
- Down payment
- $80,850
- Closing costs
- $9,702
- Reserves months
- —
- Total cash needed
- —
Loan-product check · same deal, 3 products live
Conventional
25% down · 7.5% · 30yr
- Down + closing
- —
- Monthly P&I
- —
- Monthly cashflow
- —
- DSCR
- —
- Eligible?
- —
Personal DTI + credit; lowest rate.
DSCR
20% down · 8.5% · 30yr
- Down + closing
- —
- Monthly P&I
- —
- Monthly cashflow
- —
- DSCR
- —
- Eligible?
- —
No personal income docs; deal must DSCR.
Hard money
10% down · 12.0% · 12mo
- Down + closing
- —
- Monthly P&I
- —
- Monthly cashflow
- —
- DSCR
- —
- Eligible?
- —
Short-term bridge; refi at stabilization.
Rent comps 16 comps
| Address | Beds | Baths | Sqft | Rent | $/sqft | DOM | Units | Dist |
|---|---|---|---|---|---|---|---|---|
| 601 SE Polynesian Ave Port Saint Lucie, FL | 2.0 | 2.0 | 1143 | $2,000 | $1.75 | 14d | 1 | 0.16mi |
| 431 SE Dalva Ave Port Saint Lucie, FL | 3.0 | 2.0 | 1176 | $2,150 | $1.83 | 23d | 1 | 0.39mi |
| 1881 SE Airoso Blvd Port Saint Lucie, FL | 3.0 | 2.0 | 1384 | $2,200 | $1.59 | 23d | 1 | 0.58mi |
| 2249 SE Glover St Port Saint Lucie, FL | 3.0 | 2.0 | 1401 | $2,500 | $1.78 | 21d | 1 | 0.66mi |
| 1652 SE Floresta Dr Port Saint Lucie, FL | 3.0 | 2.0 | 1344 | $2,350 | $1.75 | 23d | 1 | 0.67mi |
| 2174 SW Wayne St Port Saint Lucie, FL | 3.0 | 2.0 | 1463 | $2,370 | $1.62 | 23d | 1 | 0.95mi |
| 205 SW Voltair Ter Port Saint Lucie, FL | 2.0 | 2.0 | 925 | $2,095 | $2.26 | 21d | 1 | 1.05mi |
| 233 SW Chapman Ave Port Saint Lucie, FL | 3.0 | 2.0 | 1467 | $1,250 | $0.85 | 21d | 1 | 1.10mi |
| 1382 SE Sandia Dr Port Saint Lucie, FL | 2.0 | 1.0 | 945 | $1,000 | $1.06 | 23d | 1 | 1.11mi |
| 262 SW Crescent Ave Port Saint Lucie, FL | 3.0 | 2.0 | 1482 | $2,600 | $1.75 | 23d | 1 | 1.13mi |
| 2010 SW Burlington St Port Saint Lucie, FL | 3.0 | 2.0 | 1118 | $2,600 | $2.33 | 23d | 1 | 1.21mi |
| 991 SE Walters Ter Port Saint Lucie, FL | 2.0 | 2.0 | 1040 | $8,500 | $8.17 | 23d | 1 | 1.24mi |
| 173 SE Fallon Dr Port Saint Lucie, FL | 3.0 | 2.0 | 1281 | $2,400 | $1.87 | 14d | 1 | 1.24mi |
| 279 SW Glenwood Dr Port Saint Lucie, FL | 3.0 | 2.0 | 1393 | $2,975 | $2.14 | 23d | 1 | 1.34mi |
| 650 SE Evergreen Ter Port Saint Lucie, FL | 2.0 | 2.0 | 974 | $2,095 | $2.15 | 14d | 1 | 1.40mi |
| 2342 SW Bayshore Blvd Port Saint Lucie, FL | 3.0 | 2.0 | 1176 | $2,300 | $1.96 | 23d | 1 | 1.44mi |
Listing history 7 events
-
2026-06-10days on market $5,000 Active 8 DOM
-
2026-06-09days on market $5,000 Active 7 DOM
-
2026-06-08days on market $5,000 Active 6 DOM
-
2026-06-07days on market $5,000 Active 5 DOM
-
2026-06-05days on market $5,000 Active 2 DOM
-
2026-06-03remarks 303-char remark
-
2026-06-03$5,000 Active 1 DOM
ⓘ Source: listings_history table (triggers on properties + properties_extension) + one-shot
backfill from property_details.listing_events for pre-trigger history.
Climate risk First Street
- Flood 1/10 Low FEMA zone X (unshaded) · 0% chance over 30 yrs
- Wildfire 1/10 Low
- Heat 10/10 Extreme 7 d/yr ≥106°F today · 25 d/yr by 30 yrs out
- Wind 10/10 Extreme 99% chance of damaging wind over 30 yrs
- Air quality 2/10 Low 1 unhealthy d/yr today · 1 by 30 yrs out
Nearby sold comps map
Loading sold comps map…
Walkable amenities ~0.75 mi
Loading nearby amenities…
Taxation est. · year 1
- Rental income
- $28,509
- − Mortgage interest
- −$18,115
- − Property taxes
- −$4,851
- − Insurance
- −$1,617
- − Repairs & maintenance
- −$2,281
- − Management
- −$2,281
- − Depreciation
- −$9,408
- Taxable loss
- −$10,044
- Est. tax savings @ 24.0%
- +$2,411
- After-tax cash flow
- $-1,887/yr
For passive investors: Depreciation is non-cash, so a rental often shows a tax loss while cash-flowing — sheltering income. Rental losses are passive: they offset passive income freely, and up to $25,000/yr can offset ordinary (W-2) income if you actively participate and your MAGI is under $100k (phasing out to $0 by $150k); unused losses carry forward. On sale, claimed depreciation is recaptured at up to 25%, and gains may owe capital-gains tax (a 1031 exchange can defer both). Figures are a year-1 estimate at your 24.0% rate — not tax advice; consult a CPA.
Schools (NCES district)
- District
- St. Lucie
- NCES district ID
- 1201770
- Math proficiency
- 40% ▼ -11.00%
- Reading proficiency
- 48% ▼ -4.00%
- Median HH income
- $44,737
- Composite
- 37.28/100
- National rank
- #4449
- State rank
- #51 of 73 in FL
Livability — Port St. Lucie
No livability data for this city. (Only ~50 U.S. cities are tracked.)
Census & demographics
- Census place
- Port St. Lucie, FL
- County
- Saint Lucie County · 337,150 people
- City population
- 221,051
- Metro
- Port St. Lucie, FL
- Population (ZIP)
- 49,001
- Household income
- $75,489
- Rent vs Own
- Severe rent burden
- 843.0
Population outlook (St. Lucie County) Hauer SSP2
- Today (2025)
- 338,016 people
- By 2030
- 355,687 · +5.2%
- By 2040
- 385,521 · +14.1%
- By 2050
- 406,106 · +20.1%
- By 2075
- 441,054 · +30.5%
- By 2100
- 436,885 · +29.2%
Race, ethnicity, and origin ACS 2023
- Neighborhood character
- Diverse neighborhood (Simpson 0.65)
- Race & ethnicity
- White 51% Hispanic / Latino 23% Black 18% Two or more races 13% Asian 3%
- Hispanic origin (detail)
- Mexican 3% Puerto Rican 9% Cuban 3%
- Common ancestry
- Hispanic 3% Romanian 2% Italian 1%
- Foreign-born
- 19% · Canada, Guatemala, Jamaica
- Languages at home
- 74% English-only · Spanish 15% French/Haitian/Cajun 4% Other Indo-European 2%
Political lean MEDSL · St. Lucie
- 2024 margin
- Lean R (+9.1) · D 45.1% · R 54.2%
- 2008→2024 swing
- -21.2pp toward R · 2008: 12.1pp · 2024: -9.1pp
- All cycles
- 2024: R+9.1 2020: R+1.6 2016: R+2.5 2012: D+7.9 2008: D+12.1
Not yet ingested
- Civics
- —
Market trends
- HPI YoY
- ▼ -209.28%
- Current HPI
- 407.6341
- Rent YoY
- ▲ 1.53%
- Metro
- Port St. Lucie, FL
- State GDP YoY
- ▲ 3.28%
- F500 in state
- 36
Industry mix (Fortune 500 HQ in FL)
| Industry | F500 HQs | Revenue |
|---|---|---|
| Industrial Technology | 2 | $29B |
|
||
| Insurance | 2 | $17B |
|
||
| Retail | 1 | $60B |
|
||
| Technology Distribution | 1 | $58B |
|
||
| Homebuilding | 1 | $35B |
|
||
| Technology Manufacturing | 1 | $35B |
|
||
Price history
-88.9% since first listed16 events — show timeline
- 2026-06-02 Listed $5,000 HAOR as distributed by MLS GRID
- 2018-06-29 Sold (Public Records) $165,000 Public Records
- 2018-06-26 Sold (MLS) $165,000 Beaches MLS
- 2018-05-10 Pending — Beaches MLS
- 2018-04-10 Price Changed $167,950 Beaches MLS
- 2018-04-10 Relisted — Beaches MLS
- 2018-02-10 Listing Removed — Beaches MLS
- 2018-01-19 Listed $159,900 Beaches MLS
- 2016-01-11 Price Changed $136,500 MCRTC
- 2004-08-03 Sold (Public Records) $139,000 Public Records
- 2004-07-16 Sold (MLS) $139,000 Beaches MLS
- 2004-06-18 Listing Removed — Beaches MLS
- 2004-05-16 Listed $136,500 Beaches MLS
- 2004-05-16 Listed $139,000 MCRTC
- 2004-03-04 Sold (Public Records) $121,000 Public Records
- 1998-04-10 Sold (Public Records) $45,000 Public Records
Property tax history
+5.6%/yrLatest (2025): $2,871 · +3.7% YoY. Source: county tax records.
Cash-flow waterfall
monthlySold comps — $/sqft
last 12 mo · ≤1 miLoading sold comps…