913 State St · East Carondelet, IL
Flood risk 1/10 · Minimal
- FEMA flood zone
- X (shaded)
- Chance of flooding over 30 yrs
- 0.0%
- Est. flood insurance / yr
- $507 – $1,088
Fire risk 1/10 · Minimal
- Est. fire insurance / yr
- $804 – $1,492
Heat risk 5/10 · Moderate
- Hot days now (above 109°F)
- 7 days/yr
- Hot days in 30 yrs
- 21 days/yr
Wind risk 2/10 · Minimal
- Chance of severe wind over 30 yrs
- 1.0%
Air-quality risk 3/10 · Minor
- Unhealthy air days now
- 2 days/yr
- Unhealthy air days in 30 yrs
- 3 days/yr
Risk factors via First Street. Map © Google.
Why this score? — see what drove the D grade
The composite is a weighted blend of 9 inputs, each scored 0–100. Each bar is that input's sub-score; the figure is the points it added to the 100-point composite (weight × sub-score).
- Appreciation +10.0/10.0
- Cash flow +8.4/30.0
- ARV discount +7.5/15.0
- Livability +3.4/5.0
- 1% rule +2.5/10.0
- Rent growth +2.5/5.0
- Condition / age +2.5/5.0
- DSCR +2.3/10.0
- Schools +1.2/10.0
$150,000
🖨 Deal sheet 📄 Offer letter ✓ Due diligence
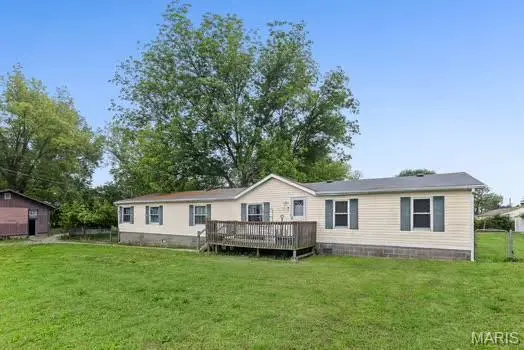
Listing remarks
Welcome home to this 3 bed, 2 bath home with a large bonus room nestled on almost an acre lot. Inside you will find an open floorplan, including spacious living room that leads to the kitchen/dining area with stainless appliances and large laundry room. The large primary bedroom has a spacious bathroom with soaker tub and large walk-in closet. You will also find 2 more spacious bedrooms and hall bathroom. Head out to the large backyard and enjoy the deck leading to an above ground pool and large 24x30 pole barn and pecan & pear trees. This home has the space and land you need. With a little imagination and some minor cosmetic updating, this would make the perfect home. Roof and HVAC r
Key facts
- 0.99 acre lot
- Pool
- Built 1996
Property features AI
Finance
- Other: Private ownership
Exterior
- Parking: Driveway
- Utilities: Public water; Public sewer; Electricity connected (220 volts); Water available; Sewer available
- Home design: Single family residence; Manufactured house; One level
- Construction: Shake siding; Architectural shingle roof; Block foundation; Built year from public records
- Exterior features: Deck; Back yard; Front yard; Level lot; Above-ground private pool; Pole barn(s); Shed(s)
Interior
- Kitchen: Electric cooktop; Dishwasher; Refrigerator; Stainless steel appliances; Exhaust fan
- Bedrooms: 3 bedrooms (all on the main level)
- Bathrooms: 2 full bathrooms (both on the main level)
- Heating & cooling: Electric heating; Forced air heating; Electric cooling
- Interior features: Stainless steel appliances; Electric cooktop; Dishwasher; Exhaust fan; Refrigerator; Ceiling fan(s)
- Laundry & utility: Main-level laundry room
Neighborhood map
What this means for you Summary
Snapshot
- This is a 3-bed/2.0-bath manufactured listed at $150k.
Deal economics
- At list price, monthly cash flow is $-135 ($-2k/yr) — negative.
- To cash-flow at today's rent, offer at most $126k (15.8% below list).
- To meet the 1% rule (rent ≥ 1% of price), the offer needs to be $113k (24.9% below list).
- Recommended offer: $113k (24.9% below list) — sets the bar for 1% rule.
Location & tenants
- Location reads 67/100 on livability (#535 in IL) — a middle-class / working-renter tenant base. Strengths: cost of living A+, housing A+; Watch: crime F, amenities F, health & safety F.
- Dupo CUSD 196 (suburban): math 7% / reading 19% proficiency, ranked #543 of 620 in IL (top 88%) — low school quality limits family demand, transient renter base, plan for 1-2y turnover.
- Zoned schools: Dupo High School (math 12% / reading 12%, grade F, #511 of 693 statewide, top 75%, 267 students, 0% FRL) — zoned schools average 0% FRL vs 52% district-wide (52 pts lower); this property's tenant base skews higher-income than the district average.
- Market conditions: 5 active listings in the ZIP; 783 units permitted in St. Clair County in 2024 (378 in 5+ unit buildings).
Forward outlook
- In year one you build about $16k of equity ($1k loan paydown + $15k appreciation (10.0% local appreciation)).
- St. Clair County population projected at -23% by 2050 — secular population decline; favor cash flow + early exit over multi-decade hold.
- By year 3, paydown + projected appreciation supports a ~$41k cash-out refi (75% LTV) — recoverable capital for the next deal without selling this one.
Negotiation context
- Only 5 days on market — expect competitive offers; lowballing is unlikely to land.
- Current owner paid $15k; list at $150k implies a 900% gain — meaningful room to come down on a strong offer.
Risks & watch-outs
- Climate carrying-cost: extreme-heat days projected 7→21/yr by 2055 (HVAC capex compounding) — expect insurance premiums to compound above CPI over the hold.
Questions for the listing agent
- What do current leases actually rent for vs. the listed asking? Can we see a recent rent roll and the last 12 months of T-12 income?
- Is there a deadline driving the sale (1031 exchange, divorce, estate, relocation)? That informs how much negotiation room exists.
- Schools are F-rated, which usually means shorter tenancies and higher turnover. Who's the typical renter profile here, and what's been the actual vacancy rate?
- Crime grade is F in this area — have there been break-ins, vandalism, or insurance claims at this property in the last 3 years? What carrier currently insures it and at what premium?
- The area grade is low — what's the realistic commute time and amenity access for the typical tenant pool here? Any planned neighborhood developments (good or bad) we should know about?
- What's the average days-on-market for RENTAL listings here right now (not sales)? A rising rental-DOM trend means longer vacancies and softer asking-rent achievability than the comps imply.
- What's the recent tenant-quality profile in this submarket — average credit score on applications, eviction rate, late-payment / NSF rate, and stable-employment percentage? A property-management company in the area should have these aggregated.
- How much new for-sale + rental construction is in the pipeline within 1–3 miles? Heavy new supply typically softens prices + rents 12–24 months out; constrained supply supports both.
Investment metrics
- 1% rule
- 0.75% ✗
- Cap rate
- 5.22%
- Cash-on-cash
- -3.84%
- DSCR
- 0.83
- GRM
- 11.1
CMA / ARV
No comps found within radius.
Projected returns pro-forma
10.0% appreciation · 3.0% rent growth · sell at horizon
- IRR
- 21.5%
- Equity multiple
- 2.74×
- Total profit
- $73,134
- Equity at exit
- $135,132
- IRR
- 19.4%
- Equity multiple
- 6.29×
- Total profit
- $222,126
- Equity at exit
- $291,417
Cash invested: $42,000 (down + closing). Projections, not guarantees.
Landlord ↔ Tenant lean methodology
- Overall (STATE)
- 43 Moderately Tenant-Leaning
- State Illinois
- 43 Moderately Tenant-Leaning · D+7
- County
- — inherits STATE
- City
- — inherits STATE
ZIP-level market 62240
- Home prices YoY
- 28.1%
- Active inventory
- 5
- Price-to-rent
- 11.1×
Monthly cashflow live
- Estimated rent
- $1,127 medium interval (Pro) →
- Mortgage (P&I)
- −$787
- Tax from tax record
- −$176 /mo · $2,110/yr
- Insurance
- −$62
- HOA
- −$0
- Vacancy / Maint / Mgmt
- −$237
- Net cashflow
- $-135
Break-even live
UW: 25.0% down · 7.5% · 30yr · 1.5% tax · 5.0% vac · 8.0% maint · 8.0% mgmt
Financing live
Cash to close
- Down payment
- $37,500
- Closing costs
- $4,500
- Reserves months
- —
- Total cash needed
- —
Loan-product check · same deal, 3 products live
Conventional
25% down · 7.5% · 30yr
- Down + closing
- —
- Monthly P&I
- —
- Monthly cashflow
- —
- DSCR
- —
- Eligible?
- —
Personal DTI + credit; lowest rate.
DSCR
20% down · 8.5% · 30yr
- Down + closing
- —
- Monthly P&I
- —
- Monthly cashflow
- —
- DSCR
- —
- Eligible?
- —
No personal income docs; deal must DSCR.
Hard money
10% down · 12.0% · 12mo
- Down + closing
- —
- Monthly P&I
- —
- Monthly cashflow
- —
- DSCR
- —
- Eligible?
- —
Short-term bridge; refi at stabilization.
Listing history 6 events
-
2026-06-02status $150,000 Pending 5 DOM
-
2026-06-01days on market $150,000 Active 5 DOM
-
2026-05-31days on market $150,000 Active 4 DOM
-
2026-05-28$160,000 Active
-
2026-05-27historical $160,000
-
2006-03-16soldstatus $15,000
ⓘ Source: listings_history table (triggers on properties + properties_extension) + one-shot
backfill from property_details.listing_events for pre-trigger history.
Tax reassessment forecast IL · Partial reset (capped growth)
- Current annual tax
- $2,110 · $176/mo
- Projected year-2 tax
- $2,757 · $230/mo
- Expected delta
- +$648/yr (+$54/mo · 30.7%)
ⓘ Screening estimate from a state-policy table — verify with the county assessor before closing.
Climate risk First Street
- Flood 1/10 Low FEMA zone X (shaded) · 0% chance over 30 yrs
- Wildfire 1/10 Low
- Heat 5/10 Major 7 d/yr ≥109°F today · 21 d/yr by 30 yrs out
- Wind 2/10 Low 100% chance of damaging wind over 30 yrs
- Air quality 3/10 Moderate 2 unhealthy d/yr today · 3 by 30 yrs out
Nearby sold comps map
Loading sold comps map…
Walkable amenities ~0.75 mi
Loading nearby amenities…
Taxation est. · year 1
- Rental income
- $13,525
- − Mortgage interest
- −$8,402
- − Property taxes
- −$2,110
- − Insurance
- −$750
- − Repairs & maintenance
- −$1,082
- − Management
- −$1,082
- − Depreciation
- −$4,364
- Taxable loss
- −$4,265
- Est. tax savings @ 24.0%
- +$1,024
- After-tax cash flow
- $-591/yr
For passive investors: Depreciation is non-cash, so a rental often shows a tax loss while cash-flowing — sheltering income. Rental losses are passive: they offset passive income freely, and up to $25,000/yr can offset ordinary (W-2) income if you actively participate and your MAGI is under $100k (phasing out to $0 by $150k); unused losses carry forward. On sale, claimed depreciation is recaptured at up to 25%, and gains may owe capital-gains tax (a 1031 exchange can defer both). Figures are a year-1 estimate at your 24.0% rate — not tax advice; consult a CPA.
Schools (NCES district)
- District
- Dupo CUSD 196
- NCES district ID
- 1712720
- Math proficiency
- 7% ▼ -13.00%
- Reading proficiency
- 19% ▼ -15.00%
- Median HH income
- $44,220
- Composite
- 11.52/100
- National rank
- #9701
- State rank
- #543 of 620 in IL
Livability — East Carondelet
- Score
- 67/100
- State rank
- #535
- US rank
- #11119
Category grades
Schools grade is shown separately in the Schools card above.
Census & demographics
- Census place
- East Carondelet, IL
- Population (ZIP)
- 1,994
Population outlook (St. Clair County) Hauer SSP2
- Today (2025)
- 250,366 people
- By 2030
- 240,511 · -3.9%
- By 2040
- 217,391 · -13.2%
- By 2050
- 192,699 · -23.0%
- By 2075
- 140,637 · -43.8%
- By 2100
- 100,499 · -59.9%
Race, ethnicity, and origin ACS 2023
- Neighborhood character
- Predominantly White (96%)
- Race & ethnicity
- White 96% Black 2% Two or more races 1%
- Common ancestry
- Lithuanian 3% Italian 1%
Political lean MEDSL · St. Clair
- 2024 margin
- Lean D (+7.9) · D 53.0% · R 45.1% · Other 1.8%
- 2008→2024 swing
- -14.6pp toward R · 2008: 22.4pp · 2024: 7.9pp
- All cycles
- 2024: D+7.9 2020: D+8.7 2016: D+5.6 2012: D+14.5 2008: D+22.4
Not yet ingested
- Civics
- —
Market trends
- HPI YoY
- ▲ 39.33%
- Current HPI
- 179.31
- Rent YoY
- —
- Metro
- —
- State GDP YoY
- ▲ 1.59%
- F500 in state
- 60
Industry mix (Fortune 500 HQ in IL)
| Industry | F500 HQs | Revenue |
|---|---|---|
| Insurance | 4 | $201B |
|
||
| Consumer Goods | 4 | $87B |
|
||
| Industrial Machinery | 3 | $64B |
|
||
| Healthcare | 2 | $55B |
|
||
| Retail / Pharmacy | 1 | $148B |
|
||
| Agriculture / Food | 1 | $86B |
|
||
Price history
+966.7% since first listed3 events — show timeline
- 2026-05-28 Listed $160,000 MARIS as Distributed by MLS Grid
- 2026-05-27 Coming Soon $160,000 MARIS as Distributed by MLS Grid
- 2006-03-16 Sold (Public Records) $15,000 Public Records
Property tax history
+13.4%/yrLatest (2024): $2,110 · +0.0% YoY. Source: county tax records.
Cash-flow waterfall
monthlySold comps — $/sqft
last 12 mo · ≤1 miLoading sold comps…