 Duplex
406-408 N County Rd Unit 406-408 · Mascoutah, IL
Flood risk 1/10 · Minimal
- FEMA flood zone
- —
- Chance of flooding over 30 yrs
- 0.0%
- Est. flood insurance / yr
- —
Fire risk 1/10 · Minimal
- Est. fire insurance / yr
- $804 – $1,492
Heat risk 5/10 · Moderate
- Hot days now (above 106°F)
- 7 days/yr
- Hot days in 30 yrs
- 21 days/yr
Wind risk 2/10 · Minimal
- Chance of severe wind over 30 yrs
- 1.0%
Air-quality risk 2/10 · Minimal
- Unhealthy air days now
- 0 days/yr
- Unhealthy air days in 30 yrs
- 1 days/yr
Risk factors via First Street. Map © Google.
Why this score? — see what drove the D grade
The composite is a weighted blend of 9 inputs, each scored 0–100. Each bar is that input's sub-score; the figure is the points it added to the 100-point composite (weight × sub-score).
- Cash flow +19.3/30.0
- DSCR +6.1/10.0
- 1% rule +5.1/10.0
- Schools +4.1/10.0
- Livability +3.4/5.0
- Rent growth +2.5/5.0
- Condition / age +2.2/5.0
- ARV discount +0.0/15.0
- Appreciation +0.0/10.0
$245,000
🖨 Deal sheet (PDF) 📄 Offer letter ✓ Due diligence
Multi-family units
County records classify this as Multi-Family (2-4 Unit). Listing-text estimate: 2 units. confirmed
Listing remarks
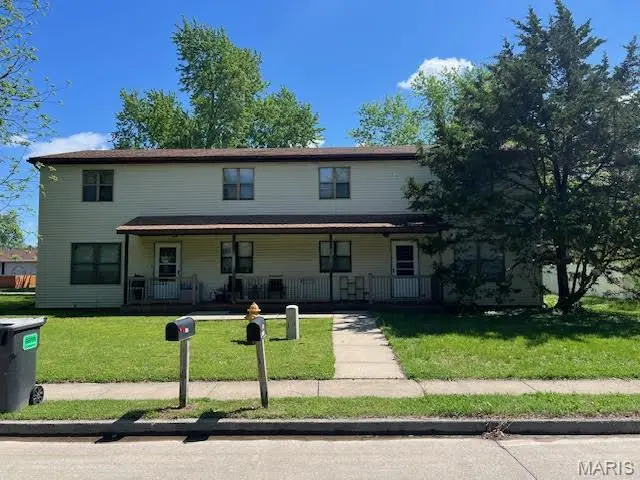
Great Investment opportunity. Fully rented, townhouse-style duplex, with long term tenants, located in the heart of Mascoutah. Professionally managed and well maintained. Seller also owns 2 other duplexes nearby and would like to sell in a package.
Key facts
- Long term tenants
- Well maintained
- Heart of mascoutah
Tags
Property features AI
Finance
- Other: Above-grade finished area reported from public records
- Financial info: Two total units, both currently leased; One building; Gross income reported: $23,625; Net operating income reported: $11,034; Owner pays insurance, management, and taxes
Exterior
- Parking: Off-street parking for 4 vehicles
- Utilities: Public water; Electric service by Ameren; Electricity connected; Sewer connected; Water connected
- Home design: Residential income property (2–4 units); Townhouse style; Two levels; Private ownership
- Construction: Aluminum siding
- Exterior features: Front porch; Concrete road access; City street frontage
Interior
- Bedrooms: No main or upper level bedrooms reported
- Flooring: Carpet
- Bathrooms: No main or upper level bathrooms reported
- Heating & cooling: Forced air heating; Central air conditioning; Ceiling fans
- Interior features: Carpet flooring; Crawl space basement; No fireplace
- Laundry & utility: In-unit laundry
Neighborhood map
What this means for you Summary
Snapshot
- This is a 2 × 2-bed/1-bath units multifamily listed at $245k. Condition is rated fair.
Deal economics
- At list price, monthly cash flow is $271 ($3k/yr) — positive. Per door: $135/mo.
- The deal already cash-flows at list — no discount required.
- Meets the 1% rule at list price ($2k rent vs $245k).
- Recommended offer: $230k (6.0% below list) — sets the bar for market timing.
- Cap rate 7.6% vs local median 3.2% in Mascoutah — top-decile yield for the area; either an underpriced asset or a hidden risk that comps aren't pricing in. Stress-test before assuming the spread holds.
Location & tenants
- Location reads 68/100 on livability (#471 in IL) — a middle-class / working-renter tenant base. Strengths: crime A+, cost of living A+, housing A+; Watch: amenities F, health & safety F.
- Mascoutah CUD 19 (town): math 42% / reading 48% proficiency, ranked #80 of 620 in IL (top 13%) — families likely to look elsewhere, expect single-tenant / working-renter base with shorter leases; only 16% free/reduced lunch — higher-income household profile.
- Zoned schools: Mascoutah Elem School (math 42% / reading 49%, grade D-, #255 of 2,056 statewide, top 13%, 776 students, 0% FRL); Mascoutah Middle School (math 44% / reading 48%, grade D+, #85 of 665 statewide, top 13%, 897 students, 0% FRL); Mascoutah High School (math 39% / reading 46%, grade F, #73 of 693 statewide, top 11%, 1,227 students, 0% FRL) — zoned schools average 0% FRL vs 16% district-wide (16 pts lower); this property's tenant base skews higher-income than the district average.
- Market conditions: 60 active listings in the ZIP; 9 comparable units currently listed for rent nearby; rentals at typical pace (median 17d on market — plan ~3-4 weeks tenant-placement turnaround); solid renter incomes; 783 units permitted in St. Clair County in 2024 (378 in 5+ unit buildings).
- This rent runs 32% of the median local income ($95k/yr) — at the standard rent-burdened threshold; future hikes will face affordability resistance.
Forward outlook
- Local home prices are declining (-3.0%/yr); year-one equity from $2k of loan paydown is wiped out by about $7k of value loss. Plan a longer hold.
- St. Clair County population projected at -23% by 2050 — secular population decline; favor cash flow + early exit over multi-decade hold.
Negotiation context
- It's been on market 65 days — a 6% lower offer ($230k) is reasonable based on typical stale-listing flexibility.
Risks & watch-outs
- Climate carrying-cost: extreme-heat days projected 7→21/yr by 2055 (HVAC capex compounding) — expect insurance premiums to compound above CPI over the hold.
Questions for the listing agent
- It's been on market 65 days. Have you received any prior offers? Is the seller open to a 6% concession, seller financing, or rate buy-down credit?
- Can we see the unit-by-unit rent roll, current vacancy, and any below-market leases? What's the average tenancy length?
- What capital expenditures (roof, boiler, parking lot, exteriors) have been made in the last 5 years, and what's planned in the next 2?
- Have any recent inspections been done? Can we get a copy of the seller's disclosures and any deferred-maintenance estimates?
- Why hasn't it sold? Are there any deal-killer items the seller is aware of (foundation, flood, title, zoning, code violations)?
- Is there a deadline driving the sale (1031 exchange, divorce, estate, relocation)? That informs how much negotiation room exists.
- The area grade is low — what's the realistic commute time and amenity access for the typical tenant pool here? Any planned neighborhood developments (good or bad) we should know about?
- What's the average days-on-market for RENTAL listings here right now (not sales)? A rising rental-DOM trend means longer vacancies and softer asking-rent achievability than the comps imply.
- What's the recent tenant-quality profile in this submarket — average credit score on applications, eviction rate, late-payment / NSF rate, and stable-employment percentage? A property-management company in the area should have these aggregated.
- How much new apartment / multifamily construction is in the pipeline within 1–3 miles? Heavy new supply (>2% of stock underway) typically softens rents 12–24 months out; light construction supports rent growth.
Investment metrics
- 1% rule
- 1.01% ✓
- Cap rate
- 7.62%
- Cash-on-cash
- 4.74%
- DSCR
- 1.21
- GRM
- 8.2
CMA / ARV
- ARV (median comp)
- $184,858
- List price
- $245,000
- Delta
- 32.53%
- Verdict
- OVERPRICED
- Comps
- 2 within 1.0 mi
Projected returns pro-forma
-3.0% appreciation · 3.0% rent growth · sell at horizon
- IRR
- -8.9%
- Equity multiple
- 0.67×
- Total profit
- $-22,416
- Equity at exit
- $36,530
- IRR
- 0.6%
- Equity multiple
- 1.04×
- Total profit
- $2,842
- Equity at exit
- $21,183
Cash invested: $68,600 (down + closing). Projections, not guarantees.
Landlord ↔ Tenant lean methodology
- Overall (STATE)
- 43 Moderately Tenant-Leaning
- State Illinois
- 43 Moderately Tenant-Leaning · D+7
- County
- — inherits STATE
- City
- — inherits STATE
ZIP-level market 62258
- Home prices YoY
- -27.2%
- Active inventory
- 60
- Price-to-rent
- 16.4×
Monthly cashflow live
- Estimated rent
- $2,486 medium interval (Pro) →
- Mortgage (P&I)
- −$1,285
- Tax est. 1.5%
- −$306 /mo · $3,675/yr
- Insurance
- −$102
- HOA
- −$0
- Vacancy / Maint / Mgmt
- −$522
- Net cashflow
- $271
Break-even live
Sensitivity live
| Price | -10% $440 | -5% $355 | +0% $271 | +5% $186 | +10% $101 |
|---|---|---|---|---|---|
| Rent | -10% $74 | -5% $173 | +0% $271 | +5% $369 | +10% $467 |
| Rate | -1.0pp $394 | -0.5pp $333 | base $271 | +0.5pp $207 | +1.0pp $143 |
2-unit breakdown (identical units grouped — click to expand)
| Units | Beds | Baths | Est. rent |
|---|---|---|---|
| 2× units | 2 | 1 | $2,486 |
| #1 | 2 | 1 | $1,243 |
| #2 | 2 | 1 | $1,243 |
| Total (2 units) | $2,486 | ||
UW: 25.0% down · 7.5% · 30yr · 1.5% tax · 5.0% vac · 8.0% maint · 8.0% mgmt
Financing live
Cash to close
- Down payment
- $61,250
- Closing costs
- $7,350
- Reserves months
- —
- Total cash needed
- —
Loan-product check · same deal, 3 products live
Conventional
25% down · 7.5% · 30yr
- Down + closing
- —
- Monthly P&I
- —
- Monthly cashflow
- —
- DSCR
- —
- Eligible?
- —
Personal DTI + credit; lowest rate.
DSCR
20% down · 8.5% · 30yr
- Down + closing
- —
- Monthly P&I
- —
- Monthly cashflow
- —
- DSCR
- —
- Eligible?
- —
No personal income docs; deal must DSCR.
Hard money
10% down · 12.0% · 12mo
- Down + closing
- —
- Monthly P&I
- —
- Monthly cashflow
- —
- DSCR
- —
- Eligible?
- —
Short-term bridge; refi at stabilization.
Rent comps 9 comps
| Address | Beds | Baths | Sqft | Rent | $/sqft | DOM | Units | Dist |
|---|---|---|---|---|---|---|---|---|
| 1215 W Main St Mascoutah, IL | 2.0 | 2.0 | 1475 | $1,695 | $1.15 | 18d | 1 | 0.58mi |
| 1320 McKinley St Mascoutah, IL | 3.0 | 4.0 | 1800 | $1,895 | $1.05 | 0d | 1 | 0.67mi |
| 1416 McKinley St Mascoutah, IL | 2.0 | 2.5 | 1216 | $1,450 | $1.19 | 16d | 1 | 0.67mi |
| 1410 Eisenhower Rd Apt A Mascoutah, IL | 2.0 | 2.0 | 1500 | $1,395 | $0.93 | 12d | 1 | 0.73mi |
| 101 Copper Oaks Ct Mascoutah, IL | 3.0 | 2.5 | 1582 | $2,100 | $1.33 | 19d | 1 | 0.77mi |
| 1963 Nathan Ave Mascoutah, IL | 3.0 | 2.0 | 1200 | $1,650 | $1.38 | 0d | 1 | 0.91mi |
| 1963 Nathan Ave Mascoutah, IL | 3.0 | 3.0 | 1200 | $1,650 | $1.38 | 24d | 1 | 0.91mi |
| 207 E Main St Unit A Mascoutah, IL | 2.0 | 1.0 | 1200 | $975 | $0.81 | 18d | 1 | 1.46mi |
| 122 E State St Mascoutah, IL | 2.0 | 1.0 | 1112 | $1,225 | $1.10 | 0d | 1 | 1.47mi |
Listing history 14 events
-
2026-06-21days on market $245,000 Active 65 DOM
-
2026-06-18days on market $245,000 Active 62 DOM
-
2026-06-17days on market $245,000 Active 61 DOM
-
2026-06-16days on market $245,000 Active 60 DOM
-
2026-06-15days on market $245,000 Active 59 DOM
-
2026-06-13days on market $245,000 Active 57 DOM
-
2026-06-09days on market $245,000 Active 53 DOM
-
2026-06-08days on market $245,000 Active 52 DOM
-
2026-06-07pricedays on market $245,000 Active 51 DOM
-
2026-06-03days on market $275,000 Active 47 DOM
-
2026-06-02days on market $275,000 Active 46 DOM
-
2026-06-01days on market $275,000 Active 45 DOM
-
2026-05-31days on market $275,000 Active 44 DOM
-
2026-04-17$275,000 Active 248-char remark
ⓘ Source: listings_history table (triggers on properties + properties_extension) + one-shot
backfill from property_details.listing_events for pre-trigger history.
Climate risk First Street
- Flood 1/10 Low 0% chance over 30 yrs
- Wildfire 1/10 Low
- Heat 5/10 Major 7 d/yr ≥106°F today · 21 d/yr by 30 yrs out
- Wind 2/10 Low 100% chance of damaging wind over 30 yrs
- Air quality 2/10 Low 0 unhealthy d/yr today · 1 by 30 yrs out
Nearby sold comps map
Loading sold comps map…
Walkable amenities ~0.75 mi
Loading nearby amenities…
Taxation est. · year 1
- Rental income
- $29,832
- − Mortgage interest
- −$13,724
- − Property taxes
- −$3,675
- − Insurance
- −$1,225
- − Repairs & maintenance
- −$2,387
- − Management
- −$2,387
- − Depreciation
- −$7,127
- Taxable loss
- −$692
- Est. tax savings @ 24.0%
- +$166
- After-tax cash flow
- $3,416/yr
For passive investors: Depreciation is non-cash, so a rental often shows a tax loss while cash-flowing — sheltering income. Rental losses are passive: they offset passive income freely, and up to $25,000/yr can offset ordinary (W-2) income if you actively participate and your MAGI is under $100k (phasing out to $0 by $150k); unused losses carry forward. On sale, claimed depreciation is recaptured at up to 25%, and gains may owe capital-gains tax (a 1031 exchange can defer both). Figures are a year-1 estimate at your 24.0% rate — not tax advice; consult a CPA.
Condition & rehab AI · 2 photos
A well-maintained but slightly dated multi-family property with potential for cosmetic updates to enhance its curb appeal and value.
Repairs flagged
- Minor Landscaping — Some areas of the lawn and shrubs could be trimmed and improved for a more polished appearance.
Value-add opportunities
- Both Painting the exterior — Painting the exterior can improve the curb appeal and increase both resale and rental value.
- Both Landscaping improvements — A well-maintained and aesthetically pleasing landscape can enhance the property's curb appeal and attract more tenants or buyers.
Renovation cost estimate screening
| Repair item | Severity | Est. cost |
|---|---|---|
| Landscaping · Some areas of the lawn and shrubs could be trimmed and improved for a more polished appearance. | Minor | $500–3,000 |
| Total estimated repair cost · 1 items | $500–3,000 |
Value-add ROI direction
- Both Painting the exterior — Painting the exterior can improve the curb appeal and increase both resale and rental value. ↑
- Both Landscaping improvements — A well-maintained and aesthetically pleasing landscape can enhance the property's curb appeal and attract more tenants or buyers. ↑
ⓘ Cost ranges are severity-bucket heuristics (US national rule-of-thumb). Get contractor quotes + a written scope before underwriting a rehab budget.
Schools (NCES district)
- District
- Mascoutah CUD 19
- NCES district ID
- 1724940
- Math proficiency
- 42% ▼ -7.00%
- Reading proficiency
- 48% ▼ -11.00%
- Median HH income
- $69,922
- Composite
- 40.52/100
- National rank
- #3708
- State rank
- #80 of 620 in IL
Livability — Mascoutah
- Score
- 68/100
- State rank
- #471
- US rank
- #9746
Category grades
Schools grade is shown separately in the Schools card above.
Census & demographics
- Census place
- Mascoutah, IL
- County
- Saint Clair County · 169,691 people
- City population
- 10,437
- Metro
- St. Louis, MO-IL
- Population (ZIP)
- 10,437
- Household income
- $94,655
- Rent vs Own
- Severe rent burden
- 209.0
Population outlook (St. Clair County) Hauer SSP2
- Today (2025)
- 250,366 people
- By 2030
- 240,511 · -3.9%
- By 2040
- 217,391 · -13.2%
- By 2050
- 192,699 · -23.0%
- By 2075
- 140,637 · -43.8%
- By 2100
- 100,499 · -59.9%
Race, ethnicity, and origin ACS 2023
- Neighborhood character
- Predominantly White (81%)
- Race & ethnicity
- White 81% Two or more races 8% Hispanic / Latino 7% Black 3% Asian 2% Native American 1%
- Hispanic origin (detail)
- Mexican 2%
- Common ancestry
- Romanian 4% Slovak 2% Italian 2%
- Foreign-born
- 3% · Canada
- Languages at home
- 92% English-only · Spanish 4% Tagalog/Filipino 1% Other Asian/Pacific 1%
Political lean MEDSL · St. Clair
- 2024 margin
- Lean D (+7.9) · D 53.0% · R 45.1% · Other 1.8%
- 2008→2024 swing
- -14.6pp toward R · 2008: 22.4pp · 2024: 7.9pp
- All cycles
- 2024: D+7.9 2020: D+8.7 2016: D+5.6 2012: D+14.5 2008: D+22.4
Not yet ingested
- Civics
- —
Market trends
- HPI YoY
- ▼ -68.21%
- Current HPI
- 182.8448
- Rent YoY
- —
- Metro
- St. Louis, MO-IL
- State GDP YoY
- ▲ 1.59%
- F500 in state
- 60
Industry mix (Fortune 500 HQ in IL)
| Industry | F500 HQs | Revenue |
|---|---|---|
| Insurance | 4 | $201B |
|
||
| Consumer Goods | 4 | $87B |
|
||
| Industrial Machinery | 3 | $64B |
|
||
| Healthcare | 2 | $55B |
|
||
| Retail / Pharmacy | 1 | $148B |
|
||
| Agriculture / Food | 1 | $86B |
|
||
Price history
-10.9% since first listed2 events — show timeline
- 2026-06-03 Price Changed $245,000 MARIS as Distributed by MLS Grid
- 2026-04-17 Listed $275,000 MARIS as Distributed by MLS Grid
Cash-flow waterfall
monthlySold comps — $/sqft
last 12 mo · ≤1 miLoading sold comps…