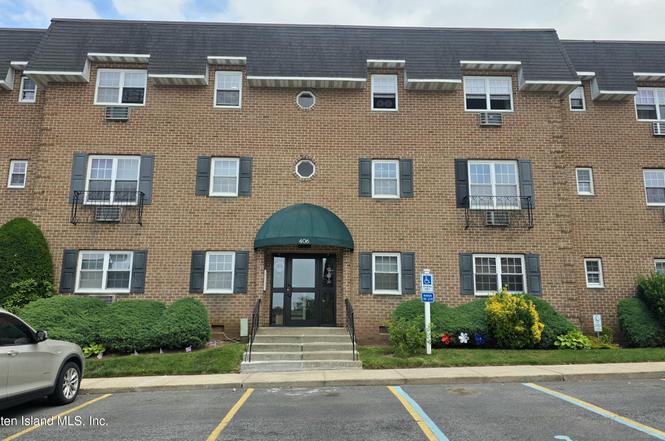
406 Maryland Ave Unit 2d · New York, NY
Flood risk 1/10 · Minimal
- FEMA flood zone
- X (unshaded)
- Chance of flooding over 30 yrs
- 0.0%
- Est. flood insurance / yr
- $507 – $1,088
Fire risk 1/10 · Minimal
- Est. fire insurance / yr
- $691 – $1,283
Heat risk 7/10 · Major
- Hot days now (above 98°F)
- 7 days/yr
- Hot days in 30 yrs
- 16 days/yr
Wind risk 6/10 · Moderate
- Chance of severe wind over 30 yrs
- 65.0%
Air-quality risk 4/10 · Minor
- Unhealthy air days now
- 5 days/yr
- Unhealthy air days in 30 yrs
- 7 days/yr
Risk factors via First Street. Map © Google.
Why this score? — see what drove the F grade
The composite is a weighted blend of 9 inputs, each scored 0–100. Each bar is that input's sub-score; the figure is the points it added to the 100-point composite (weight × sub-score).
- ARV discount +7.5/15.0
- Schools +5.0/10.0
- Rent growth +4.4/5.0
- Livability +3.8/5.0
- 1% rule +3.4/10.0
- Cash flow +2.5/30.0
- Condition / age +2.5/5.0
- DSCR +0.0/10.0
- Appreciation +0.0/10.0
$294,800
🖨 Deal sheet (PDF) 📄 Offer letter ✓ Due diligence
Listing remarks MLS
Welcome home to this large one bedroom co op in a private community '' Chateau Villa Located in a prime location for commuters This unit has a galley kitchen, full bathroom, open layout living room /dining room and hardwood floors throughout Plenty of closets HOA Fee includes community pool, parking spot, taxes, heat, hot water, gas, snow removal, playground, dog park, laundry room facilities.
Key facts
- Dog park
- Galley kitchen
- Community pool
Tags
Property features AI
Finance
- HOA & community: Association: Chateau Villa; Monthly association fee; Association covers taxes, snow removal, exterior maintenance, water and gas
Exterior
- Parking: Assigned parking
- Utilities: 220 volt electric
- Home design: Single-story property; Built approximately in 2023; Brick construction; Property condition: Excellent; Zoned R3-2
- Construction: Brick construction; Built circa 2023; 1 story
- Exterior features: In-ground pool
Interior
- Kitchen: Dishwasher; Refrigerator
- Bedrooms: Bedroom on the first level
- Bathrooms: 1 full bathroom
- Heating & cooling: Natural gas hot water heating; Central air conditioning (units)
- Interior features: Dishwasher; Refrigerator; Central air conditioning; Natural gas hot water heating; Total of 4 rooms
Neighborhood map
What this means for you Summary
Snapshot
- This is a 1-bed/1.0-bath condo listed at $295k.
Deal economics
- At list price, monthly cash flow is $-1k ($-12k/yr) — negative.
- To cash-flow at today's rent, offer at most $147k (50.1% below list).
- To meet the 1% rule (rent ≥ 1% of price), the offer needs to be $249k (15.6% below list).
- Recommended offer: $147k (50.1% below list) — sets the bar for cash-flow.
Location & tenants
- Location reads 75/100 on livability (#268 in NY, #4,188 nationally) — a middle-class / working-renter tenant base. Strengths: amenities A+, commute A+, health & safety A; Watch: crime F, cost of living F.
- Zoned schools: Elm Tree Elementary School (math 27% / reading 52%, grade F, #1,444 of 2,108 statewide, top 71%, 806 students, 94% FRL); Jhs 383 Philippa Schuyler (math 32% / reading 67%, grade C, #280 of 729 statewide, top 40%, 822 students, 85% FRL); Midwood High School (math 94% / reading 96%, grade A+, #83 of 1,100 statewide, top 8%, 4,062 students, 73% FRL).
- Market conditions: Rents rising fast (+7.5%/yr); 255 active listings in the ZIP; 1 comparable units currently listed for rent nearby; solid renter incomes; 480 units permitted in Richmond County in 2024 (22 in 5+ unit buildings).
- This rent runs 36% of the median local income ($83k/yr) — at the standard rent-burdened threshold; future hikes will face affordability resistance.
Forward outlook
- Local home prices are declining (-3.0%/yr); year-one equity from $2k of loan paydown is wiped out by about $9k of value loss. Plan a longer hold.
- Richmond County population projected to shrink 5% by 2050 — rents likely to lag national; underwrite the cash flow, not the appreciation.
Negotiation context
- Only 10 days on market — expect competitive offers; lowballing is unlikely to land.
- 11 sale attempts since 19y ago with the ask held roughly flat each time — persistent listings suggest the price (not the market) is what's stuck; bring a comps-based counter.
Risks & watch-outs
- Watch-outs: HOA is 38% of rent.
- Climate carrying-cost: major wind risk, 65% chance of damaging wind over 30y; extreme-heat days projected 7→16/yr by 2055 (HVAC capex compounding) — expect insurance premiums to compound above CPI over the hold.
Questions for the listing agent
- What do current leases actually rent for vs. the listed asking? Can we see a recent rent roll and the last 12 months of T-12 income?
- Built in 1974 — when were the roof, HVAC, electrical panel, plumbing, and water heater last replaced?
- What does the HOA fee cover, when was the last increase, and are there any pending special assessments or reserve-fund shortfalls?
- Any open or pending special assessments — roof, HVAC, plumbing, elevator, façade? What's the per-unit balance and payoff schedule, and is the seller paying it off at close or rolling it to the buyer?
- Is there a deadline driving the sale (1031 exchange, divorce, estate, relocation)? That informs how much negotiation room exists.
- Schools are B-rated — typically a magnet for longer-tenancy family renters. What's the average tenant stay here, and is there a school-zone premium baked into asking?
- Crime grade is F in this area — have there been break-ins, vandalism, or insurance claims at this property in the last 3 years? What carrier currently insures it and at what premium?
- The area grade is low — what's the realistic commute time and amenity access for the typical tenant pool here? Any planned neighborhood developments (good or bad) we should know about?
- What's the average days-on-market for RENTAL listings here right now (not sales)? A rising rental-DOM trend means longer vacancies and softer asking-rent achievability than the comps imply.
- What's the recent tenant-quality profile in this submarket — average credit score on applications, eviction rate, late-payment / NSF rate, and stable-employment percentage? A property-management company in the area should have these aggregated.
- How much new apartment / multifamily construction is in the pipeline within 1–3 miles? Heavy new supply (>2% of stock underway) typically softens rents 12–24 months out; light construction supports rent growth.
Investment metrics
- 1% rule
- 0.84% ✗
- Cap rate
- 2.14%
- Cash-on-cash
- -14.85%
- DSCR
- 0.34
- GRM
- 9.9
CMA / ARV
No comps found within radius.
Projected returns pro-forma
-3.0% appreciation · 7.5% rent growth · sell at horizon
- IRR
- -36.1%
- Equity multiple
- -0.22×
- Total profit
- $-100,420
- Equity at exit
- $43,956
- IRR
- -20.9%
- Equity multiple
- -0.40×
- Total profit
- $-115,656
- Equity at exit
- $25,489
Cash invested: $82,544 (down + closing). Projections, not guarantees.
Landlord ↔ Tenant lean methodology
- Overall (CITY)
- 0 Strongly Tenant-Friendly
- State New York
- 15 Strongly Tenant-Friendly · D+10
- County
- — inherits STATE
- City New York
- 0 Strongly Tenant-Friendly · D+34
ZIP-level market 10305
- Rents YoY
- 7.5%
- Active inventory
- 255
- Price-to-rent
- 9.9×
Monthly cashflow live
- Estimated rent
- $2,487 medium interval (Pro) →
- Mortgage (P&I)
- −$1,546
- Tax est. 1.5%
- −$368 /mo · $4,422/yr
- Insurance
- −$123
- HOA
- −$949
- Vacancy / Maint / Mgmt
- −$522
- Net cashflow
- $-1,021
Break-even live
Sensitivity live
| Price | -10% $-818 | -5% $-919 | +0% $-1,021 | +5% $-1,123 | +10% $-1,225 |
|---|---|---|---|---|---|
| Rent | -10% $-1,218 | -5% $-1,119 | +0% $-1,021 | +5% $-923 | +10% $-825 |
| Rate | -1.0pp $-873 | -0.5pp $-946 | base $-1,021 | +0.5pp $-1,098 | +1.0pp $-1,175 |
UW: 25.0% down · 7.5% · 30yr · 1.5% tax · 5.0% vac · 8.0% maint · 8.0% mgmt
Financing live
Cash to close
- Down payment
- $73,700
- Closing costs
- $8,844
- Reserves months
- —
- Total cash needed
- —
Loan-product check · same deal, 3 products live
Conventional
25% down · 7.5% · 30yr
- Down + closing
- —
- Monthly P&I
- —
- Monthly cashflow
- —
- DSCR
- —
- Eligible?
- —
Personal DTI + credit; lowest rate.
DSCR
20% down · 8.5% · 30yr
- Down + closing
- —
- Monthly P&I
- —
- Monthly cashflow
- —
- DSCR
- —
- Eligible?
- —
No personal income docs; deal must DSCR.
Hard money
10% down · 12.0% · 12mo
- Down + closing
- —
- Monthly P&I
- —
- Monthly cashflow
- —
- DSCR
- —
- Eligible?
- —
Short-term bridge; refi at stabilization.
Rent comps 1 comps
| Address | Beds | Baths | Sqft | Rent | $/sqft | DOM | Units | Dist |
|---|---|---|---|---|---|---|---|---|
| 17 Old Town Rd Unit 1k Staten Island, NY | 1.0 | 1.0 | 600 | $2,500 | $4.17 | 26d | 1 | 1.24mi |
HOA detail condo
- Monthly dues
- $949 · $11,388/yr
- Likely covers
- watergassnow removalpool
- Assessments
- None detected in remarks — confirm with the listing agent.
Listing history 7 events
-
2026-06-21pricedays on market $294,800 Active 10 DOM
-
2026-06-18days on market $299,900 Active 7 DOM
-
2026-06-17days on market $299,900 Active 6 DOM
-
2026-06-16days on market $299,900 Active 5 DOM
-
2026-06-15days on market $299,900 Active 4 DOM
-
2026-06-13remarks 699-char remark
-
2026-06-13$299,900 Active 2 DOM
ⓘ Source: listings_history table (triggers on properties + properties_extension) + one-shot
backfill from property_details.listing_events for pre-trigger history.
Climate risk First Street
- Flood 1/10 Low FEMA zone X (unshaded) · 0% chance over 30 yrs
- Wildfire 1/10 Low
- Heat 7/10 Severe 7 d/yr ≥98°F today · 16 d/yr by 30 yrs out
- Wind 6/10 Major 65% chance of damaging wind over 30 yrs
- Air quality 4/10 Moderate 5 unhealthy d/yr today · 7 by 30 yrs out
Nearby sold comps map
Loading sold comps map…
Walkable amenities ~0.75 mi
Loading nearby amenities…
Taxation est. · year 1
- Rental income
- $29,849
- − Mortgage interest
- −$16,513
- − Property taxes
- −$4,422
- − Insurance
- −$1,474
- − Repairs & maintenance
- −$2,388
- − Management
- −$2,388
- − HOA
- −$11,388
- − Depreciation
- −$8,576
- Taxable loss
- −$17,300
- Est. tax savings @ 24.0%
- +$4,152
- After-tax cash flow
- $-8,103/yr
For passive investors: Depreciation is non-cash, so a rental often shows a tax loss while cash-flowing — sheltering income. Rental losses are passive: they offset passive income freely, and up to $25,000/yr can offset ordinary (W-2) income if you actively participate and your MAGI is under $100k (phasing out to $0 by $150k); unused losses carry forward. On sale, claimed depreciation is recaptured at up to 25%, and gains may owe capital-gains tax (a 1031 exchange can defer both). Figures are a year-1 estimate at your 24.0% rate — not tax advice; consult a CPA.
Schools (NCES district)
No district data.
Livability — New York
- Score
- 75/100
- State rank
- #268
- US rank
- #4188
Category grades
Schools grade is shown separately in the Schools card above.
Census & demographics
- Census place
- New York, NY
- County
- Richmond County · 404,174 people
- City population
- 7,731,280
- Metro
- New York-Newark-Jersey City, NY-NJ-PA
- Population (ZIP)
- 41,270
- Household income
- $83,413
- Rent vs Own
- Severe rent burden
- 1647.0
Population outlook (Richmond County) Hauer SSP2
- Today (2025)
- 482,784 people
- By 2030
- 481,831 · -0.2%
- By 2040
- 473,159 · -2.0%
- By 2050
- 457,242 · -5.3%
- By 2075
- 408,029 · -15.5%
- By 2100
- 341,459 · -29.3%
Race, ethnicity, and origin ACS 2023
- Neighborhood character
- Diverse neighborhood (Simpson 0.60)
- Race & ethnicity
- White 58% Asian 21% Hispanic / Latino 15% Two or more races 7% Black 3%
- Hispanic origin (detail)
- Mexican 4% Puerto Rican 8%
- Common ancestry
- Scotch-Irish 5% Romanian 4% Subsaharan African 2%
- Foreign-born
- 36% · China, Canada, Jamaica
- Languages at home
- 52% English-only · Chinese 13% Russian/Polish/Slavic 12% Other Indo-European 8%
Political lean MEDSL · Richmond
- 2024 margin
- Strong R (+29.8) · D 35.1% · R 64.9%
- 2008→2024 swing
- -25.7pp toward R · 2008: -4.0pp · 2024: -29.8pp
- All cycles
- 2024: R+29.8 2020: R+14.9 2016: R+16.8 2012: D+0.8 2008: R+4.0
Not yet ingested
- Civics
- —
Market trends
- HPI YoY
- ▼ -487.06%
- Current HPI
- 342.7938
- Rent YoY
- ▲ 7.50%
- Metro
- New York-Newark-Jersey City, NY-NJ-PA
- State GDP YoY
- ▲ 2.60%
- F500 in state
- 92
Industry mix (Fortune 500 HQ in NY)
| Industry | F500 HQs | Revenue |
|---|---|---|
| Financial Services | 10 | $950B |
|
||
| Consumer Goods | 9 | $162B |
|
||
| Insurance | 4 | $225B |
|
||
| Telecommunications | 2 | $144B |
|
||
| Pharmaceuticals | 2 | $112B |
|
||
| Media / Entertainment | 2 | $69B |
|
||
Price history
+67.5% since first listed28 events — show timeline
- 2026-06-11 Listed $299,900 SIBORMLS
- 2024-07-23 Sold (MLS) $265,000 SIBORMLS
- 2024-03-08 Pending — SIBORMLS
- 2024-02-29 Contingent — SIBORMLS
- 2024-02-26 Relisted — SIBORMLS
- 2024-02-06 Contingent — SIBORMLS
- 2024-01-25 Listed $267,000 SIBORMLS
- 2023-07-14 Relisted — SIBORMLS
- 2023-07-14 Listing Removed — SIBORMLS
- 2023-04-28 Contingent — SIBORMLS
- 2023-02-02 Listed $272,500 SIBORMLS
- 2021-07-19 Sold (MLS) $260,000 SIBORMLS
- 2021-03-18 Pending — SIBORMLS
- 2021-03-12 Listing Removed — SIBORMLS
- 2021-03-04 Relisted — SIBORMLS
- 2021-03-04 Listing Removed — SIBORMLS
- 2021-02-04 Listed $265,000 SIBORMLS
- 2018-06-04 Sold (MLS) $235,000 SIBORMLS
- 2018-03-14 Pending — SIBORMLS
- 2018-02-24 Listing Removed — SIBORMLS
- 2018-02-08 Price Changed $239,500 SIBORMLS
- 2018-01-22 Relisted — SIBORMLS
- 2018-01-17 Listing Removed — SIBORMLS
- 2017-12-19 Relisted — SIBORMLS
- 2017-12-03 Listing Removed — SIBORMLS
- 2017-10-24 Listed $245,000 SIBORMLS
- 2007-12-06 Sold (MLS) $160,000 SIBORMLS
- 2007-07-28 Listed $179,000 SIBORMLS
Cash-flow waterfall
monthlySold comps — $/sqft
last 12 mo · ≤1 miLoading sold comps…