 Multi-family
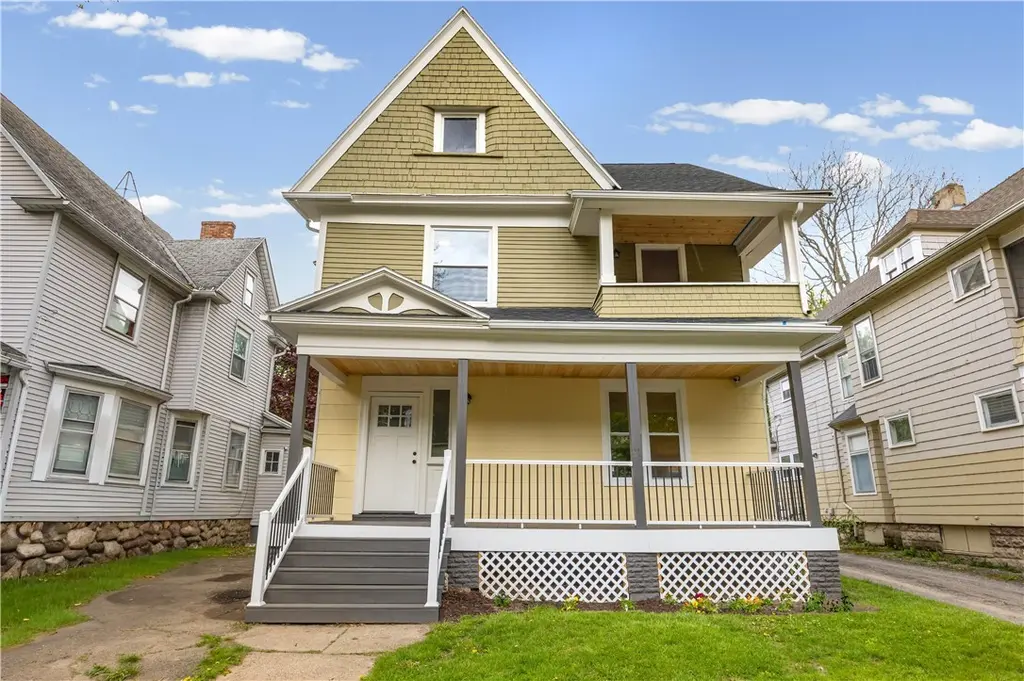
276 Parsells Ave · Rochester, NY
Flood risk 1/10 · Minimal
- FEMA flood zone
- X (unshaded)
- Chance of flooding over 30 yrs
- 0.0%
- Est. flood insurance / yr
- $473 – $860
Fire risk 1/10 · Minimal
- Est. fire insurance / yr
- $691 – $1,283
Heat risk 2/10 · Minimal
- Hot days now (above 95°F)
- 7 days/yr
- Hot days in 30 yrs
- 15 days/yr
Wind risk 1/10 · Minimal
- Chance of severe wind over 30 yrs
- —
Air-quality risk 2/10 · Minimal
- Unhealthy air days now
- 1 days/yr
- Unhealthy air days in 30 yrs
- 2 days/yr
Risk factors via First Street. Map © Google.
Why this score? — see what drove the C grade
The composite is a weighted blend of 9 inputs, each scored 0–100. Each bar is that input's sub-score; the figure is the points it added to the 100-point composite (weight × sub-score).
- Cash flow +25.5/30.0
- DSCR +8.4/10.0
- ARV discount +7.3/15.0
- 1% rule +5.6/10.0
- Rent growth +4.5/5.0
- Livability +3.8/5.0
- Condition / age +2.5/5.0
- Schools +1.9/10.0
- Appreciation +0.0/10.0
$179,900
🖨 Deal sheet (PDF) 📄 Offer letter ✓ Due diligence
Multi-family units
County records classify this as Multi-Family (2-4 Unit). Listing-text estimate: 1 unit. estimate disagrees with records
Listing remarks
This spacious home offers an ideal opportunity for comfortable, modern living. Ideal open-concept layout, where a welcoming foyer provides an immediate sense of home, flowing seamlessly into the expansive living room and formal dining room with a timeless brick accent and bay window. The bright, updated kitchen is a highlight, featuring abundant cabinetry, and a stunning full tile backsplash. Four well-proportioned bedrooms and two beautifully updated full bathrooms. Completing this exceptional turnkey package is the large backyard, offering a perfect space for outdoor enjoyment! Some of the other updates of this home include: New Kitchen Cabinetry; New Vinyl Windows; New Basement Bloc
Key facts
- Formal dining room
- Welcoming foyer
- Bay window
Tags
Property features AI
Finance
- Other: Near public transit; Rectangular residential lot with city street frontage; Lot dimensions 40 x 158
Exterior
- Parking: No garage; Shared driveway
- Utilities: Public water (connected); Sewer connected; Circuit breaker electric service
- Home design: 2 stories; Existing construction
- Construction: Cedar siding; Composite siding; Wood siding; Architectural shingle roof; Shingle roof; Block foundation; Copper and PEX plumbing
- Exterior features: Blacktop driveway; Partial fencing; Fence; Covered porch
Interior
- Kitchen: Microwave
- Bedrooms: 8 total rooms (includes living spaces and laundry)
- Flooring: Hardwood; Luxury vinyl; Varies
- Bathrooms: 2 full bathrooms; 1 main-level bathroom
- Heating & cooling: Gas heating; Forced air heating
- Interior features: Separate formal dining room; Entrance foyer; Eat-in kitchen; Separate formal living room; Natural woodwork; Leaded glass windows; Storm windows; Thermal windows
- Laundry & utility: Laundry in basement; Gas water heater
Neighborhood map
What this means for you Summary
Snapshot
- This is a 4-bed/2.0-bath multifamily listed at $180k.
Deal economics
- At list price, monthly cash flow is $417 ($5k/yr) — positive.
- The deal already cash-flows at list — no discount required.
- Meets the 1% rule at list price ($2k rent vs $180k).
Location & tenants
- Location reads 76/100 on livability (#222 in NY, #3,482 nationally) — a middle-class / working-renter tenant base. Strengths: commute A+, cost of living A+, housing A+; Watch: crime F, employment F.
- Rochester City School District (urban): math 21% / reading 26% proficiency, ranked #589 of 590 in NY (top 100%) — low school quality limits family demand, transient renter base, plan for 1-2y turnover; 82% free/reduced lunch — lower-income household profile, screen leases tightly.
- Zoned schools: School 33-John James Audubon (math 2% / reading 17%, grade F, #2,075 of 2,108 statewide, top 99%, 963 students, 93% FRL); East Lower School (math 2% / reading 22%, grade F, #715 of 729 statewide, top 98%, 304 students, 86% FRL); Edison Career And Technology High School (math 44% / reading 50%, grade D-, #1,007 of 1,100 statewide, top 93%, 1,233 students, 91% FRL).
- Market conditions: Rents rising fast (+7.9%/yr); 200 active listings in the ZIP; 14 comparable units currently listed for rent nearby; rentals at typical pace (median 17d on market — plan ~3-4 weeks tenant-placement turnaround); 1,169 units permitted in Monroe County in 2024 (591 in 5+ unit buildings).
- This rent runs 35% of the median local income ($65k/yr) — at the standard rent-burdened threshold; future hikes will face affordability resistance.
Forward outlook
- Local home prices are declining (-3.0%/yr); year-one equity from $1k of loan paydown is wiped out by about $5k of value loss. Plan a longer hold.
- Monroe County population projected to shrink 6% by 2050 — rents likely to lag national; underwrite the cash flow, not the appreciation.
- At projected returns (-3.0% appreciation + 7.9% rent growth), your $50k cash investment doubles in ~8 years — after that, you're playing with house money.
Negotiation context
- Only 13 days on market — expect competitive offers; lowballing is unlikely to land.
- 5 sale attempts since 16y ago with the ask held roughly flat each time — persistent listings suggest the price (not the market) is what's stuck; bring a comps-based counter.
- Current owner paid $75k; list at $180k implies a 140% gain — meaningful room to come down on a strong offer.
Risks & watch-outs
- Watch-outs: built in 1925 — expect roof / HVAC / electrical / plumbing capex.
Questions for the listing agent
- Built in 1925 — when were the roof, HVAC, electrical panel, plumbing, and water heater last replaced?
- Is there a deadline driving the sale (1031 exchange, divorce, estate, relocation)? That informs how much negotiation room exists.
- Schools are D-rated, which usually means shorter tenancies and higher turnover. Who's the typical renter profile here, and what's been the actual vacancy rate?
- Crime grade is F in this area — have there been break-ins, vandalism, or insurance claims at this property in the last 3 years? What carrier currently insures it and at what premium?
- What's the average days-on-market for RENTAL listings here right now (not sales)? A rising rental-DOM trend means longer vacancies and softer asking-rent achievability than the comps imply.
- What's the recent tenant-quality profile in this submarket — average credit score on applications, eviction rate, late-payment / NSF rate, and stable-employment percentage? A property-management company in the area should have these aggregated.
- How much new apartment / multifamily construction is in the pipeline within 1–3 miles? Heavy new supply (>2% of stock underway) typically softens rents 12–24 months out; light construction supports rent growth.
Investment metrics
- 1% rule
- 1.06% ✓
- Cap rate
- 9.08%
- Cash-on-cash
- 9.94%
- DSCR
- 1.44
- GRM
- 7.9
CMA / ARV
- ARV (median comp)
- $179,101
- List price
- $179,900
- Delta
- 0.45%
- Verdict
- FAIR
- Comps
- 20 within 1.0 mi
Show comp detail 12 sales within ~0.75 mi
| Address | Dist | Beds/Ba | Sqft | Sold | Price | $/sf | Match |
|---|---|---|---|---|---|---|---|
| 125-127 Cedarwood #125 | 0.23mi | 4/2.0 | 2,384 (+7%) | 6mo | $117,000 | $49 | 72 |
| 1286 E Main St | 0.43mi | 5/2.0 (+1) | 2,212 (-1%) | 8mo | $130,000 | $59 | 67 |
| 296 Parsells Ave | 0.03mi | 5/2.0 (+1) | 1,904 (-14%) | 4mo | $133,000 | $70 | 66 |
| 66-68 Ackerman St | 0.31mi | 4/2.5 | 2,390 (+7%) | 8mo | $88,000 | $37 | 64 |
| 3 8th St | 0.54mi | 4/2.0 | 2,113 (-5%) | 15mo | $81,500 | $39 | 54 |
| — | 0.34mi | 5/3.0 (+1) | 1,962 (-12%) | 6mo | $81,000 | $41 | 50 |
| 29 Copeland St | 0.27mi | 4/3.0 | 2,495 (+12%) | 16mo | $85,000 | $34 | 50 |
| 30-32 Salisbury St | 0.47mi | 4/2.0 | 1,968 (-12%) | 18mo | $180,000 | $91 | 44 |
| 154 Breck St | 0.43mi | 4/3.0 | 1,974 (-11%) | 17mo | $210,000 | $106 | 43 |
| 992 Bay St | 0.46mi | 4/2.0 | 1,920 (-14%) | 16mo | $152,000 | $79 | 42 |
| 28 Sodus St | 0.68mi | 4/2.0 | 1,980 (-11%) | 15mo | $301,000 | $152 | 37 |
| 365 Hayward Ave | 0.55mi | 5/3.0 (+1) | 1,990 (-11%) | 15mo | $270,000 | $136 | 35 |
Match score weights: distance 35% · size 25% · config 20% · recency 20%. Top-matched comps best support the ARV.
Projected returns pro-forma
-3.0% appreciation · 7.89% rent growth · sell at horizon
- IRR
- 3.5%
- Equity multiple
- 1.14×
- Total profit
- $7,174
- Equity at exit
- $26,824
- IRR
- 16.9%
- Equity multiple
- 2.68×
- Total profit
- $84,807
- Equity at exit
- $15,554
Cash invested: $50,372 (down + closing). Projections, not guarantees.
Landlord ↔ Tenant lean methodology
- Overall (STATE)
- 15 Strongly Tenant-Friendly
- State New York
- 15 Strongly Tenant-Friendly · D+10
- County
- — inherits STATE
- City
- — inherits STATE
ZIP-level market 14609
- Home prices YoY
- -30.4%
- Rents YoY
- 7.9%
- Active inventory
- 200
- Price-to-rent
- 7.9×
Monthly cashflow live
- Estimated rent
- $1,904 high interval (Pro) →
- Mortgage (P&I)
- −$943
- Tax from tax record
- −$68 /mo · $821/yr
- Insurance
- −$75
- HOA
- −$0
- Lot rent
- −$0
- Vacancy / Maint / Mgmt
- −$400
- Net cashflow
- $417
Break-even live
Sensitivity live
| Price | -10% $519 | -5% $468 | +0% $417 | +5% $366 | +10% $315 |
|---|---|---|---|---|---|
| Rent | -10% $267 | -5% $342 | +0% $417 | +5% $492 | +10% $567 |
| Rate | -1.0pp $508 | -0.5pp $463 | base $417 | +0.5pp $370 | +1.0pp $323 |
UW: 25.0% down · 7.5% · 30yr · 1.5% tax · 5.0% vac · 8.0% maint · 8.0% mgmt
Financing live
Cash to close
- Down payment
- $44,975
- Closing costs
- $5,397
- Reserves months
- —
- Total cash needed
- —
Loan-product check · same deal, 3 products live
Conventional
25% down · 7.5% · 30yr
- Down + closing
- —
- Monthly P&I
- —
- Monthly cashflow
- —
- DSCR
- —
- Eligible?
- —
Personal DTI + credit; lowest rate.
DSCR
20% down · 8.5% · 30yr
- Down + closing
- —
- Monthly P&I
- —
- Monthly cashflow
- —
- DSCR
- —
- Eligible?
- —
No personal income docs; deal must DSCR.
Hard money
10% down · 12.0% · 12mo
- Down + closing
- —
- Monthly P&I
- —
- Monthly cashflow
- —
- DSCR
- —
- Eligible?
- —
Short-term bridge; refi at stabilization.
Rent comps 14 comps
| Address | Beds | Baths | Sqft | Rent | $/sqft | DOM | Units | Dist |
|---|---|---|---|---|---|---|---|---|
| 195 Parsells Ave Rochester, NY | 4.0 | 1.0 | 1413 | $1,265 | $0.90 | 6d | 1 | 0.14mi |
| 126 Parsells Ave Rochester, NY | 3.0 | 1.0 | 1574 | $1,800 | $1.14 | 46d | 1 | 0.24mi |
| 126 Parsells Ave Rochester, NY | 3.0 | 1.0 | 1574 | $1,800 | $1.14 | 24d | 1 | 0.24mi |
| 1786 Clifford Ave Rochester, NY | 3.0 | 1.0 | 2404 | $1,850 | $0.77 | 6d | 1 | 0.71mi |
| 1788 Clifford Ave Rochester, NY | 3.0 | 1.0 | 2404 | $1,850 | $0.77 | 5d | 1 | 0.71mi |
| 733 University Ave #3 Rochester, NY | 3.0 | 1.5 | 1400 | $1,850 | $1.32 | 46d | 1 | 0.97mi |
| 1 Champeney Ter Rochester, NY | 3.0 | 1.0 | 1936 | $1,650 | $0.85 | 17d | 1 | 1.07mi |
| 176 Merwin Ave Rochester, NY | 4.0 | 1.5 | 1750 | $2,200 | $1.26 | 46d | 1 | 1.21mi |
| 207 Lux St Rochester, NY | 4.0 | 1.5 | 1728 | $2,150 | $1.24 | 13d | 1 | 1.27mi |
| 256 Oxford St Unit 1 Rochester, NY | 3.0 | 1.0 | 2050 | $3,000 | $1.46 | 17d | 1 | 1.32mi |
| 1600 East Ave Rochester, NY | 3.0 | 1.0–2.0 | 944 | $2,875 | $3.04 | 5d | 1 | 1.36mi |
| 36 Morningside Park Rochester, NY | 4.0 | 1.0 | 1446 | $2,400 | $1.66 | 6d | 1 | 1.38mi |
| 214 Culver Rd Apt 2 Rochester, NY | 3.0 | 1.0 | 1700 | $2,400 | $1.41 | 17d | 1 | 1.42mi |
| 57 Calumet St Rochester, NY | 3.0 | 3.0 | 2500 | $2,250 | $0.90 | 17d | 1 | 1.46mi |
Listing history 10 events
-
2026-05-13$179,900 Active 967-char remark
-
2024-02-16soldstatus $75,000
-
2023-02-23historical
-
2023-02-03$115,000 Active
-
2022-07-31historical
-
2022-06-10price $129,900
-
2022-04-27$140,000 Active
-
2015-02-03$12,000
-
2010-06-10soldstatus $10,500
-
2010-03-24$14,900
ⓘ Source: listings_history table (triggers on properties + properties_extension) + one-shot
backfill from property_details.listing_events for pre-trigger history.
Tax reassessment forecast NY · Partial reset (capped growth)
- Current annual tax
- $821 · $68/mo
- Projected year-2 tax
- $1,931 · $161/mo
- Expected delta
- +$1,110/yr (+$92/mo · 135.2%)
ⓘ Screening estimate from a state-policy table — verify with the county assessor before closing.
Climate risk First Street
- Flood 1/10 Low FEMA zone X (unshaded) · 0% chance over 30 yrs
- Wildfire 1/10 Low
- Heat 2/10 Low 7 d/yr ≥95°F today · 15 d/yr by 30 yrs out
- Wind 1/10 Low
- Air quality 2/10 Low 1 unhealthy d/yr today · 2 by 30 yrs out
Nearby sold comps map
Loading sold comps map…
Walkable amenities ~0.75 mi
Loading nearby amenities…
Taxation est. · year 1
- Rental income
- $22,844
- − Mortgage interest
- −$10,077
- − Property taxes
- −$821
- − Insurance
- −$900
- − Repairs & maintenance
- −$1,827
- − Management
- −$1,827
- − Depreciation
- −$5,233
- Taxable income
- $2,158
- Est. tax owed @ 24.0%
- −$518
- After-tax cash flow
- $4,487/yr
For passive investors: Depreciation is non-cash, so a rental often shows a tax loss while cash-flowing — sheltering income. Rental losses are passive: they offset passive income freely, and up to $25,000/yr can offset ordinary (W-2) income if you actively participate and your MAGI is under $100k (phasing out to $0 by $150k); unused losses carry forward. On sale, claimed depreciation is recaptured at up to 25%, and gains may owe capital-gains tax (a 1031 exchange can defer both). Figures are a year-1 estimate at your 24.0% rate — not tax advice; consult a CPA.
Schools (NCES district)
- District
- Rochester City School District
- NCES district ID
- 3624750
- Math proficiency
- 21% ▬ 0.00%
- Reading proficiency
- 26% ▲ 4.00%
- Median HH income
- $30,923
- Composite
- 18.98/100
- National rank
- #8850
- State rank
- #589 of 590 in NY
Livability — Rochester
- Score
- 76/100
- State rank
- #222
- US rank
- #3482
Category grades
Schools grade is shown separately in the Schools card above.
Census & demographics
- Census place
- Rochester, NY
- County
- Monroe County · 674,131 people
- City population
- 432,803
- Metro
- Rochester, NY
- Population (ZIP)
- 40,274
- Household income
- $64,603
- Rent vs Own
- Severe rent burden
- 2183.0
Population outlook (Monroe County) Hauer SSP2
- Today (2025)
- 759,460 people
- By 2030
- 757,154 · -0.3%
- By 2040
- 740,644 · -2.5%
- By 2050
- 714,443 · -5.9%
- By 2075
- 645,883 · -15.0%
- By 2100
- 547,084 · -28.0%
Race, ethnicity, and origin ACS 2023
- Neighborhood character
- Diverse neighborhood (Simpson 0.69)
- Race & ethnicity
- White 44% Black 28% Hispanic / Latino 20% Two or more races 10% Asian 2%
- Hispanic origin (detail)
- Puerto Rican 15% Cuban 1% Dominican 1%
- Common ancestry
- Romanian 4% Lithuanian 2% Iranian 1%
- Foreign-born
- 8% · Canada
- Languages at home
- 81% English-only · Spanish 14% Russian/Polish/Slavic 2% Other Indo-European 1%
Political lean MEDSL · Monroe
- 2024 margin
- D (+19.1) · D 59.5% · R 40.5%
- 2008→2024 swing
- +1.4pp toward D · 2008: 17.7pp · 2024: 19.1pp
- All cycles
- 2024: D+19.1 2020: D+21.0 2016: D+14.1 2012: D+17.4 2008: D+17.7
Not yet ingested
- Civics
- —
Market trends
- HPI YoY
- ▼ -143.57%
- Current HPI
- 328.7053
- Rent YoY
- ▲ 7.89%
- Metro
- Rochester, NY
- State GDP YoY
- ▲ 2.60%
- F500 in state
- 92
Industry mix (Fortune 500 HQ in NY)
| Industry | F500 HQs | Revenue |
|---|---|---|
| Financial Services | 10 | $950B |
|
||
| Consumer Goods | 9 | $162B |
|
||
| Insurance | 4 | $225B |
|
||
| Telecommunications | 2 | $144B |
|
||
| Pharmaceuticals | 2 | $112B |
|
||
| Media / Entertainment | 2 | $69B |
|
||
Price history
+1107.4% since first listed12 events — show timeline
- 2026-05-26 Pending — UNYREIS
- 2026-05-21 Contingent — UNYREIS
- 2026-05-13 Listed $179,900 UNYREIS
- 2024-02-16 Sold (Public Records) $75,000 Public Records
- 2023-02-23 Listing Removed — UNYREIS
- 2023-02-03 Listed $115,000 UNYREIS
- 2022-07-31 Listing Removed — UNYREIS
- 2022-06-10 Price Changed $129,900 UNYREIS
- 2022-04-27 Listed $140,000 UNYREIS
- 2015-02-03 Listed $12,000 UNYREIS
- 2010-06-10 Sold (MLS) $10,500 UNYREIS
- 2010-03-24 Listed $14,900 UNYREIS
Property tax history
+0.1%/yrLatest (2025): $821 · -31.2% YoY. Source: county tax records.
Cash-flow waterfall
monthlySold comps — $/sqft
last 12 mo · ≤1 miLoading sold comps…