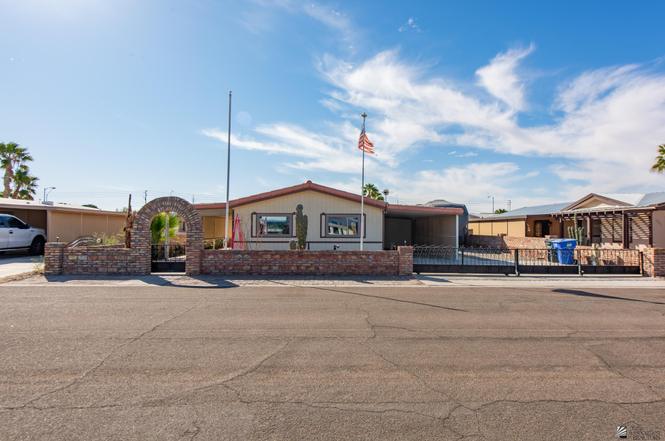
11283 E 39 Pl · Fortuna Foothills, AZ
Flood risk 1/10 · Minimal
- FEMA flood zone
- X (shaded)
- Chance of flooding over 30 yrs
- 0.0%
- Est. flood insurance / yr
- $507 – $1,088
Fire risk 4/10 · Minor
- Est. fire insurance / yr
- $610 – $1,132
Heat risk 9/10 · Severe
- Hot days now (above 114°F)
- 4 days/yr
- Hot days in 30 yrs
- 12 days/yr
Wind risk 1/10 · Minimal
- Chance of severe wind over 30 yrs
- —
Air-quality risk 1/10 · Minimal
- Unhealthy air days now
- 0 days/yr
- Unhealthy air days in 30 yrs
- 0 days/yr
Risk factors via First Street. Map © Google.
Why this score? — see what drove the D grade
The composite is a weighted blend of 9 inputs, each scored 0–100. Each bar is that input's sub-score; the figure is the points it added to the 100-point composite (weight × sub-score).
- Cash flow +16.6/30.0
- ARV discount +6.5/15.0
- DSCR +5.1/10.0
- Rent growth +3.6/5.0
- 1% rule +3.5/10.0
- Livability +3.0/5.0
- Condition / age +2.5/5.0
- Schools +1.3/10.0
- Appreciation +0.0/10.0
$197,777
🖨 Deal sheet (PDF) 📄 Offer letter ✓ Due diligence
Listing remarks
Welcome to this beautifully updated open-floor-plan manufactured home in Yuma East 55+. This well-cared-for 2 bed, 2 bath, 1,045 sq ft home features an updated kitchen and bathroom, dual-pane windows throughout, and cordless shades for a clean, look. Patio and carport sunscreens help keep the home cool and comfortable year-round. Storage is truly exceptional, with three storage sheds—all with electricity and lighting, including one fully insulated with A/C, perfect for a workshop or hobby space. An exterior utility laundry room offers even more storage and flexibility. Bring the RV and toys—there’s plenty of RV parking, a 50-amp RV hookup, and EZ electric vehicle charging.
Key facts
- 6,901 sq ft lot
- Garage
- Built 1986
Property features AI
Finance
- HOA & community: Homeowners association with $33 monthly fee; Located in a 55+ senior community (Yuma East)
Exterior
- Parking: 2 total parking spaces (2 covered); Attached garage; Attached carport with 2 carport spaces; RV access/parking
- Utilities: Public water; Septic tank
- Home design: Residential manufactured home; Single-story
- Construction: Manufactured home construction
- Exterior features: RV hookup; Workshop; Shed(s); Paved road access
Interior
- Kitchen: Dishwasher; Electric range
- Flooring: Laminate flooring; Wood flooring
- Bathrooms: 2 full bathrooms
- Heating & cooling: Has heating; Has cooling
- Interior features: Double pane windows with blinds; Water softener (owned)
Neighborhood map
What this means for you Summary
Snapshot
- This is a 2-bed/2.0-bath manufactured listed at $198k.
Deal economics
- At list price, monthly cash flow is $118 ($1k/yr) — positive.
- The deal already cash-flows at list — no discount required.
- To meet the 1% rule (rent ≥ 1% of price), the offer needs to be $169k (14.7% below list).
- Recommended offer: $169k (14.7% below list) — sets the bar for 1% rule.
- Cap rate 7.0% vs local median 4.2% in Fortuna Foothills — top-decile yield for the area; either an underpriced asset or a hidden risk that comps aren't pricing in. Stress-test before assuming the spread holds.
Location & tenants
- Location reads 60/100 on livability (#174 in AZ) — a middle-class / working-renter tenant base. Strengths: cost of living A+, housing A+; Watch: employment C-, crime F, amenities F.
- Yuma Union High School District (4507) (urban): math 14% / reading 16% proficiency, ranked #212 of 249 in AZ (top 85%) — low school quality limits family demand, transient renter base, plan for 1-2y turnover.
- Zoned schools: Gila Ridge High School (math 13% / reading 17%, grade F, #263 of 381 statewide, top 70%, 2,309 students, 55% FRL).
- Market conditions: Rents rising fast (+4.5%/yr); 415 active listings in the ZIP; 12 comparable units currently listed for rent nearby; rentals at typical pace (median 15d on market — plan ~3-4 weeks tenant-placement turnaround); 1,399 units permitted in Yuma County in 2024 (180 in 5+ unit buildings).
- This rent runs 35% of the median local income ($58k/yr) — at the standard rent-burdened threshold; future hikes will face affordability resistance.
Forward outlook
- Local home prices are declining (-3.0%/yr); year-one equity from $1k of loan paydown is wiped out by about $6k of value loss. Plan a longer hold.
- Yuma County population projected at +4% by 2050 — modest demand growth; plan on rents tracking national, not racing it.
Negotiation context
- It's been on market 131 days — a 12% lower offer ($174k) is reasonable based on typical stale-listing flexibility.
- Current owner paid $70k; list at $198k implies a 183% gain — meaningful room to come down on a strong offer.
Risks & watch-outs
- Climate carrying-cost: extreme-heat days projected 4→12/yr by 2055 (HVAC capex compounding) — expect insurance premiums to compound above CPI over the hold.
Questions for the listing agent
- It's been on market 131 days. Have you received any prior offers? Is the seller open to a 15% concession, seller financing, or rate buy-down credit?
- What does the HOA fee cover, when was the last increase, and are there any pending special assessments or reserve-fund shortfalls?
- Why hasn't it sold? Are there any deal-killer items the seller is aware of (foundation, flood, title, zoning, code violations)?
- Is there a deadline driving the sale (1031 exchange, divorce, estate, relocation)? That informs how much negotiation room exists.
- Schools are F-rated, which usually means shorter tenancies and higher turnover. Who's the typical renter profile here, and what's been the actual vacancy rate?
- Crime grade is F in this area — have there been break-ins, vandalism, or insurance claims at this property in the last 3 years? What carrier currently insures it and at what premium?
- The area grade is low — what's the realistic commute time and amenity access for the typical tenant pool here? Any planned neighborhood developments (good or bad) we should know about?
- What's the average days-on-market for RENTAL listings here right now (not sales)? A rising rental-DOM trend means longer vacancies and softer asking-rent achievability than the comps imply.
- What's the recent tenant-quality profile in this submarket — average credit score on applications, eviction rate, late-payment / NSF rate, and stable-employment percentage? A property-management company in the area should have these aggregated.
- How much new for-sale + rental construction is in the pipeline within 1–3 miles? Heavy new supply typically softens prices + rents 12–24 months out; constrained supply supports both.
Investment metrics
- 1% rule
- 0.85% ✗
- Cap rate
- 7.01%
- Cash-on-cash
- 2.57%
- DSCR
- 1.11
- GRM
- 9.8
CMA / ARV
- ARV (on-the-fly)
- $193,325
- Comps found
- 12
Show comp detail 12 sales within ~0.75 mi
| Address | Dist | Beds/Ba | Sqft | Sold | Price | $/sf | Match |
|---|---|---|---|---|---|---|---|
| 11238 E 39 Ln | 0.06mi | 2/2.0 | 1,076 (+3%) | 1mo | $210,000 | $195 | 92 |
| 11423 E 39 St | 0.18mi | 2/2.0 | 1,056 (+1%) | 2mo | $214,900 | $204 | 88 |
| 11413 E 39 Pl | 0.16mi | 2/2.0 | 1,045 (0%) | 7mo | $193,000 | $185 | 87 |
| 11436 E 36 Pl | 0.46mi | 2/2.0 | 1,045 (0%) | 2mo | $157,500 | $151 | 76 |
| 11229 E 39 Ln | 0.08mi | 2/2.0 | 1,152 (+10%) | 8mo | $208,000 | $181 | 73 |
| 11295 E 35 St | 0.54mi | 2/2.0 | 1,056 (+1%) | 1mo | $195,000 | $185 | 72 |
| 11391 E 38 Pl | 0.20mi | 2/2.0 | 1,152 (+10%) | 6mo | $192,000 | $167 | 69 |
| 11427 E 36 Pl | 0.43mi | 2/2.0 | 924 (-12%) | 1mo | $154,000 | $167 | 60 |
| 11323 E 35 St | 0.55mi | 2/2.0 | 960 (-8%) | 9mo | $199,900 | $208 | 53 |
| 11399 E 36 St | 0.46mi | 2/2.0 | 896 (-14%) | 3mo | $185,000 | $206 | 52 |
| 11414 E 34 Pl | 0.64mi | 2/2.0 | 1,152 (+10%) | 2mo | $175,000 | $152 | 51 |
| 11443 E 34 St | 0.68mi | 2/2.0 | 1,152 (+10%) | 2mo | $233,500 | $203 | 49 |
Match score weights: distance 35% · size 25% · config 20% · recency 20%. Top-matched comps best support the ARV.
Projected returns pro-forma
-3.0% appreciation · 4.46% rent growth · sell at horizon
- IRR
- -10.8%
- Equity multiple
- 0.60×
- Total profit
- $-22,060
- Equity at exit
- $29,489
- IRR
- 0.2%
- Equity multiple
- 1.02×
- Total profit
- $860
- Equity at exit
- $17,100
Cash invested: $55,378 (down + closing). Projections, not guarantees.
Landlord ↔ Tenant lean methodology
- Overall (STATE)
- 87 Strongly Landlord-Friendly
- State Arizona
- 87 Strongly Landlord-Friendly · R+3
- County
- — inherits STATE
- City
- — inherits STATE
ZIP-level market 85367
- Home prices YoY
- -26.2%
- Rents YoY
- 4.5%
- Active inventory
- 415
- Price-to-rent
- 9.8×
Monthly cashflow live
- Estimated rent
- $1,688 high interval (Pro) →
- Mortgage (P&I)
- −$1,037
- Tax from tax record
- −$62 /mo · $749/yr
- Insurance
- −$82
- HOA
- −$33
- Vacancy / Maint / Mgmt
- −$354
- Net cashflow
- $118
Break-even live
Sensitivity live
| Price | -10% $230 | -5% $174 | +0% $118 | +5% $62 | +10% $6 |
|---|---|---|---|---|---|
| Rent | -10% $-15 | -5% $52 | +0% $118 | +5% $185 | +10% $252 |
| Rate | -1.0pp $218 | -0.5pp $169 | base $118 | +0.5pp $67 | +1.0pp $15 |
UW: 25.0% down · 7.5% · 30yr · 1.5% tax · 5.0% vac · 8.0% maint · 8.0% mgmt
Financing live
Cash to close
- Down payment
- $49,444
- Closing costs
- $5,933
- Reserves months
- —
- Total cash needed
- —
Loan-product check · same deal, 3 products live
Conventional
25% down · 7.5% · 30yr
- Down + closing
- —
- Monthly P&I
- —
- Monthly cashflow
- —
- DSCR
- —
- Eligible?
- —
Personal DTI + credit; lowest rate.
DSCR
20% down · 8.5% · 30yr
- Down + closing
- —
- Monthly P&I
- —
- Monthly cashflow
- —
- DSCR
- —
- Eligible?
- —
No personal income docs; deal must DSCR.
Hard money
10% down · 12.0% · 12mo
- Down + closing
- —
- Monthly P&I
- —
- Monthly cashflow
- —
- DSCR
- —
- Eligible?
- —
Short-term bridge; refi at stabilization.
Rent comps 12 comps
| Address | Beds | Baths | Sqft | Rent | $/sqft | DOM | Units | Dist |
|---|---|---|---|---|---|---|---|---|
| 11381 S Kingman Ave Yuma, AZ | 3.0 | 2.0 | 1247 | $1,650 | $1.32 | 15d | 1 | 0.69mi |
| 11367 S Kingman Ave Yuma, AZ | 2.0 | 2.0 | 1200 | $1,495 | $1.25 | 15d | 1 | 0.71mi |
| 11623 E 33rd Way Yuma, AZ | 3.0 | 2.0 | 1386 | $1,795 | $1.30 | 15d | 1 | 0.77mi |
| 12627 S Prescott Rd Yuma, AZ | 3.0 | 2.0 | 1168 | $1,500 | $1.28 | 15d | 1 | 0.78mi |
| 11525 S Chaparral Dr Yuma, AZ | 2.0 | 2.0 | 1102 | $1,700 | $1.54 | 15d | 1 | 0.86mi |
| 12255 E 37th St Yuma, AZ | 2.0 | 2.0 | 967 | $1,600 | $1.65 | 15d | 1 | 0.97mi |
| 11649 E 33rd Pl Yuma, AZ | 3.0 | 2.0 | 1300 | $1,700 | $1.31 | 15d | 1 | 1.10mi |
| 10164 E 39th St Yuma, AZ | 3.0 | 2.0 | 1498 | $1,800 | $1.20 | 15d | 1 | 1.14mi |
| 10155 E 35th St Yuma, AZ | 3.0 | 2.0 | 1460 | $1,750 | $1.20 | 15d | 1 | 1.26mi |
| 10736 S Calle Raquel Yuma, AZ | 3.0 | 2.5 | 1308 | $1,600 | $1.22 | 15d | 1 | 1.31mi |
| 10685 S Calle Raquel Yuma, AZ | 3.0 | 2.5 | 1190 | $2,500 | $2.10 | 15d | 1 | 1.39mi |
| 12443 E Brenda Dr Yuma, AZ | 2.0 | 2.0 | 914 | $1,400 | $1.53 | 15d | 1 | 1.41mi |
HOA detail
- Monthly dues
- $33 · $396/yr
- Likely covers
- electric
Listing history 22 events
-
2026-06-21days on market $197,777 Active 131 DOM
-
2026-06-19days on market $197,777 Active 129 DOM
-
2026-06-18days on market $197,777 Active 128 DOM
-
2026-06-17days on market $197,777 Active 127 DOM
-
2026-06-16days on market $197,777 Active 126 DOM
-
2026-06-15days on market $197,777 Active 125 DOM
-
2026-06-14days on market $197,777 Active 123 DOM
-
2026-06-13days on market $197,777 Active 122 DOM
-
2026-06-10days on market $197,777 Active 120 DOM
-
2026-06-09days on market $197,777 Active 119 DOM
-
2026-06-08days on market $197,777 Active 118 DOM
-
2026-06-07days on market $197,777 Active 117 DOM
-
2026-06-05days on market $197,777 Active 114 DOM
-
2026-06-02days on market $197,777 Active 112 DOM
-
2026-06-01days on market $197,777 Active 111 DOM
-
2026-05-31days on market $197,777 Active 110 DOM
-
2026-05-30days on market $197,777 Active 109 DOM
-
2026-02-10$197,777 Active
-
2016-01-15soldstatus $70,000
-
2000-04-25soldstatus $73,000
-
1993-11-10soldstatus $55,000
-
1986-04-16soldstatus $13,200
ⓘ Source: listings_history table (triggers on properties + properties_extension) + one-shot
backfill from property_details.listing_events for pre-trigger history.
Tax reassessment forecast AZ · Resets to sale price
- Current annual tax
- $749 · $62/mo
- Projected year-2 tax
- $1,305 · $109/mo
- Expected delta
- +$556/yr (+$46/mo · 74.2%)
ⓘ Screening estimate from a state-policy table — verify with the county assessor before closing.
Climate risk First Street
- Flood 1/10 Low FEMA zone X (shaded) · 0% chance over 30 yrs
- Wildfire 4/10 Moderate
- Heat 9/10 Extreme 4 d/yr ≥114°F today · 12 d/yr by 30 yrs out
- Wind 1/10 Low
- Air quality 1/10 Low 0 unhealthy d/yr today · 0 by 30 yrs out
Nearby sold comps map
Loading sold comps map…
Walkable amenities ~0.75 mi
Loading nearby amenities…
Taxation est. · year 1
- Rental income
- $20,254
- − Mortgage interest
- −$11,079
- − Property taxes
- −$749
- − Insurance
- −$989
- − Repairs & maintenance
- −$1,620
- − Management
- −$1,620
- − HOA
- −$396
- − Depreciation
- −$5,754
- Taxable loss
- −$1,953
- Est. tax savings @ 24.0%
- +$469
- After-tax cash flow
- $1,889/yr
For passive investors: Depreciation is non-cash, so a rental often shows a tax loss while cash-flowing — sheltering income. Rental losses are passive: they offset passive income freely, and up to $25,000/yr can offset ordinary (W-2) income if you actively participate and your MAGI is under $100k (phasing out to $0 by $150k); unused losses carry forward. On sale, claimed depreciation is recaptured at up to 25%, and gains may owe capital-gains tax (a 1031 exchange can defer both). Figures are a year-1 estimate at your 24.0% rate — not tax advice; consult a CPA.
Schools (NCES district)
- District
- Yuma Union High School District (4507)
- NCES district ID
- 0409630
- Math proficiency
- 14% ▼ -12.00%
- Reading proficiency
- 16% ▼ -10.00%
- Median HH income
- $40,512
- Composite
- 12.86/100
- National rank
- #9592
- State rank
- #212 of 249 in AZ
Livability — Fortuna Foothills
- Score
- 60/100
- State rank
- #174
- US rank
- #18663
Category grades
Schools grade is shown separately in the Schools card above.
Census & demographics
- Census place
- Fortuna Foothills, AZ
- County
- Yuma County · 149,809 people
- City population
- 21,356
- Metro
- Yuma, AZ
- Population (ZIP)
- 22,074
- Household income
- $58,469
- Rent vs Own
- Severe rent burden
- 408.0
Population outlook (Yuma County) Hauer SSP2
- Today (2025)
- 211,633 people
- By 2030
- 214,114 · +1.2%
- By 2040
- 217,856 · +2.9%
- By 2050
- 220,276 · +4.1%
- By 2075
- 222,359 · +5.1%
- By 2100
- 198,880 · -6.0%
Race, ethnicity, and origin ACS 2023
- Neighborhood character
- Predominantly White (71%)
- Race & ethnicity
- White 71% Hispanic / Latino 22% Two or more races 11% Black 3%
- Hispanic origin (detail)
- Mexican 20%
- Common ancestry
- Portuguese 4% Lithuanian 2% Italian 2%
- Foreign-born
- 10% · Canada
- Languages at home
- 81% English-only · Spanish 16% French/Haitian/Cajun 1% German/W. Germanic 1%
Political lean MEDSL · Yuma
- 2024 margin
- Strong R (+20.4) · D 39.3% · R 59.8%
- 2008→2024 swing
- -6.6pp toward R · 2008: -13.8pp · 2024: -20.4pp
- All cycles
- 2024: R+20.4 2020: R+6.2 2016: R+5.5 2012: R+16.1 2008: R+13.8
Not yet ingested
- Civics
- —
Market trends
- HPI YoY
- ▼ -80.81%
- Current HPI
- 227.2692
- Rent YoY
- ▲ 4.46%
- Metro
- Yuma, AZ
- State GDP YoY
- ▲ 4.54%
- F500 in state
- 20
Industry mix (Fortune 500 HQ in AZ)
| Industry | F500 HQs | Revenue |
|---|---|---|
| Technology | 2 | $13B |
|
||
| Mining / Metals | 1 | $23B |
|
||
| Environmental Services | 1 | $16B |
|
||
| Metals / Steel | 1 | $14B |
|
||
| Technology Distribution | 1 | $9B |
|
||
| Homebuilding | 1 | $8B |
|
||
Price history
+1398.3% since first listed5 events — show timeline
- 2026-02-10 Listed $197,777 YAR
- 2016-01-15 Sold (Public Records) $70,000 Public Records
- 2000-04-25 Sold (Public Records) $73,000 Public Records
- 1993-11-10 Sold (Public Records) $55,000 Public Records
- 1986-04-16 Sold (Public Records) $13,200 Public Records
Property tax history
+1.3%/yrLatest (2025): $749 · +2.4% YoY. Source: county tax records.
Cash-flow waterfall
monthlySold comps — $/sqft
last 12 mo · ≤1 miLoading sold comps…