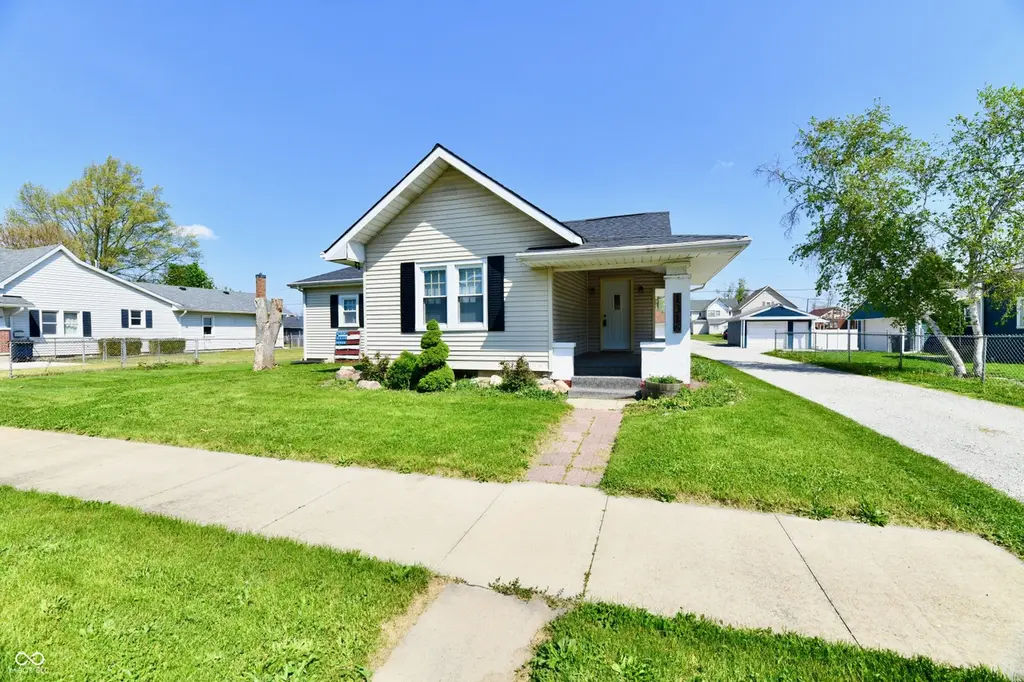
1316 S E St · Elwood, IN
Flood risk 1/10 · Minimal
- FEMA flood zone
- X (unshaded)
- Chance of flooding over 30 yrs
- 0.0%
- Est. flood insurance / yr
- $473 – $860
Fire risk 1/10 · Minimal
- Est. fire insurance / yr
- $717 – $1,331
Heat risk 3/10 · Minor
- Hot days now (above 102°F)
- 7 days/yr
- Hot days in 30 yrs
- 18 days/yr
Wind risk 2/10 · Minimal
- Chance of severe wind over 30 yrs
- —
Air-quality risk 4/10 · Minor
- Unhealthy air days now
- 3 days/yr
- Unhealthy air days in 30 yrs
- 5 days/yr
Risk factors via First Street. Map © Google.
Why this score? — see what drove the C+ grade
The composite is a weighted blend of 9 inputs, each scored 0–100. Each bar is that input's sub-score; the figure is the points it added to the 100-point composite (weight × sub-score).
- Cash flow +24.7/30.0
- ARV discount +14.0/15.0
- DSCR +8.0/10.0
- 1% rule +5.4/10.0
- Livability +3.1/5.0
- Rent growth +2.5/5.0
- Condition / age +2.5/5.0
- Schools +1.6/10.0
- Appreciation +0.0/10.0
$120,000
🖨 Deal sheet 📄 Offer letter ✓ Due diligence
Listing remarks MLS
Spacious 3 beds,2 baths single family home awaits you! 1 Level home with open floor plan, large Bedrooms. Hardwood floor. Living area. 1 Car detached garage. This is a Fannie Mae HomePath property. Don't miss this wonderful opportunity!!
Key facts
- Den office space
- Large parking pad
- Separate dining room
Tags
Neighborhood map
What this means for you Summary
Snapshot
- This is a 2-bed/1.0-bath single-family listed at $120k.
Deal economics
- At list price, monthly cash flow is $250 ($3k/yr) — positive.
- The deal already cash-flows at list — no discount required.
- Meets the 1% rule at list price ($1k rent vs $120k).
- Cap rate 8.8% vs local median 5.3% in Elwood — top-decile yield for the area; either an underpriced asset or a hidden risk that comps aren't pricing in. Stress-test before assuming the spread holds.
Location & tenants
- Location reads 62/100 on livability (#482 in IN) — a middle-class / working-renter tenant base. Strengths: crime A+, cost of living A+, housing A+; Watch: schools F, amenities F, commute F.
- Elwood Community School Corporation (town): math 18% / reading 19% proficiency, ranked #283 of 301 in IN (top 94%) — low school quality limits family demand, transient renter base, plan for 1-2y turnover.
- Market conditions: 100 active listings in the ZIP; 10 comparable units currently listed for rent nearby; rentals leasing fast (median 2d on market — plan ~1-2 weeks tenant-placement turnaround); 184 units permitted in Madison County in 2024 (0 in 5+ unit buildings).
Forward outlook
- Local home prices are declining (-3.0%/yr); year-one equity from $830 of loan paydown is wiped out by about $4k of value loss. Plan a longer hold.
- Madison County population projected at -14% by 2050 — secular population decline; favor cash flow + early exit over multi-decade hold.
Negotiation context
- Only 8 days on market — expect competitive offers; lowballing is unlikely to land.
- 3 sale attempts since 26y ago with the ask held roughly flat each time — persistent listings suggest the price (not the market) is what's stuck; bring a comps-based counter.
- Current owner paid $15k; list at $120k implies a 700% gain — meaningful room to come down on a strong offer.
Risks & watch-outs
- Watch-outs: built in 1900 — expect roof / HVAC / electrical / plumbing capex.
Questions for the listing agent
- Built in 1900 — when were the roof, HVAC, electrical panel, plumbing, and water heater last replaced?
- Is there a deadline driving the sale (1031 exchange, divorce, estate, relocation)? That informs how much negotiation room exists.
- Schools are F-rated, which usually means shorter tenancies and higher turnover. Who's the typical renter profile here, and what's been the actual vacancy rate?
- What's the average days-on-market for RENTAL listings here right now (not sales)? A rising rental-DOM trend means longer vacancies and softer asking-rent achievability than the comps imply.
- What's the recent tenant-quality profile in this submarket — average credit score on applications, eviction rate, late-payment / NSF rate, and stable-employment percentage? A property-management company in the area should have these aggregated.
- How much new for-sale + rental construction is in the pipeline within 1–3 miles? Heavy new supply typically softens prices + rents 12–24 months out; constrained supply supports both.
Investment metrics
- 1% rule
- 1.04% ✓
- Cap rate
- 8.79%
- Cash-on-cash
- 8.91%
- DSCR
- 1.40
- GRM
- 8.0
CMA / ARV
- ARV (on-the-fly)
- $140,160
- Comps found
- 12
Show comp detail 12 sales within ~0.75 mi
| Address | Dist | Beds/Ba | Sqft | Sold | Price | $/sf | Match |
|---|---|---|---|---|---|---|---|
| 1616 S I St | 0.35mi | 2/1.0 | 1,404 (-4%) | 0mo | $165,000 | $118 | 77 |
| 820 S B St | 0.37mi | 2/1.5 | 1,387 (-5%) | 1mo | $150,000 | $108 | 72 |
| 805 S 17th St | 0.31mi | 3/1.0 (+1) | 1,392 (-5%) | 4mo | $60,000 | $43 | 70 |
| 1609 S G St | 0.27mi | 3/1.0 (+1) | 1,348 (-8%) | 0mo | $166,900 | $124 | 69 |
| 727 N A St | 0.53mi | 2/1.5 | 1,430 (-2%) | 1mo | $105,000 | $73 | 69 |
| 1017 S A St | 0.28mi | 3/1.0 (+1) | 1,574 (+8%) | 3mo | $109,900 | $70 | 67 |
| 2024 N B St | 0.71mi | 2/1.0 | 1,456 (-0%) | 0mo | $94,000 | $65 | 66 |
| 418 N 14th St | 0.53mi | 3/1.0 (+1) | 1,383 (-5%) | 2mo | $154,500 | $112 | 60 |
| 1301 S J St | 0.36mi | 3/1.0 (+1) | 1,292 (-12%) | 1mo | $39,000 | $30 | 58 |
| 1914 S L St | 0.62mi | 2/1.0 | 1,616 (+11%) | 0mo | $43,000 | $27 | 53 |
| 2304 S D St | 0.69mi | 3/1.0 (+1) | 1,336 (-8%) | 1mo | $164,900 | $123 | 48 |
| 500 S 22nd St | 0.61mi | 2/1.0 | 1,250 (-14%) | 3mo | $120,000 | $96 | 45 |
Match score weights: distance 35% · size 25% · config 20% · recency 20%. Top-matched comps best support the ARV.
Projected returns pro-forma
-3.0% appreciation · 3.0% rent growth · sell at horizon
- IRR
- -2.8%
- Equity multiple
- 0.89×
- Total profit
- $-3,586
- Equity at exit
- $17,892
- IRR
- 6.8%
- Equity multiple
- 1.51×
- Total profit
- $17,189
- Equity at exit
- $10,375
Cash invested: $33,600 (down + closing). Projections, not guarantees.
Landlord ↔ Tenant lean methodology
- Overall (STATE)
- 90 Strongly Landlord-Friendly
- State Indiana
- 90 Strongly Landlord-Friendly · R+11
- County
- — inherits STATE
- City
- — inherits STATE
ZIP-level market 46036
- Home prices YoY
- -18.3%
- Active inventory
- 100
- Price-to-rent
- 8.0×
Monthly cashflow live
- Estimated rent
- $1,246 high interval (Pro) →
- Mortgage (P&I)
- −$629
- Tax from tax record
- −$55 /mo · $662/yr
- Insurance
- −$50
- HOA
- −$0
- Vacancy / Maint / Mgmt
- −$262
- Net cashflow
- $250
Break-even live
UW: 25.0% down · 7.5% · 30yr · 1.5% tax · 5.0% vac · 8.0% maint · 8.0% mgmt
Financing live
Cash to close
- Down payment
- $30,000
- Closing costs
- $3,600
- Reserves months
- —
- Total cash needed
- —
Loan-product check · same deal, 3 products live
Conventional
25% down · 7.5% · 30yr
- Down + closing
- —
- Monthly P&I
- —
- Monthly cashflow
- —
- DSCR
- —
- Eligible?
- —
Personal DTI + credit; lowest rate.
DSCR
20% down · 8.5% · 30yr
- Down + closing
- —
- Monthly P&I
- —
- Monthly cashflow
- —
- DSCR
- —
- Eligible?
- —
No personal income docs; deal must DSCR.
Hard money
10% down · 12.0% · 12mo
- Down + closing
- —
- Monthly P&I
- —
- Monthly cashflow
- —
- DSCR
- —
- Eligible?
- —
Short-term bridge; refi at stabilization.
Rent comps 10 comps
| Address | Beds | Baths | Sqft | Rent | $/sqft | DOM | Units | Dist |
|---|---|---|---|---|---|---|---|---|
| 1349 S B St Unit 4 Elwood, IN | 2.0 | 1.0 | 950 | $1,400 | $1.47 | 12d | 1 | 0.13mi |
| 1325 S G St Elwood, IN | 3.0 | 1.0 | 1504 | $1,200 | $0.80 | 1d | 1 | 0.17mi |
| 209 S 16th St Elwood, IN | 2.0 | 2.0 | 1060 | $1,135 | $1.07 | 1d | 1 | 0.29mi |
| 1636 S B St Elwood, IN | 3.0 | 2.0 | 1403 | $1,300 | $0.93 | 43d | 1 | 0.33mi |
| 1775 Antler Ct Elwood, IN | 2.0 | 1.0 | 1000 | $935 | $0.94 | 1d | 1 | 0.82mi |
| 9401 Frans Way Elwood, IN | 1.0–2.0 | 1.0–2.0 | 815 | $1,325 | $1.63 | 1d | 6 | 0.92mi |
| 1019 N 9th St Elwood, IN | 3.0 | 2.5 | 1762 | $1,750 | $0.99 | 1d | 1 | 0.97mi |
| 1021 N 9th St Elwood, IN | 3.0 | 2.5 | 1725 | $1,750 | $1.01 | 1d | 1 | 0.97mi |
| 1023 N 9th St Elwood, IN | 3.0 | 2.5 | 1762 | $1,750 | $0.99 | 14d | 1 | 0.97mi |
| 1025 N 9th St Elwood, IN | 3.0 | 2.5 | 1762 | $1,750 | $0.99 | 1d | 1 | 0.97mi |
Listing history 13 events
-
2026-06-18status $120,000 Pending 8 DOM
-
2026-06-18days on market $120,000 Active 8 DOM
-
2026-06-17days on market $120,000 Active 7 DOM
-
2026-06-16days on market $120,000 Active 6 DOM
-
2026-06-15days on market $120,000 Active 5 DOM
-
2026-06-13statusdays on market $120,000 Active 3 DOM
-
2026-04-25status Pending
-
2026-04-24$120,000 Active
-
2015-08-21soldstatus $15,000 Sold 237-char remark
Show marketing remark (237 chars)
Spacious 3 beds,2 baths single family home awaits you! 1 Level home with open floor plan, large Bedrooms. Hardwood floor. Living area. 1 Car detached garage. This is a Fannie Mae HomePath property. Don't miss this wonderful opportunity!!
-
2015-08-07status Pending 237-char remark
Show marketing remark (237 chars)
Spacious 3 beds,2 baths single family home awaits you! 1 Level home with open floor plan, large Bedrooms. Hardwood floor. Living area. 1 Car detached garage. This is a Fannie Mae HomePath property. Don't miss this wonderful opportunity!!
-
2015-08-04historical Contingent - Backup Pending Contracts 237-char remark
Show marketing remark (237 chars)
Spacious 3 beds,2 baths single family home awaits you! 1 Level home with open floor plan, large Bedrooms. Hardwood floor. Living area. 1 Car detached garage. This is a Fannie Mae HomePath property. Don't miss this wonderful opportunity!!
-
2015-07-02$19,000 Active 237-char remark
Show marketing remark (237 chars)
Spacious 3 beds,2 baths single family home awaits you! 1 Level home with open floor plan, large Bedrooms. Hardwood floor. Living area. 1 Car detached garage. This is a Fannie Mae HomePath property. Don't miss this wonderful opportunity!!
-
2000-07-13$89,900
ⓘ Source: listings_history table (triggers on properties + properties_extension) + one-shot
backfill from property_details.listing_events for pre-trigger history.
Tax reassessment forecast IN · Partial reset (capped growth)
- Current annual tax
- $662 · $55/mo
- Projected year-2 tax
- $841 · $70/mo
- Expected delta
- +$179/yr (+$15/mo · 27.0%)
ⓘ Screening estimate from a state-policy table — verify with the county assessor before closing.
Climate risk First Street
- Flood 1/10 Low FEMA zone X (unshaded) · 0% chance over 30 yrs
- Wildfire 1/10 Low
- Heat 3/10 Moderate 7 d/yr ≥102°F today · 18 d/yr by 30 yrs out
- Wind 2/10 Low
- Air quality 4/10 Moderate 3 unhealthy d/yr today · 5 by 30 yrs out
Nearby sold comps map
Loading sold comps map…
Walkable amenities ~0.75 mi
Loading nearby amenities…
Taxation est. · year 1
- Rental income
- $14,948
- − Mortgage interest
- −$6,722
- − Property taxes
- −$662
- − Insurance
- −$600
- − Repairs & maintenance
- −$1,196
- − Management
- −$1,196
- − Depreciation
- −$3,491
- Taxable income
- $1,082
- Est. tax owed @ 24.0%
- −$260
- After-tax cash flow
- $2,736/yr
For passive investors: Depreciation is non-cash, so a rental often shows a tax loss while cash-flowing — sheltering income. Rental losses are passive: they offset passive income freely, and up to $25,000/yr can offset ordinary (W-2) income if you actively participate and your MAGI is under $100k (phasing out to $0 by $150k); unused losses carry forward. On sale, claimed depreciation is recaptured at up to 25%, and gains may owe capital-gains tax (a 1031 exchange can defer both). Figures are a year-1 estimate at your 24.0% rate — not tax advice; consult a CPA.
Schools (NCES district)
- District
- Elwood Community School Corporation
- NCES district ID
- 1803300
- Math proficiency
- 18% ▼ -9.00%
- Reading proficiency
- 19% ▼ -9.00%
- Median HH income
- $38,757
- Composite
- 15.6/100
- National rank
- #9292
- State rank
- #283 of 301 in IN
Livability — Elwood
- Score
- 62/100
- State rank
- #482
- US rank
- #17050
Category grades
Schools grade is shown separately in the Schools card above.
Census & demographics
- Census place
- Elwood, IN
- County
- Madison County · 69,445 people
- City population
- 11,683
- Metro
- Indianapolis-Carmel-Anderson, IN
- Population (ZIP)
- 11,683
- Household income
- $62,074
- Rent vs Own
- Severe rent burden
- 225.0
Population outlook (Madison County) Hauer SSP2
- Today (2025)
- 125,800 people
- By 2030
- 122,640 · -2.5%
- By 2040
- 115,420 · -8.3%
- By 2050
- 108,148 · -14.0%
- By 2075
- 91,838 · -27.0%
- By 2100
- 75,670 · -39.8%
Race, ethnicity, and origin ACS 2023
- Neighborhood character
- Predominantly White (94%)
- Race & ethnicity
- White 94% Hispanic / Latino 3% Two or more races 3%
- Common ancestry
- Iranian 2% Italian 2% Slovak 1%
- Foreign-born
- 1% · Canada
- Languages at home
- 97% English-only · Spanish 2%
Political lean MEDSL · Madison
- 2024 margin
- Strong R (+26.9) · D 35.6% · R 62.5% · Other 1.9%
- 2008→2024 swing
- -33.5pp toward R · 2008: 6.5pp · 2024: -26.9pp
- All cycles
- 2024: R+26.9 2020: R+22.6 2016: R+25.7 2012: R+4.5 2008: D+6.5
Not yet ingested
- Civics
- —
Market trends
- HPI YoY
- ▼ -70.59%
- Current HPI
- 314.8526
- Rent YoY
- —
- Metro
- Indianapolis-Carmel-Anderson, IN
- State GDP YoY
- ▲ 2.90%
- F500 in state
- 18
Industry mix (Fortune 500 HQ in IN)
| Industry | F500 HQs | Revenue |
|---|---|---|
| Industrial Machinery | 2 | $37B |
|
||
| Healthcare | 1 | $177B |
|
||
| Pharmaceuticals | 1 | $45B |
|
||
| Metals / Steel | 1 | $18B |
|
||
| Agriculture | 1 | $17B |
|
||
| Packaging | 1 | $12B |
|
||
Price history
+33.5% since first listed7 events — show timeline
- 2026-04-25 Pending — MIBOR as Distributed by MLS Grid
- 2026-04-24 Listed $120,000 MIBOR as Distributed by MLS Grid
- 2015-08-21 Sold (MLS) $15,000 MIBOR as Distributed by MLS Grid
- 2015-08-07 Pending — MIBOR as Distributed by MLS Grid
- 2015-08-04 Contingent — MIBOR as Distributed by MLS Grid
- 2015-07-02 Listed $19,000 MIBOR as Distributed by MLS Grid
- 2000-07-13 Listed $89,900 MIBOR as Distributed by MLS Grid
Property tax history
-4.7%/yrLatest (2024): $662 · +7.3% YoY. Source: county tax records.
Cash-flow waterfall
monthlySold comps — $/sqft
last 12 mo · ≤1 miLoading sold comps…