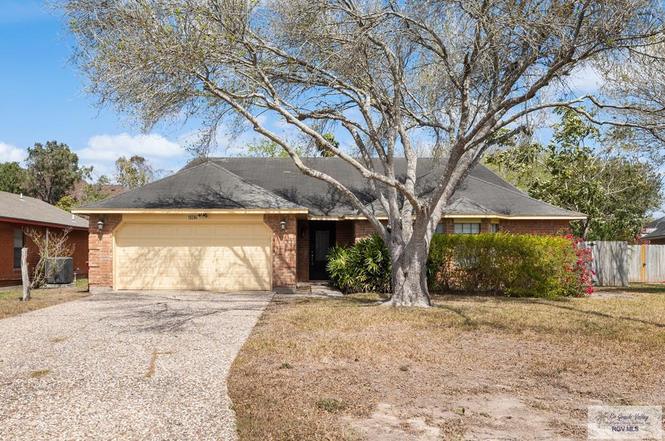
4962 Las Cruces Ct · Brownsville, TX
Flood risk 1/10 · Minimal
- FEMA flood zone
- X (unshaded)
- Chance of flooding over 30 yrs
- 0.0%
- Est. flood insurance / yr
- $507 – $1,088
Fire risk 4/10 · Minor
- Est. fire insurance / yr
- $1,222 – $2,270
Heat risk 9/10 · Severe
- Hot days now (above 110°F)
- 7 days/yr
- Hot days in 30 yrs
- 25 days/yr
Wind risk 9/10 · Severe
- Chance of severe wind over 30 yrs
- 99.0%
Air-quality risk 2/10 · Minimal
- Unhealthy air days now
- 1 days/yr
- Unhealthy air days in 30 yrs
- 1 days/yr
Risk factors via First Street. Map © Google.
Why this score? — see what drove the D grade
The composite is a weighted blend of 9 inputs, each scored 0–100. Each bar is that input's sub-score; the figure is the points it added to the 100-point composite (weight × sub-score).
- Cash flow +14.7/30.0
- ARV discount +10.2/15.0
- DSCR +4.5/10.0
- Livability +4.0/5.0
- 1% rule +3.8/10.0
- Rent growth +3.2/5.0
- Condition / age +2.5/5.0
- Schools +2.2/10.0
- Appreciation +0.0/10.0
$247,000
🖨 Deal sheet (PDF) 📄 Offer letter ✓ Due diligence
Listing remarks
Beautiful 3-bedroom, 2-bath home located in a quiet cul-de-sac. This well-maintained property features a spacious living room with fireplace, a combined kitchen and breakfast area, and plantation shutters throughout. The primary suite offers an updated bathroom, and new carpet has been installed in all bedrooms. Enjoy outdoor living with a covered patio and privacy fence. Additional upgrades include a new A/C unit (inside and out) and new duct work and water softener Centrally located near restaurants, schools, shopping strips and the hospital. This house is move-in ready
Key facts
- New a/c unit
- Covered patio
- Privacy fence
Tags
Neighborhood map
What this means for you Summary
Snapshot
- This is a 3-bed/2.0-bath single-family listed at $247k.
Deal economics
- At list price, monthly cash flow is $62 ($740/yr) — positive.
- The deal already cash-flows at list — no discount required.
- To meet the 1% rule (rent ≥ 1% of price), the offer needs to be $217k (12.1% below list).
- Recommended offer: $217k (12.1% below list) — sets the bar for 1% rule.
- Cap rate 6.6% vs local median 5.0% in Brownsville — top-decile yield for the area; either an underpriced asset or a hidden risk that comps aren't pricing in. Stress-test before assuming the spread holds.
Location & tenants
- Location reads 79/100 on livability (#62 in TX, #2,311 nationally) — a middle-class / working-renter tenant base. Strengths: commute A+, cost of living A+, housing A+; Watch: amenities D, crime D-, employment F.
- Brownsville ISD (urban): math 20% / reading 34% proficiency, ranked #710 of 826 in TX (top 86%) — low school quality limits family demand, transient renter base, plan for 1-2y turnover; 83% free/reduced lunch — lower-income household profile, screen leases tightly.
- Zoned schools: Burns El (math 22% / reading 27%, grade F, #3,052 of 4,322 statewide, top 74%, 604 students, 92% FRL); Vela Middle (math 19% / reading 37%, grade F, #1,143 of 1,662 statewide, top 69%, 638 students, 82% FRL); Hanna Early College H S (math 24% / reading 49%, grade F, #924 of 1,632 statewide, top 57%, 2,246 students, 88% FRL) — zoned schools at 87% FRL track the district average.
- Market conditions: Rents rising (+2.8%/yr); 415 active listings in the ZIP; 28 comparable units currently listed for rent nearby; rentals at typical pace (median 24d on market — plan ~3-4 weeks tenant-placement turnaround); 2,326 units permitted in Cameron County in 2024 (503 in 5+ unit buildings).
- This rent runs 37% of the median local income ($71k/yr) — at the standard rent-burdened threshold; future hikes will face affordability resistance.
Forward outlook
- Local home prices are declining (-3.0%/yr); year-one equity from $2k of loan paydown is wiped out by about $7k of value loss. Plan a longer hold.
- Cameron County population projected at +3% by 2050 — modest demand growth; plan on rents tracking national, not racing it.
Negotiation context
- Only 11 days on market — expect competitive offers; lowballing is unlikely to land.
Risks & watch-outs
- Climate carrying-cost: severe wind risk, 99% chance of damaging wind over 30y; extreme-heat days projected 7→25/yr by 2055 (HVAC capex compounding) — expect insurance premiums to compound above CPI over the hold.
Questions for the listing agent
- Is there a deadline driving the sale (1031 exchange, divorce, estate, relocation)? That informs how much negotiation room exists.
- Crime grade is D in this area — have there been break-ins, vandalism, or insurance claims at this property in the last 3 years? What carrier currently insures it and at what premium?
- The area grade is low — what's the realistic commute time and amenity access for the typical tenant pool here? Any planned neighborhood developments (good or bad) we should know about?
- What's the average days-on-market for RENTAL listings here right now (not sales)? A rising rental-DOM trend means longer vacancies and softer asking-rent achievability than the comps imply.
- What's the recent tenant-quality profile in this submarket — average credit score on applications, eviction rate, late-payment / NSF rate, and stable-employment percentage? A property-management company in the area should have these aggregated.
- How much new for-sale + rental construction is in the pipeline within 1–3 miles? Heavy new supply typically softens prices + rents 12–24 months out; constrained supply supports both.
Investment metrics
- 1% rule
- 0.88% ✗
- Cap rate
- 6.59%
- Cash-on-cash
- 1.07%
- DSCR
- 1.05
- GRM
- 9.5
CMA / ARV
- ARV (on-the-fly)
- $263,032
- Comps found
- 6
Show comp detail 6 sales within ~0.75 mi
| Address | Dist | Beds/Ba | Sqft | Sold | Price | $/sf | Match |
|---|---|---|---|---|---|---|---|
| 4840 Larkspur Dr | 0.32mi | 3/2.0 | 1,591 (-7%) | 6mo | $245,500 | $154 | 68 |
| 4731 Larkspur Ave | 0.35mi | 3/2.0 | 1,779 (+4%) | 13mo | $240,000 | $135 | 66 |
| 1415 Alta Mesa Blvd | 0.19mi | 3/2.0 | 1,901 (+11%) | 10mo | $229,000 | $120 | 64 |
| 4951 Daffodil Dr | 0.17mi | 3/2.0 | 1,498 (-12%) | 16mo | $239,500 | $160 | 58 |
| 1558 Guadalajara Ave | 0.47mi | 3/2.0 | 1,581 (-7%) | 17mo | $249,000 | $157 | 52 |
| 987 Paso Del Rio Dr | 0.66mi | 3/2.0 | 1,457 (-15%) | 21mo | $199,999 | $137 | 27 |
Match score weights: distance 35% · size 25% · config 20% · recency 20%. Top-matched comps best support the ARV.
Projected returns pro-forma
-3.0% appreciation · 2.77% rent growth · sell at horizon
- IRR
- -14.8%
- Equity multiple
- 0.47×
- Total profit
- $-36,600
- Equity at exit
- $36,829
- IRR
- -6.6%
- Equity multiple
- 0.58×
- Total profit
- $-28,864
- Equity at exit
- $21,356
Cash invested: $69,160 (down + closing). Projections, not guarantees.
Landlord ↔ Tenant lean methodology
- Overall (STATE)
- 87 Strongly Landlord-Friendly
- State Texas
- 87 Strongly Landlord-Friendly · R+5
- County
- — inherits STATE
- City
- — inherits STATE
ZIP-level market 78526
- Home prices YoY
- -12.1%
- Rents YoY
- 2.8%
- Active inventory
- 415
- Price-to-rent
- 9.5×
Monthly cashflow live
- Estimated rent
- $2,170 high interval (Pro) →
- Mortgage (P&I)
- −$1,295
- Tax from tax record
- −$254 /mo · $3,053/yr
- Insurance
- −$103
- HOA
- −$0
- Lot rent
- −$0
- Vacancy / Maint / Mgmt
- −$456
- Net cashflow
- $62
Break-even live
Sensitivity live
| Price | -10% $201 | -5% $132 | +0% $62 | +5% $-8 | +10% $-78 |
|---|---|---|---|---|---|
| Rent | -10% $-110 | -5% $-24 | +0% $62 | +5% $147 | +10% $233 |
| Rate | -1.0pp $186 | -0.5pp $124 | base $62 | +0.5pp $-2 | +1.0pp $-67 |
UW: 25.0% down · 7.5% · 30yr · 1.5% tax · 5.0% vac · 8.0% maint · 8.0% mgmt
Financing live
Cash to close
- Down payment
- $61,750
- Closing costs
- $7,410
- Reserves months
- —
- Total cash needed
- —
Loan-product check · same deal, 3 products live
Conventional
25% down · 7.5% · 30yr
- Down + closing
- —
- Monthly P&I
- —
- Monthly cashflow
- —
- DSCR
- —
- Eligible?
- —
Personal DTI + credit; lowest rate.
DSCR
20% down · 8.5% · 30yr
- Down + closing
- —
- Monthly P&I
- —
- Monthly cashflow
- —
- DSCR
- —
- Eligible?
- —
No personal income docs; deal must DSCR.
Hard money
10% down · 12.0% · 12mo
- Down + closing
- —
- Monthly P&I
- —
- Monthly cashflow
- —
- DSCR
- —
- Eligible?
- —
Short-term bridge; refi at stabilization.
Rent comps 28 comps
| Address | Beds | Baths | Sqft | Rent | $/sqft | DOM | Units | Dist |
|---|---|---|---|---|---|---|---|---|
| 1587 Pinion Dr Brownsville, TX | 3.0 | 2.0 | 1226 | $1,750 | $1.43 | 46d | 1 | 0.14mi |
| 4951 Daffodil Dr Brownsville, TX | 3.0 | 2.0 | 1498 | $2,400 | $1.60 | 23d | 1 | 0.17mi |
| 4951 Daffodil Dr Brownsville, TX | 3.0 | 2.0 | 1498 | $2,400 | $1.60 | 46d | 1 | 0.17mi |
| 1315 Pinion Dr Brownsville, TX | 3.0 | 2.0 | 1600 | $1,950 | $1.22 | 46d | 1 | 0.26mi |
| 4883 Camino Verde Dr Brownsville, TX | 3.0 | 2.0 | 1302 | $1,800 | $1.38 | 23d | 1 | 0.37mi |
| 2066 Saketa Ln Brownsville, TX | 3.0 | 2.0 | 1184 | $1,700 | $1.44 | 16d | 1 | 0.49mi |
| 1124 Sierra Grande Dr Brownsville, TX | 3.0 | 2.0 | 1308 | $1,599 | $1.22 | 23d | 1 | 0.49mi |
| 2018 Diamond Dr Unit A Brownsville, TX | 2.0 | 2.5 | 1465 | $1,750 | $1.19 | 46d | 1 | 0.52mi |
| 2019 Diamond Dr Unit B Brownsville, TX | 3.0 | 2.5 | 1565 | $1,950 | $1.25 | 23d | 1 | 0.54mi |
| 2011 Diamond Dr Unit A Brownsville, TX | 2.0 | 2.5 | 1465 | $2,900 | $1.98 | 23d | 1 | 0.55mi |
| 1044 Alta Mesa Blvd Brownsville, TX | 3.0 | 2.0 | 1276 | $1,700 | $1.33 | 16d | 1 | 0.58mi |
| 4874 Espada Grande Ave Brownsville, TX | 4.0 | 2.5 | 2215 | $3,300 | $1.49 | 23d | 1 | 0.63mi |
| 1653 W San Marcelo Blvd Brownsville, TX | 3.0 | 2.0 | 1212 | $1,700 | $1.40 | 23d | 1 | 0.64mi |
| 1683 Artemisa Ave Brownsville, TX | 3.0 | 2.0 | 1717 | $1,950 | $1.14 | 23d | 1 | 0.65mi |
| 944 Alta Mesa Blvd Brownsville, TX | 3.0 | 2.0 | 1582 | $1,900 | $1.20 | 23d | 1 | 0.71mi |
| 2107 Carlos Ave Unit A Brownsville, TX | 3.0 | 2.0 | 1500 | $1,500 | $1.00 | 16d | 1 | 0.74mi |
| 5771 Greenwood Dr Brownsville, TX | 3.0 | 2.0 | 1881 | $1,950 | $1.04 | 46d | 1 | 0.81mi |
| 6732 Stone Oak Brownsville, TX | 3.0 | 2.0 | 1786 | $2,300 | $1.29 | 16d | 1 | 0.85mi |
| 5871 Greenwood Dr Brownsville, TX | 3.0 | 2.5 | 1820 | $1,950 | $1.07 | 16d | 1 | 0.85mi |
| 6601 Garden Woods Ave Brownsville, TX | 3.0 | 2.0 | 1291 | $1,600 | $1.24 | 46d | 1 | 0.91mi |
| 6978 Heritage Oak Dr Brownsville, TX | 3.0 | 2.0 | 1476 | $2,250 | $1.52 | 23d | 1 | 1.16mi |
| 124 Barcelona Ave Brownsville, TX | 3.0 | 2.0 | 1708 | $2,900 | $1.70 | 23d | 1 | 1.21mi |
| 6705 Garden Woods Ave Unit B Brownsville, TX | 3.0 | 2.0 | 1350 | $1,550 | $1.15 | 16d | 1 | 1.29mi |
| 7073 Heritage Oak Dr Brownsville, TX | 4.0 | 3.5 | 2204 | $3,400 | $1.54 | 46d | 1 | 1.30mi |
| 15 Valles Ct Brownsville, TX | 3.0 | 2.0 | 1715 | $2,350 | $1.37 | 16d | 1 | 1.35mi |
| 3330 Calle Bolivia Brownsville, TX | 3.0 | 2.5 | 2090 | $2,550 | $1.22 | 46d | 1 | 1.43mi |
| 2100 W San Marcelo Blvd Brownsville, TX | 2.0–3.0 | 2.0–2.5 | 1069 | $1,500 | $1.40 | 46d | 2 | 1.45mi |
| 3247 Noble Dr Brownsville, TX | 3.0 | 2.0 | 1800 | $2,000 | $1.11 | 23d | 1 | 1.46mi |
Listing history 7 events
-
2026-04-23soldstatus
-
2026-03-27status Pending
-
2026-03-01$247,000 Active
-
2008-03-04soldstatus
-
1994-07-28soldstatus
-
1993-01-22soldstatus
-
1989-03-01soldstatus
ⓘ Source: listings_history table (triggers on properties + properties_extension) + one-shot
backfill from property_details.listing_events for pre-trigger history.
Tax reassessment forecast TX · Resets to sale price
- Current annual tax
- $3,053 · $254/mo
- Projected year-2 tax
- $4,520 · $377/mo
- Expected delta
- +$1,468/yr (+$122/mo · 48.1%)
ⓘ Screening estimate from a state-policy table — verify with the county assessor before closing.
Climate risk First Street
- Flood 1/10 Low FEMA zone X (unshaded) · 0% chance over 30 yrs
- Wildfire 4/10 Moderate
- Heat 9/10 Extreme 7 d/yr ≥110°F today · 25 d/yr by 30 yrs out
- Wind 9/10 Extreme 99% chance of damaging wind over 30 yrs
- Air quality 2/10 Low 1 unhealthy d/yr today · 1 by 30 yrs out
Nearby sold comps map
Loading sold comps map…
Walkable amenities ~0.75 mi
Loading nearby amenities…
Taxation est. · year 1
- Rental income
- $26,039
- − Mortgage interest
- −$13,836
- − Property taxes
- −$3,053
- − Insurance
- −$1,235
- − Repairs & maintenance
- −$2,083
- − Management
- −$2,083
- − Depreciation
- −$7,185
- Taxable loss
- −$3,436
- Est. tax savings @ 24.0%
- +$825
- After-tax cash flow
- $1,564/yr
For passive investors: Depreciation is non-cash, so a rental often shows a tax loss while cash-flowing — sheltering income. Rental losses are passive: they offset passive income freely, and up to $25,000/yr can offset ordinary (W-2) income if you actively participate and your MAGI is under $100k (phasing out to $0 by $150k); unused losses carry forward. On sale, claimed depreciation is recaptured at up to 25%, and gains may owe capital-gains tax (a 1031 exchange can defer both). Figures are a year-1 estimate at your 24.0% rate — not tax advice; consult a CPA.
Schools (NCES district)
- District
- Brownsville ISD
- NCES district ID
- 4811680
- Math proficiency
- 20% ▼ -36.00%
- Reading proficiency
- 34% ▼ -13.00%
- Median HH income
- $30,490
- Composite
- 21.8/100
- National rank
- #8249
- State rank
- #710 of 826 in TX
Livability — Brownsville
- Score
- 79/100
- State rank
- #62
- US rank
- #2311
Category grades
Schools grade is shown separately in the Schools card above.
Census & demographics
- Census place
- Brownsville, TX
- County
- Cameron County · 310,734 people
- City population
- 212,132
- Metro
- Brownsville-Harlingen, TX
- Population (ZIP)
- 60,012
- Household income
- $70,565
- Rent vs Own
- Severe rent burden
- 1063.0
Population outlook (Cameron County) Hauer SSP2
- Today (2025)
- 441,603 people
- By 2030
- 448,113 · +1.5%
- By 2040
- 456,385 · +3.3%
- By 2050
- 456,294 · +3.3%
- By 2075
- 423,851 · -4.0%
- By 2100
- 342,787 · -22.4%
Race, ethnicity, and origin ACS 2023
- Neighborhood character
- Predominantly Hispanic (93%)
- Race & ethnicity
- Hispanic / Latino 93% Two or more races 45% White 4% Asian 2%
- Hispanic origin (detail)
- Mexican 87%
- Foreign-born
- 25% · Canada, Vietnam
- Languages at home
- 19% English-only · Spanish 79% Tagalog/Filipino 1%
Political lean MEDSL · Cameron
- 2024 margin
- Lean R (+5.8) · D 46.7% · R 52.5%
- 2008→2024 swing
- -34.6pp toward R · 2008: 28.8pp · 2024: -5.8pp
- All cycles
- 2024: R+5.8 2020: D+13.2 2016: D+32.5 2012: D+32.4 2008: D+28.8
Not yet ingested
- Civics
- —
Market trends
- HPI YoY
- ▼ -30.28%
- Current HPI
- 220.5233
- Rent YoY
- ▲ 2.77%
- Metro
- Brownsville-Harlingen, TX
- State GDP YoY
- ▲ 3.95%
- F500 in state
- 110
Industry mix (Fortune 500 HQ in TX)
| Industry | F500 HQs | Revenue |
|---|---|---|
| Energy | 16 | $1,198B |
|
||
| Technology | 5 | $198B |
|
||
| Engineering / Construction | 4 | $72B |
|
||
| Energy Services | 3 | $60B |
|
||
| Utilities | 3 | $41B |
|
||
| Healthcare | 2 | $330B |
|
||
Price history
7 events — show timeline
- 2026-04-23 Sold (Public Records) — Public Records
- 2026-03-27 Pending — RGVMLS
- 2026-03-01 Listed $247,000 RGVMLS
- 2008-03-04 Sold (Public Records) — Public Records
- 1994-07-28 Sold (Public Records) — Public Records
- 1993-01-22 Sold (Public Records) — Public Records
- 1989-03-01 Sold (Public Records) — Public Records
Property tax history
+1.9%/yrLatest (2025): $3,053 · +0.2% YoY. Source: county tax records.
Cash-flow waterfall
monthlySold comps — $/sqft
last 12 mo · ≤1 miLoading sold comps…