 Multi-family
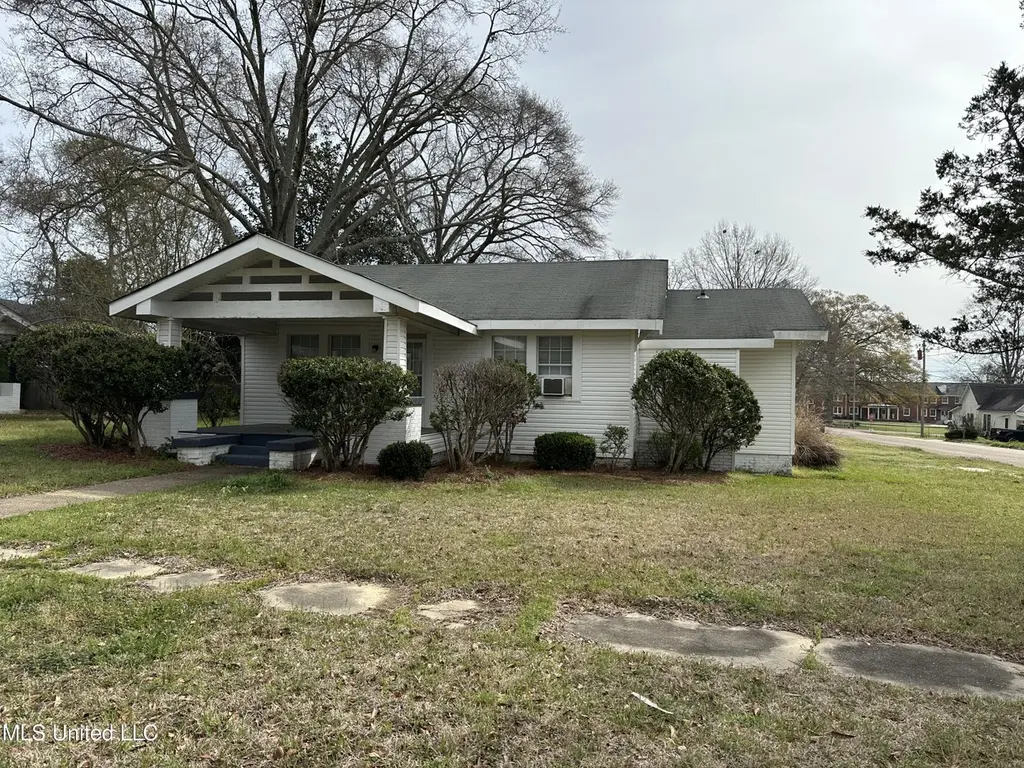
305 NW 3rd Ave · Magee, MS
Flood risk 1/10 · Minimal
- FEMA flood zone
- X (unshaded)
- Chance of flooding over 30 yrs
- 0.0%
- Est. flood insurance / yr
- $507 – $1,088
Fire risk 4/10 · Minor
- Est. fire insurance / yr
- $1,241 – $2,305
Heat risk 8/10 · Major
- Hot days now (above 108°F)
- 7 days/yr
- Hot days in 30 yrs
- 21 days/yr
Wind risk 8/10 · Major
- Chance of severe wind over 30 yrs
- 80.0%
Air-quality risk 1/10 · Minimal
- Unhealthy air days now
- 0 days/yr
- Unhealthy air days in 30 yrs
- 0 days/yr
Risk factors via First Street. Map © Google.
Why this score? — see what drove the C+ grade
The composite is a weighted blend of 9 inputs, each scored 0–100. Each bar is that input's sub-score; the figure is the points it added to the 100-point composite (weight × sub-score).
- Cash flow +25.1/30.0
- DSCR +8.2/10.0
- 1% rule +6.5/10.0
- Appreciation +6.5/10.0
- ARV discount +5.7/15.0
- Livability +3.2/5.0
- Condition / age +2.8/5.0
- Rent growth +2.5/5.0
- Schools +1.7/10.0
$149,900
🖨 Deal sheet (PDF) 📄 Offer letter ✓ Due diligence
Multi-family units
County records classify this as Multi-Family (2-4 Unit). Listing-text estimate: 1 unit. estimate disagrees with records
Listing remarks MLS
Turn of the century home that has been well maintained and located in the historic downtown Magee. Featuring 3 Br 2 Ba, large kitchen, family room, laundry room. At present being used as rental property. $600 for 3 Br 1 Ba and $400 for the efficiency apartment
Key facts
- 0.43 acre lot
- Parking
- Built 1930
Neighborhood map
What this means for you Summary
Snapshot
- This is a 3-bed/2.5-bath multifamily listed at $150k. Condition is rated average.
Deal economics
- At list price, monthly cash flow is $331 ($4k/yr) — positive.
- The deal already cash-flows at list — no discount required.
- Meets the 1% rule at list price ($2k rent vs $150k).
- Recommended offer: $132k (12.0% below list) — sets the bar for market timing.
- Cap rate 8.9% vs local median 3.6% in Magee — top-decile yield for the area; either an underpriced asset or a hidden risk that comps aren't pricing in. Stress-test before assuming the spread holds.
Location & tenants
- Location reads 63/100 on livability (#158 in MS) — a middle-class / working-renter tenant base. Strengths: cost of living A+; Watch: schools F, crime F, amenities F.
- Simpson County School District (rural): math 18% / reading 24% proficiency, ranked #90 of 130 in MS (top 69%) — low school quality limits family demand, transient renter base, plan for 1-2y turnover; 76% free/reduced lunch — lower-income household profile, screen leases tightly.
- Market conditions: 75 active listings in the ZIP; 3 units permitted in Simpson County in 2024 (0 in 5+ unit buildings).
Forward outlook
- In year one you build about $5k of equity ($1k loan paydown + $4k appreciation (2.9% local appreciation)).
- Simpson County population projected at -16% by 2050 — secular population decline; favor cash flow + early exit over multi-decade hold.
- At projected returns (2.9% appreciation + 3.0% rent growth), your $42k cash investment doubles in ~5 years — after that, you're playing with house money.
- By year 7, paydown + projected appreciation supports a ~$34k cash-out refi (75% LTV) — recoverable capital for the next deal without selling this one.
Negotiation context
- It's been on market 143 days — a 12% lower offer ($132k) is reasonable based on typical stale-listing flexibility.
- 4 sale attempts since 12y ago with the ask held roughly flat each time — persistent listings suggest the price (not the market) is what's stuck; bring a comps-based counter.
Risks & watch-outs
- Watch-outs: built in 1930 — expect roof / HVAC / electrical / plumbing capex.
- Climate carrying-cost: severe wind risk, 80% chance of damaging wind over 30y; extreme-heat days projected 7→21/yr by 2055 (HVAC capex compounding) — expect insurance premiums to compound above CPI over the hold.
Questions for the listing agent
- It's been on market 143 days. Have you received any prior offers? Is the seller open to a 12% concession, seller financing, or rate buy-down credit?
- Built in 1930 — when were the roof, HVAC, electrical panel, plumbing, and water heater last replaced?
- Why hasn't it sold? Are there any deal-killer items the seller is aware of (foundation, flood, title, zoning, code violations)?
- Is there a deadline driving the sale (1031 exchange, divorce, estate, relocation)? That informs how much negotiation room exists.
- Schools are F-rated, which usually means shorter tenancies and higher turnover. Who's the typical renter profile here, and what's been the actual vacancy rate?
- Crime grade is F in this area — have there been break-ins, vandalism, or insurance claims at this property in the last 3 years? What carrier currently insures it and at what premium?
- What's the average days-on-market for RENTAL listings here right now (not sales)? A rising rental-DOM trend means longer vacancies and softer asking-rent achievability than the comps imply.
- What's the recent tenant-quality profile in this submarket — average credit score on applications, eviction rate, late-payment / NSF rate, and stable-employment percentage? A property-management company in the area should have these aggregated.
- How much new apartment / multifamily construction is in the pipeline within 1–3 miles? Heavy new supply (>2% of stock underway) typically softens rents 12–24 months out; light construction supports rent growth.
Investment metrics
- 1% rule
- 1.15% ✓
- Cap rate
- 8.94%
- Cash-on-cash
- 9.46%
- DSCR
- 1.42
- GRM
- 7.2
CMA / ARV
- ARV (median comp)
- $143,986
- List price
- $149,900
- Delta
- 4.11%
- Verdict
- FAIR
- Comps
- 1 within 2.0 mi
Projected returns pro-forma
2.9% appreciation · 3.0% rent growth · sell at horizon
- IRR
- 16.1%
- Equity multiple
- 1.91×
- Total profit
- $38,366
- Equity at exit
- $66,566
- IRR
- 17.8%
- Equity multiple
- 3.58×
- Total profit
- $108,092
- Equity at exit
- $101,942
Cash invested: $41,972 (down + closing). Projections, not guarantees.
Landlord ↔ Tenant lean methodology
- Overall (STATE)
- 90 Strongly Landlord-Friendly
- State Mississippi
- 90 Strongly Landlord-Friendly · R+11
- County
- — inherits STATE
- City
- — inherits STATE
ZIP-level market 39111
- Home prices YoY
- 1.8%
- Active inventory
- 75
- Price-to-rent
- 13.9×
Monthly cashflow live
- Estimated rent
- $1,730 medium interval (Pro) →
- Mortgage (P&I)
- −$786
- Tax est. 1.5%
- −$187 /mo · $2,248/yr
- Insurance
- −$62
- HOA
- −$0
- Vacancy / Maint / Mgmt
- −$363
- Net cashflow
- $331
Break-even live
Sensitivity live
| Price | -10% $434 | -5% $383 | +0% $331 | +5% $279 | +10% $227 |
|---|---|---|---|---|---|
| Rent | -10% $194 | -5% $262 | +0% $331 | +5% $399 | +10% $467 |
| Rate | -1.0pp $406 | -0.5pp $369 | base $331 | +0.5pp $292 | +1.0pp $252 |
2-unit breakdown (identical units grouped — click to expand)
| Units | Beds | Baths | Est. rent |
|---|---|---|---|
| 1× unit | 3 | 2 | $900 |
| 1× unit | 1 | 1 | $830 |
| Total (2 units) | $1,730 | ||
UW: 25.0% down · 7.5% · 30yr · 1.5% tax · 5.0% vac · 8.0% maint · 8.0% mgmt
Financing live
Cash to close
- Down payment
- $37,475
- Closing costs
- $4,497
- Reserves months
- —
- Total cash needed
- —
Loan-product check · same deal, 3 products live
Conventional
25% down · 7.5% · 30yr
- Down + closing
- —
- Monthly P&I
- —
- Monthly cashflow
- —
- DSCR
- —
- Eligible?
- —
Personal DTI + credit; lowest rate.
DSCR
20% down · 8.5% · 30yr
- Down + closing
- —
- Monthly P&I
- —
- Monthly cashflow
- —
- DSCR
- —
- Eligible?
- —
No personal income docs; deal must DSCR.
Hard money
10% down · 12.0% · 12mo
- Down + closing
- —
- Monthly P&I
- —
- Monthly cashflow
- —
- DSCR
- —
- Eligible?
- —
Short-term bridge; refi at stabilization.
Listing history 22 events
-
2026-06-21days on market $149,900 Active 143 DOM
-
2026-06-18days on market $149,900 Active 141 DOM
-
2026-06-17days on market $149,900 Active 140 DOM
-
2026-06-16days on market $149,900 Active 139 DOM
-
2026-06-15days on market $149,900 Active 138 DOM
-
2026-06-13days on market $149,900 Active 136 DOM
-
2026-06-12days on market $149,900 Active 135 DOM
-
2026-06-09days on market $149,900 Active 132 DOM
-
2026-06-08days on market $149,900 Active 131 DOM
-
2026-06-07days on market $149,900 Active 130 DOM
-
2026-06-07days on market $149,900 Active 129 DOM
-
2026-06-04days on market $149,900 Active 126 DOM
-
2026-06-02days on market $149,900 Active 125 DOM
-
2026-06-01days on market $149,900 Active 124 DOM
-
2026-05-31days on market $149,900 Active 123 DOM
-
2026-04-29status Active 263-char remark
Show marketing remark (263 chars)
Turn of the century home that has been well maintained and located in the historic downtown Magee. Featuring 3 Br 2 Ba, large kitchen, family room, laundry room. At present being used as rental property. $600 for 3 Br 1 Ba and $400 for the efficiency apartment
-
2026-04-15status Pending 263-char remark
Show marketing remark (263 chars)
Turn of the century home that has been well maintained and located in the historic downtown Magee. Featuring 3 Br 2 Ba, large kitchen, family room, laundry room. At present being used as rental property. $600 for 3 Br 1 Ba and $400 for the efficiency apartment
-
2026-01-14$149,900 Active 263-char remark
Show marketing remark (263 chars)
Turn of the century home that has been well maintained and located in the historic downtown Magee. Featuring 3 Br 2 Ba, large kitchen, family room, laundry room. At present being used as rental property. $600 for 3 Br 1 Ba and $400 for the efficiency apartment
-
2025-03-31historical
-
2024-03-07$149,900 Active
-
2015-09-16soldstatus
-
2014-07-11$90,000
ⓘ Source: listings_history table (triggers on properties + properties_extension) + one-shot
backfill from property_details.listing_events for pre-trigger history.
Climate risk First Street
- Flood 1/10 Low FEMA zone X (unshaded) · 0% chance over 30 yrs
- Wildfire 4/10 Moderate
- Heat 8/10 Severe 7 d/yr ≥108°F today · 21 d/yr by 30 yrs out
- Wind 8/10 Severe 80% chance of damaging wind over 30 yrs
- Air quality 1/10 Low 0 unhealthy d/yr today · 0 by 30 yrs out
Nearby sold comps map
Loading sold comps map…
Walkable amenities ~0.75 mi
Loading nearby amenities…
Taxation est. · year 1
- Rental income
- $20,760
- − Mortgage interest
- −$8,397
- − Property taxes
- −$2,248
- − Insurance
- −$750
- − Repairs & maintenance
- −$1,661
- − Management
- −$1,661
- − Depreciation
- −$4,361
- Taxable income
- $1,683
- Est. tax owed @ 24.0%
- −$404
- After-tax cash flow
- $3,565/yr
For passive investors: Depreciation is non-cash, so a rental often shows a tax loss while cash-flowing — sheltering income. Rental losses are passive: they offset passive income freely, and up to $25,000/yr can offset ordinary (W-2) income if you actively participate and your MAGI is under $100k (phasing out to $0 by $150k); unused losses carry forward. On sale, claimed depreciation is recaptured at up to 25%, and gains may owe capital-gains tax (a 1031 exchange can defer both). Figures are a year-1 estimate at your 24.0% rate — not tax advice; consult a CPA.
Condition & rehab AI · 12 photos
This property is in average condition with some minor repairs and maintenance needed. Painting the exterior and landscaping would significantly improve its curb appeal and value.
Repairs flagged
- Minor Landscaping — Some areas of the lawn appear overgrown
- Minor Exterior paint — Some areas of the exterior siding appear faded
Value-add opportunities
- Both Painting exterior siding — Fresh paint would improve curb appeal and home value
- Both Landscaping — Well-maintained landscaping enhances curb appeal and property value
Renovation cost estimate screening
| Repair item | Severity | Est. cost |
|---|---|---|
| Landscaping · Some areas of the lawn appear overgrown | Minor | $500–3,000 |
| Exterior paint · Some areas of the exterior siding appear faded | Minor | $500–3,000 |
| Total estimated repair cost · 2 items | $1,000–6,000 |
Value-add ROI direction
- Both Painting exterior siding — Fresh paint would improve curb appeal and home value ↑
- Both Landscaping — Well-maintained landscaping enhances curb appeal and property value ↑
ⓘ Cost ranges are severity-bucket heuristics (US national rule-of-thumb). Get contractor quotes + a written scope before underwriting a rehab budget.
Schools (NCES district)
- District
- Simpson County School District
- NCES district ID
- 2803990
- Math proficiency
- 18% ▼ -14.00%
- Reading proficiency
- 24% ▼ -9.00%
- Median HH income
- $36,826
- Composite
- 17.46/100
- National rank
- #9063
- State rank
- #90 of 130 in MS
Livability — Magee
- Score
- 63/100
- State rank
- #158
- US rank
- #15438
Category grades
Schools grade is shown separately in the Schools card above.
Census & demographics
- Census place
- Magee, MS
- Population (ZIP)
- 8,927
Population outlook (Simpson County) Hauer SSP2
- Today (2025)
- 26,197 people
- By 2030
- 25,474 · -2.8%
- By 2040
- 23,811 · -9.1%
- By 2050
- 22,024 · -15.9%
- By 2075
- 17,701 · -32.4%
- By 2100
- 13,732 · -47.6%
Race, ethnicity, and origin ACS 2023
- Neighborhood character
- Predominantly White (67%)
- Race & ethnicity
- White 67% Black 28% Hispanic / Latino 4% Two or more races 2%
- Common ancestry
- Serbian 5% Slovak 1% Italian 1%
- Foreign-born
- 2% · Canada
- Languages at home
- 97% English-only · Spanish 3%
Political lean MEDSL · Simpson
- 2024 margin
- Solid R (+36.7) · D 31.4% · R 68.1%
- 2008→2024 swing
- -14.3pp toward R · 2008: -22.4pp · 2024: -36.7pp
- All cycles
- 2024: R+36.7 2020: R+30.4 2016: R+30.9 2012: R+22.1 2008: R+22.4
Not yet ingested
- Civics
- —
Market trends
- HPI YoY
- ▲ 2.90%
- Current HPI
- 161.8264
- Rent YoY
- —
- Metro
- —
- State GDP YoY
- —
- F500 in state
- 0
Price history
+66.6% since first listed7 events — show timeline
- 2026-04-29 Relisted — MLSU
- 2026-04-15 Pending — MLSU
- 2026-01-14 Listed $149,900 MLSU
- 2025-03-31 Listing Removed — MLSU
- 2024-03-07 Listed $149,900 MLSU
- 2015-09-16 Sold (MLS) — MLSU
- 2014-07-11 Listed $90,000 MLSU
Cash-flow waterfall
monthlySold comps — $/sqft
last 12 mo · ≤1 miLoading sold comps…