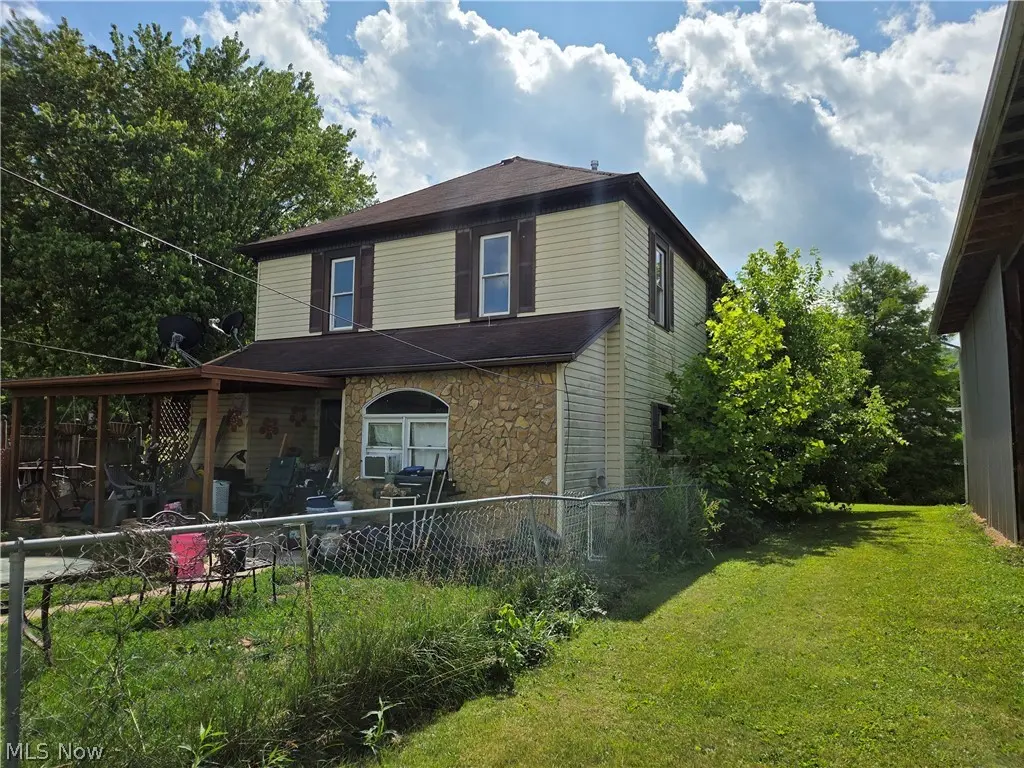
65109 Union St · Neffs, OH
Flood risk 9/10 · Severe
- FEMA flood zone
- AE
- Chance of flooding over 30 yrs
- 0.99%
- Est. flood insurance / yr
- $2,026 – $9,024
Fire risk 1/10 · Minimal
- Est. fire insurance / yr
- $713 – $1,323
Heat risk 4/10 · Minor
- Hot days now (above 97°F)
- 8 days/yr
- Hot days in 30 yrs
- 21 days/yr
Wind risk 1/10 · Minimal
- Chance of severe wind over 30 yrs
- —
Air-quality risk 1/10 · Minimal
- Unhealthy air days now
- 0 days/yr
- Unhealthy air days in 30 yrs
- 0 days/yr
Risk factors via First Street. Map © Google.
Why this score? — see what drove the B+ grade
The composite is a weighted blend of 9 inputs, each scored 0–100. Each bar is that input's sub-score; the figure is the points it added to the 100-point composite (weight × sub-score).
- Cash flow +30.0/30.0
- 1% rule +10.0/10.0
- DSCR +10.0/10.0
- ARV discount +7.5/15.0
- Schools +5.5/10.0
- Appreciation +5.0/10.0
- Livability +3.1/5.0
- Rent growth +2.5/5.0
- Condition / age +2.5/5.0
$48,900
🖨 Deal sheet 📄 Offer letter ✓ Due diligence
Listing remarks
Spacious 4-bedroom home with endless potential! Bring your vision to this generously sized home featuring large bedrooms, a spacious kitchen, covered patio, and plenty of room to make it your own. Whether you're looking for your next investment project or a property to customize, this home offers solid square footage and tons of possibilities. Conveniently located and ready for its next chapter!
Key facts
- Spacious kitchen
- Covered patio
- 3,497 sq ft lot
Tags
Property features AI
Exterior
- Parking: Off-street parking
- Utilities: Public water; Public sewer
- Home design: 2-story property; Above-grade finished area reported by assessor
- Construction: Asphalt/fiberglass roof; Property listed as fixer
- Exterior features: Covered front porch; Chain link fencing
Interior
- Kitchen: Range
- Bathrooms: 1 full bathroom (main level)
- Heating & cooling: Forced air heating; Window unit cooling
- Interior features: 6 total rooms; Common basement; Basement present
- Laundry & utility: Laundry on main level
Neighborhood map
What this means for you Summary
Snapshot
- This is a 3-bed/2.0-bath single-family listed at $49k.
Deal economics
- At list price, monthly cash flow is $122 ($1k/yr) — positive.
- The deal already cash-flows at list — no discount required.
- Meets the 1% rule at list price ($1k rent vs $49k).
Location & tenants
- Location reads 61/100 on livability (#938 in OH) — a middle-class / working-renter tenant base. Strengths: crime A+, cost of living A+; Watch: schools D+, amenities F, commute F.
- Bellaire Local (rural): math 73% / reading 56% proficiency, ranked #430 of 802 in OH (top 54%) — acceptable for families but not a draw, mixed tenant base, ~2y average lease.
- Market conditions: 1 active listings in the ZIP; 4 units permitted in Belmont County in 2024 (0 in 5+ unit buildings).
Forward outlook
- In year one you build about $2k of equity ($338 loan paydown + $1k appreciation (3.0% local appreciation)).
- Belmont County population projected at -15% by 2050 — secular population decline; favor cash flow + early exit over multi-decade hold.
- At projected returns (3.0% appreciation + 3.0% rent growth), your $14k cash investment doubles in ~4 years — after that, you're playing with house money.
Negotiation context
- Only 8 days on market — expect competitive offers; lowballing is unlikely to land.
Risks & watch-outs
- Watch-outs: flood insurance adds $460/mo; built in 1914 — expect roof / HVAC / electrical / plumbing capex.
- Climate carrying-cost: in FEMA flood zone AE (mandatory federal flood insurance) — expect insurance premiums to compound above CPI over the hold.
Questions for the listing agent
- Built in 1914 — when were the roof, HVAC, electrical panel, plumbing, and water heater last replaced?
- What's the actual annual flood-insurance premium (NFIP or private), and is the property in a SFHA with mandatory coverage?
- Is there a deadline driving the sale (1031 exchange, divorce, estate, relocation)? That informs how much negotiation room exists.
- Schools are D-rated, which usually means shorter tenancies and higher turnover. Who's the typical renter profile here, and what's been the actual vacancy rate?
- What's the average days-on-market for RENTAL listings here right now (not sales)? A rising rental-DOM trend means longer vacancies and softer asking-rent achievability than the comps imply.
- What's the recent tenant-quality profile in this submarket — average credit score on applications, eviction rate, late-payment / NSF rate, and stable-employment percentage? A property-management company in the area should have these aggregated.
- How much new for-sale + rental construction is in the pipeline within 1–3 miles? Heavy new supply typically softens prices + rents 12–24 months out; constrained supply supports both.
Investment metrics
- 1% rule
- 2.46% ✓
- Cap rate
- 20.57%
- Cash-on-cash
- 51.01%
- DSCR
- 3.27
- GRM
- 3.4
CMA / ARV
No comps found within radius.
Projected returns pro-forma
3.0% appreciation · 3.0% rent growth · sell at horizon
- IRR
- 17.8%
- Equity multiple
- 2.02×
- Total profit
- $13,953
- Equity at exit
- $21,988
- IRR
- 19.5%
- Equity multiple
- 3.87×
- Total profit
- $39,269
- Equity at exit
- $33,885
Cash invested: $13,692 (down + closing). Projections, not guarantees.
Landlord ↔ Tenant lean methodology
- Overall (STATE)
- 73 Landlord-Friendly
- State Ohio
- 73 Landlord-Friendly · R+6
- County
- — inherits STATE
- City
- — inherits STATE
ZIP-level market 43940
- Active inventory
- 1
- Price-to-rent
- 3.4×
Monthly cashflow live
- Estimated rent
- $1,204 medium interval (Pro) →
- Mortgage (P&I)
- −$256
- Tax from tax record
- −$92 /mo · $1,105/yr
- Insurance
- −$20
- Flood insurance flood zone
- −$460 /mo · $5,525/yr
- HOA
- −$0
- Vacancy / Maint / Mgmt
- −$253
- Net cashflow
- $122
Break-even live
UW: 25.0% down · 7.5% · 30yr · 1.5% tax · 5.0% vac · 8.0% maint · 8.0% mgmt
Financing live
Cash to close
- Down payment
- $12,225
- Closing costs
- $1,467
- Reserves months
- —
- Total cash needed
- —
Loan-product check · same deal, 3 products live
Conventional
25% down · 7.5% · 30yr
- Down + closing
- —
- Monthly P&I
- —
- Monthly cashflow
- —
- DSCR
- —
- Eligible?
- —
Personal DTI + credit; lowest rate.
DSCR
20% down · 8.5% · 30yr
- Down + closing
- —
- Monthly P&I
- —
- Monthly cashflow
- —
- DSCR
- —
- Eligible?
- —
No personal income docs; deal must DSCR.
Hard money
10% down · 12.0% · 12mo
- Down + closing
- —
- Monthly P&I
- —
- Monthly cashflow
- —
- DSCR
- —
- Eligible?
- —
Short-term bridge; refi at stabilization.
Listing history 8 events
-
2026-06-19days on market $48,900 Active 8 DOM
-
2026-06-18days on market $48,900 Active 7 DOM
-
2026-06-17days on market $48,900 Active 6 DOM
-
2026-06-16days on market $48,900 Active 5 DOM
-
2026-06-15days on market $48,900 Active 4 DOM
-
2026-06-14days on market $48,900 Active 2 DOM
-
2026-06-12remarks 399-char remark
-
2026-06-12$48,900 Active 1 DOM
ⓘ Source: listings_history table (triggers on properties + properties_extension) + one-shot
backfill from property_details.listing_events for pre-trigger history.
Tax reassessment forecast OH · Partial reset (capped growth)
- Current annual tax
- $1,105 · $92/mo
- Projected year-2 tax
- $1,105 · $92/mo
- Expected delta
- $0/yr ($0/mo · 0.0%)
ⓘ Screening estimate from a state-policy table — verify with the county assessor before closing.
Climate risk First Street
- Flood 9/10 Extreme FEMA zone AE · 99% chance over 30 yrs
- Wildfire 1/10 Low
- Heat 4/10 Moderate 8 d/yr ≥97°F today · 21 d/yr by 30 yrs out
- Wind 1/10 Low
- Air quality 1/10 Low 0 unhealthy d/yr today · 0 by 30 yrs out
Nearby sold comps map
Loading sold comps map…
Walkable amenities ~0.75 mi
Loading nearby amenities…
Taxation est. · year 1
- Rental income
- $14,444
- − Mortgage interest
- −$2,739
- − Property taxes
- −$1,105
- − Insurance
- −$5,770
- − Repairs & maintenance
- −$1,155
- − Management
- −$1,155
- − Depreciation
- −$1,423
- Taxable income
- $1,096
- Est. tax owed @ 24.0%
- −$263
- After-tax cash flow
- $1,196/yr
For passive investors: Depreciation is non-cash, so a rental often shows a tax loss while cash-flowing — sheltering income. Rental losses are passive: they offset passive income freely, and up to $25,000/yr can offset ordinary (W-2) income if you actively participate and your MAGI is under $100k (phasing out to $0 by $150k); unused losses carry forward. On sale, claimed depreciation is recaptured at up to 25%, and gains may owe capital-gains tax (a 1031 exchange can defer both). Figures are a year-1 estimate at your 24.0% rate — not tax advice; consult a CPA.
Schools (NCES district)
- District
- Bellaire Local
- NCES district ID
- 3904357
- Math proficiency
- 73% ▲ 5.00%
- Reading proficiency
- 56% ▼ -3.00%
- Median HH income
- $37,307
- Composite
- 55.05/100
- National rank
- #2773
- State rank
- #430 of 802 in OH
Livability — Neffs
- Score
- 61/100
- State rank
- #938
- US rank
- #18083
Category grades
Schools grade is shown separately in the Schools card above.
Census & demographics
- Census place
- Neffs, OH
- City population
- 378
- Population (ZIP)
- 378
Population outlook (Belmont County) Hauer SSP2
- Today (2025)
- 66,568 people
- By 2030
- 64,818 · -2.6%
- By 2040
- 60,702 · -8.8%
- By 2050
- 56,427 · -15.2%
- By 2075
- 46,222 · -30.6%
- By 2100
- 34,611 · -48.0%
Race, ethnicity, and origin ACS 2023
- Neighborhood character
- Predominantly White (100%)
- Race & ethnicity
- White 100%
- Common ancestry
- Lithuanian 15% Romanian 9% Iranian 3%
Political lean MEDSL · Belmont
- 2024 margin
- Solid R (+47.3) · D 26.0% · R 73.3%
- 2008→2024 swing
- -50.0pp toward R · 2008: 2.7pp · 2024: -47.3pp
- All cycles
- 2024: R+47.3 2020: R+43.6 2016: R+39.5 2012: R+8.4 2008: D+2.7
Not yet ingested
- Civics
- —
Market trends
- HPI YoY
- —
- Current HPI
- —
- Rent YoY
- —
- Metro
- —
- State GDP YoY
- ▲ 1.98%
- F500 in state
- 48
Industry mix (Fortune 500 HQ in OH)
| Industry | F500 HQs | Revenue |
|---|---|---|
| Insurance | 3 | $145B |
|
||
| Industrial Machinery | 3 | $49B |
|
||
| Financial Services | 3 | $24B |
|
||
| Consumer Goods | 2 | $93B |
|
||
| Aerospace / Defense | 2 | $47B |
|
||
| Utilities | 2 | $33B |
|
||
Price history
-49.8% since first listed2 events — show timeline
- 2026-06-11 Listed $48,900 MLSNOW
- 2002-11-25 Sold (Public Records) $97,500 Public Records
Property tax history
+3.4%/yrLatest (2025): $1,105 · +1.4% YoY. Source: county tax records.
Cash-flow waterfall
monthlySold comps — $/sqft
last 12 mo · ≤1 miLoading sold comps…