 Triplex
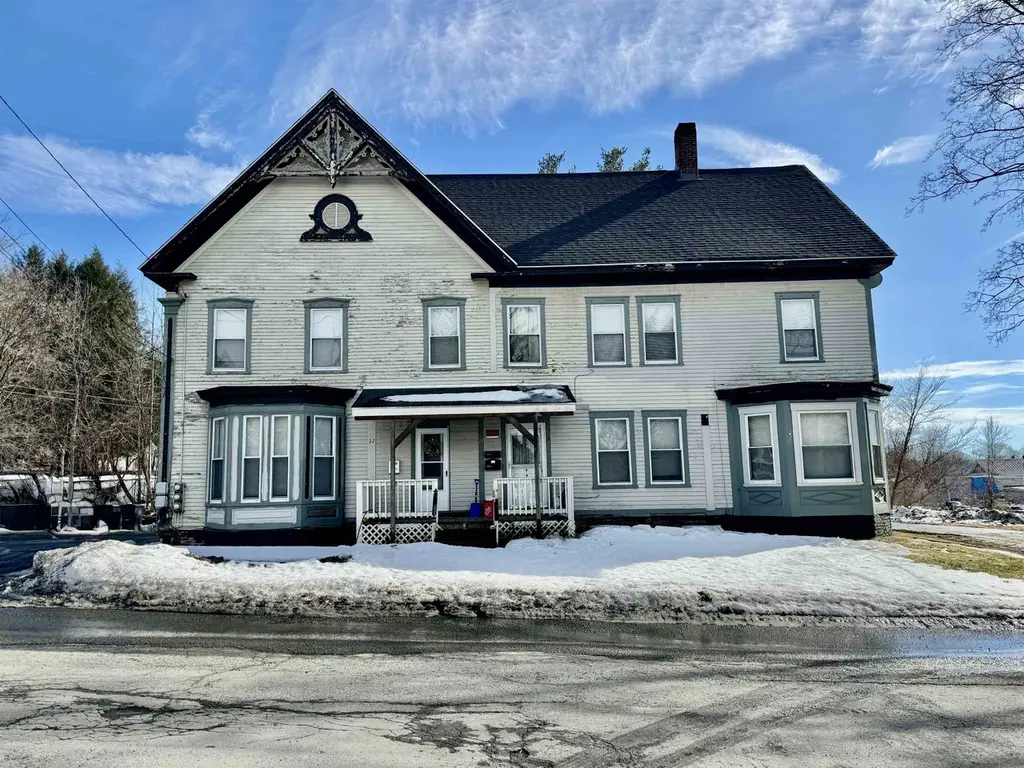
22 Tracy St · Lebanon, NH
Flood risk 6/10 · Moderate
- FEMA flood zone
- X (unshaded)
- Chance of flooding over 30 yrs
- 0.74%
- Est. flood insurance / yr
- $473 – $860
Fire risk 1/10 · Minimal
- Est. fire insurance / yr
- $507 – $941
Heat risk 3/10 · Minor
- Hot days now (above 93°F)
- 7 days/yr
- Hot days in 30 yrs
- 17 days/yr
Wind risk 3/10 · Minor
- Chance of severe wind over 30 yrs
- 5.0%
Air-quality risk 1/10 · Minimal
- Unhealthy air days now
- 0 days/yr
- Unhealthy air days in 30 yrs
- 0 days/yr
Risk factors via First Street. Map © Google.
Why this score? — see what drove the D grade
The composite is a weighted blend of 9 inputs, each scored 0–100. Each bar is that input's sub-score; the figure is the points it added to the 100-point composite (weight × sub-score).
- Cash flow +18.2/30.0
- DSCR +5.7/10.0
- 1% rule +5.3/10.0
- Schools +4.7/10.0
- Livability +3.4/5.0
- Rent growth +2.5/5.0
- Condition / age +2.5/5.0
- ARV discount +0.0/15.0
- Appreciation +0.0/10.0
$600,000
🖨 Deal sheet (PDF) 📄 Offer letter ✓ Due diligence
Multi-family units
County records classify this as Multi-Family (2-4 Unit). Listing-text estimate: 3 units. confirmed
Listing remarks MLS
Welcome to 22 Tracy Street in West Lebanon, New Hampshire. Well-maintained 3-unit multifamily offering an excellent opportunity for investors or owner-occupants alike. This property features three bright, sunny units with flexible living options. Ideally located close to shopping, dining, public transportation, and everyday amenities. Whether you're looking to add to your investment portfolio or live in one unit while generating rental income from the others, this property offers versatility and convenience in a desirable location. Tenant-occupied. Please do not disturb tenants.
Key facts
- 0.37 acre lot
- Built 1900
- Listed 101 days
Neighborhood map
What this means for you Summary
Snapshot
- This is a 3 × 2-bed/1.3-bath units multifamily listed at $600k.
Deal economics
- At list price, monthly cash flow is $538 ($6k/yr) — positive. Per door: $179/mo.
- The deal already cash-flows at list — no discount required.
- Meets the 1% rule at list price ($6k rent vs $600k).
- Recommended offer: $546k (9.0% below list) — sets the bar for market timing.
- Cap rate 7.4% vs local median 2.6% in Lebanon — top-decile yield for the area; either an underpriced asset or a hidden risk that comps aren't pricing in. Stress-test before assuming the spread holds.
Location & tenants
- Location reads 68/100 on livability (#59 in NH) — a middle-class / working-renter tenant base. Strengths: employment A+, housing A+, crime A; Watch: health & safety D, amenities F, commute F.
- Lebanon School District (town): math 48% / reading 60% proficiency, ranked #26 of 98 in NH (top 26%) — acceptable for families but not a draw, mixed tenant base, ~2y average lease.
- Zoned schools: Lebanon Middle School (math 41% / reading 59%, grade C, #22 of 96 statewide, top 23%, 471 students, 25% FRL); Lebanon High School (math 62% / reading 67%, grade B-, #14 of 90 statewide, top 17%, 598 students, 15% FRL) — zoned schools at 20% FRL track the district average.
- Market conditions: 19 active listings in the ZIP; 487 units permitted in Grafton County in 2024 (127 in 5+ unit buildings).
Forward outlook
- Local home prices are declining (-3.0%/yr); year-one equity from $4k of loan paydown is wiped out by about $18k of value loss. Plan a longer hold.
- Grafton County population projected at -13% by 2050 — secular population decline; favor cash flow + early exit over multi-decade hold.
Negotiation context
- It's been on market 102 days — a 9% lower offer ($546k) is reasonable based on typical stale-listing flexibility.
- 2 sale attempts since 9y ago with the ask held roughly flat each time — persistent listings suggest the price (not the market) is what's stuck; bring a comps-based counter.
- Current owner paid $150k; list at $600k implies a 300% gain — meaningful room to come down on a strong offer.
Risks & watch-outs
- Watch-outs: built in 1900 — expect roof / HVAC / electrical / plumbing capex.
- Climate carrying-cost: major flood risk — expect insurance premiums to compound above CPI over the hold.
Questions for the listing agent
- It's been on market 102 days. Have you received any prior offers? Is the seller open to a 9% concession, seller financing, or rate buy-down credit?
- Can we see the unit-by-unit rent roll, current vacancy, and any below-market leases? What's the average tenancy length?
- What capital expenditures (roof, boiler, parking lot, exteriors) have been made in the last 5 years, and what's planned in the next 2?
- Built in 1900 — when were the roof, HVAC, electrical panel, plumbing, and water heater last replaced?
- Why hasn't it sold? Are there any deal-killer items the seller is aware of (foundation, flood, title, zoning, code violations)?
- Is there a deadline driving the sale (1031 exchange, divorce, estate, relocation)? That informs how much negotiation room exists.
- Schools are B-rated — typically a magnet for longer-tenancy family renters. What's the average tenant stay here, and is there a school-zone premium baked into asking?
- The area grade is low — what's the realistic commute time and amenity access for the typical tenant pool here? Any planned neighborhood developments (good or bad) we should know about?
- What's the average days-on-market for RENTAL listings here right now (not sales)? A rising rental-DOM trend means longer vacancies and softer asking-rent achievability than the comps imply.
- What's the recent tenant-quality profile in this submarket — average credit score on applications, eviction rate, late-payment / NSF rate, and stable-employment percentage? A property-management company in the area should have these aggregated.
- How much new apartment / multifamily construction is in the pipeline within 1–3 miles? Heavy new supply (>2% of stock underway) typically softens rents 12–24 months out; light construction supports rent growth.
Investment metrics
- 1% rule
- 1.03% ✓
- Cap rate
- 7.37%
- Cash-on-cash
- 3.84%
- DSCR
- 1.17
- GRM
- 8.1
CMA / ARV
- ARV (median comp)
- $490,000
- List price
- $600,000
- Delta
- 22.45%
- Verdict
- OVERPRICED
- Comps
- 5 within 1.0 mi
Projected returns pro-forma
-3.0% appreciation · 3.0% rent growth · sell at horizon
- IRR
- -10.2%
- Equity multiple
- 0.63×
- Total profit
- $-62,769
- Equity at exit
- $89,462
- IRR
- -0.8%
- Equity multiple
- 0.94×
- Total profit
- $-9,673
- Equity at exit
- $51,877
Cash invested: $168,000 (down + closing). Projections, not guarantees.
Landlord ↔ Tenant lean methodology
- Overall (STATE)
- 56 Moderately Landlord-Leaning
- State New Hampshire
- 56 Moderately Landlord-Leaning · D+1
- County
- — inherits STATE
- City
- — inherits STATE
ZIP-level market 03784
- Home prices YoY
- -15.4%
- Active inventory
- 19
- Price-to-rent
- 24.2×
Monthly cashflow live
- Estimated rent
- $6,195 medium interval (Pro) →
- Mortgage (P&I)
- −$3,146
- Tax from tax record
- −$960 /mo · $11,521/yr
- Insurance
- −$250
- HOA
- −$0
- Vacancy / Maint / Mgmt
- −$1,301
- Net cashflow
- $538
Break-even live
Sensitivity live
| Price | -10% $877 | -5% $707 | +0% $538 | +5% $368 | +10% $198 |
|---|---|---|---|---|---|
| Rent | -10% $48 | -5% $293 | +0% $538 | +5% $782 | +10% $1,027 |
| Rate | -1.0pp $840 | -0.5pp $690 | base $538 | +0.5pp $382 | +1.0pp $224 |
3-unit breakdown (identical units grouped — click to expand)
| Units | Beds | Baths | Est. rent |
|---|---|---|---|
| 3× units | 2 | 1.3 | $6,195 |
| #1 | 2 | 1.3 | $2,065 |
| #2 | 2 | 1.3 | $2,065 |
| #3 | 2 | 1.3 | $2,065 |
| Total (3 units) | $6,195 | ||
UW: 25.0% down · 7.5% · 30yr · 1.5% tax · 5.0% vac · 8.0% maint · 8.0% mgmt
Financing live
Cash to close
- Down payment
- $150,000
- Closing costs
- $18,000
- Reserves months
- —
- Total cash needed
- —
Loan-product check · same deal, 3 products live
Conventional
25% down · 7.5% · 30yr
- Down + closing
- —
- Monthly P&I
- —
- Monthly cashflow
- —
- DSCR
- —
- Eligible?
- —
Personal DTI + credit; lowest rate.
DSCR
20% down · 8.5% · 30yr
- Down + closing
- —
- Monthly P&I
- —
- Monthly cashflow
- —
- DSCR
- —
- Eligible?
- —
No personal income docs; deal must DSCR.
Hard money
10% down · 12.0% · 12mo
- Down + closing
- —
- Monthly P&I
- —
- Monthly cashflow
- —
- DSCR
- —
- Eligible?
- —
Short-term bridge; refi at stabilization.
Listing history 20 events
-
2026-06-19days on market $600,000 Active 102 DOM
-
2026-06-18days on market $600,000 Active 101 DOM
-
2026-06-17days on market $600,000 Active 100 DOM
-
2026-06-16days on market $600,000 Active 99 DOM
-
2026-06-15days on market $600,000 Active 98 DOM
-
2026-06-14days on market $600,000 Active 96 DOM
-
2026-06-12days on market $600,000 Active 95 DOM
-
2026-06-09days on market $600,000 Active 92 DOM
-
2026-06-08days on market $600,000 Active 91 DOM
-
2026-06-07days on market $600,000 Active 90 DOM
-
2026-06-03days on market $600,000 Active 86 DOM
-
2026-06-02days on market $600,000 Active 85 DOM
-
2026-06-01days on market $600,000 Active 84 DOM
-
2026-05-31days on market $600,000 Active 83 DOM
-
2026-05-30days on market $600,000 Active 82 DOM
-
2026-03-09$600,000 Active 585-char remark
Show marketing remark (585 chars)
Welcome to 22 Tracy Street in West Lebanon, New Hampshire. Well-maintained 3-unit multifamily offering an excellent opportunity for investors or owner-occupants alike. This property features three bright, sunny units with flexible living options. Ideally located close to shopping, dining, public transportation, and everyday amenities. Whether you're looking to add to your investment portfolio or live in one unit while generating rental income from the others, this property offers versatility and convenience in a desirable location. Tenant-occupied. Please do not disturb tenants.
-
2018-03-14soldstatus $150,000 Closed
-
2017-12-05historical Active with Contract
-
2017-10-13price $285,000
-
2017-07-16$420,000 Active
ⓘ Source: listings_history table (triggers on properties + properties_extension) + one-shot
backfill from property_details.listing_events for pre-trigger history.
Tax reassessment forecast NH · Partial reset (capped growth)
- Current annual tax
- $11,521 · $960/mo
- Projected year-2 tax
- $12,300 · $1,025/mo
- Expected delta
- +$780/yr (+$65/mo · 6.8%)
ⓘ Screening estimate from a state-policy table — verify with the county assessor before closing.
Climate risk First Street
- Flood 6/10 Major FEMA zone X (unshaded) · 74% chance over 30 yrs
- Wildfire 1/10 Low
- Heat 3/10 Moderate 7 d/yr ≥93°F today · 17 d/yr by 30 yrs out
- Wind 3/10 Moderate 5% chance of damaging wind over 30 yrs
- Air quality 1/10 Low 0 unhealthy d/yr today · 0 by 30 yrs out
Nearby sold comps map
Loading sold comps map…
Walkable amenities ~0.75 mi
Loading nearby amenities…
Taxation est. · year 1
- Rental income
- $74,340
- − Mortgage interest
- −$33,609
- − Property taxes
- −$11,521
- − Insurance
- −$3,000
- − Repairs & maintenance
- −$5,947
- − Management
- −$5,947
- − Depreciation
- −$17,455
- Taxable loss
- −$3,139
- Est. tax savings @ 24.0%
- +$753
- After-tax cash flow
- $7,203/yr
For passive investors: Depreciation is non-cash, so a rental often shows a tax loss while cash-flowing — sheltering income. Rental losses are passive: they offset passive income freely, and up to $25,000/yr can offset ordinary (W-2) income if you actively participate and your MAGI is under $100k (phasing out to $0 by $150k); unused losses carry forward. On sale, claimed depreciation is recaptured at up to 25%, and gains may owe capital-gains tax (a 1031 exchange can defer both). Figures are a year-1 estimate at your 24.0% rate — not tax advice; consult a CPA.
Schools (NCES district)
- District
- Lebanon School District
- NCES district ID
- 3304230
- Math proficiency
- 48% ▼ -12.00%
- Reading proficiency
- 60% ▼ -6.00%
- Median HH income
- $56,648
- Composite
- 46.7/100
- National rank
- #2401
- State rank
- #26 of 98 in NH
Livability — Lebanon
- Score
- 68/100
- State rank
- #59
- US rank
- #9879
Category grades
Schools grade is shown separately in the Schools card above.
Census & demographics
- Census place
- Lebanon, NH
- City population
- 11,195
- Population (ZIP)
- 4,057
Population outlook (Grafton County) Hauer SSP2
- Today (2025)
- 88,798 people
- By 2030
- 87,131 · -1.9%
- By 2040
- 82,000 · -7.7%
- By 2050
- 77,064 · -13.2%
- By 2075
- 68,769 · -22.6%
- By 2100
- 61,631 · -30.6%
Race, ethnicity, and origin ACS 2023
- Neighborhood character
- Predominantly White (81%)
- Race & ethnicity
- White 81% Asian 13% Two or more races 4%
- Common ancestry
- Lithuanian 8% Slovak 4% Romanian 2%
- Foreign-born
- 10% · China, Canada, South Korea
- Languages at home
- 84% English-only · French/Haitian/Cajun 3% Chinese 3% Arabic 3%
Political lean MEDSL · Grafton
- 2024 margin
- D (+19.9) · D 59.4% · R 39.4% · Other 1.2%
- 2008→2024 swing
- -7.8pp toward R · 2008: 27.7pp · 2024: 19.9pp
- All cycles
- 2024: D+19.9 2020: D+24.6 2016: D+19.0 2012: D+23.8 2008: D+27.7
Not yet ingested
- Civics
- —
Market trends
- HPI YoY
- ▼ -61.24%
- Current HPI
- 336.0048
- Rent YoY
- —
- Metro
- —
- State GDP YoY
- —
- F500 in state
- 0
Price history
+42.9% since first listed5 events — show timeline
- 2026-03-09 Listed $600,000 PrimeMLS
- 2018-03-14 Sold (MLS) $150,000 PrimeMLS
- 2017-12-05 Contingent — PrimeMLS
- 2017-10-13 Price Changed $285,000 PrimeMLS
- 2017-07-16 Listed $420,000 PrimeMLS
Property tax history
+4.0%/yrLatest (2025): $11,521 · +26.3% YoY. Source: county tax records.
Cash-flow waterfall
monthlySold comps — $/sqft
last 12 mo · ≤1 miLoading sold comps…