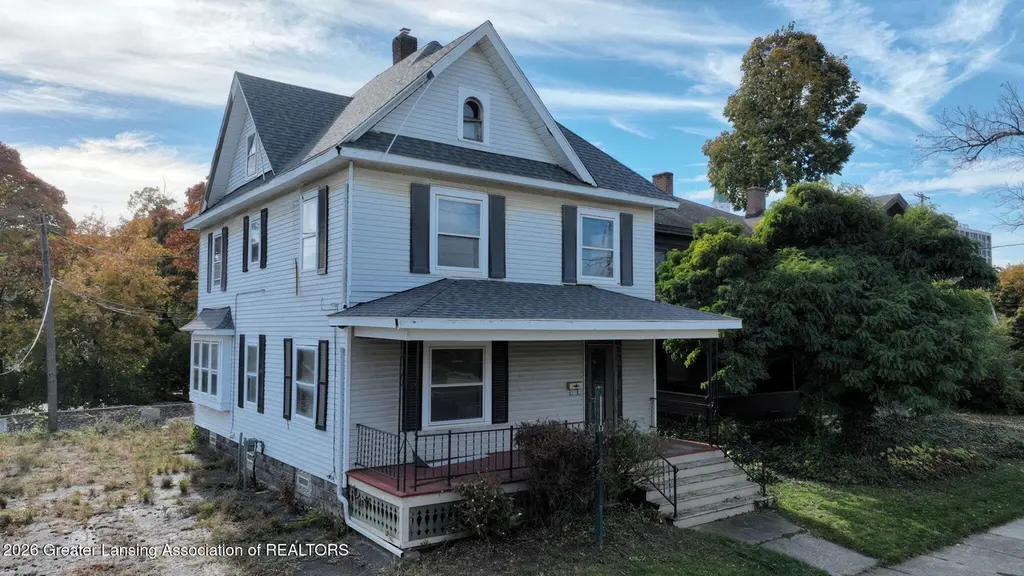
411 W Ionia St · Lansing, MI
Flood risk 1/10 · Minimal
- FEMA flood zone
- X (unshaded)
- Chance of flooding over 30 yrs
- 0.0%
- Est. flood insurance / yr
- $473 – $860
Fire risk 1/10 · Minimal
- Est. fire insurance / yr
- $784 – $1,456
Heat risk 3/10 · Minor
- Hot days now (above 97°F)
- 7 days/yr
- Hot days in 30 yrs
- 16 days/yr
Wind risk 2/10 · Minimal
- Chance of severe wind over 30 yrs
- —
Air-quality risk 2/10 · Minimal
- Unhealthy air days now
- 1 days/yr
- Unhealthy air days in 30 yrs
- 2 days/yr
Risk factors via First Street. Map © Google.
Why this score? — see what drove the C grade
The composite is a weighted blend of 9 inputs, each scored 0–100. Each bar is that input's sub-score; the figure is the points it added to the 100-point composite (weight × sub-score).
- Cash flow +17.9/30.0
- Appreciation +9.7/10.0
- ARV discount +8.0/15.0
- DSCR +5.6/10.0
- 1% rule +4.8/10.0
- Livability +4.0/5.0
- Rent growth +2.5/5.0
- Condition / age +2.2/5.0
- Schools +1.9/10.0
$169,000
🖨 Deal sheet 📄 Offer letter ✓ Due diligence
Listing remarks MLS
Whatever you can imagine can be created in this 1908 built 2 story structure with over 1900 finished square feet. If you're looking to customize the home and reside in it, you will enjoy the covered front porch, attached garage, original wall cabinet in kitchen area and updated mechanicals and roof. Could be a fantastic owner occupied or even duplex property with walkability to anywhere downtown. Vacant and Currently set up as commercial office with 4 offices on the main floor and kitchenette area with half bath. 2nd floor offers a full bath, plumbing for a 2nd kitchen area and an additional 4 office spaces. Full basement below. Newer HVAC units in both 1st floor area and 2nd floor area. Roof was a full tear off and re-shingle within the last year with all new underlayment.
Key facts
- Covered front porch
- Updated mechanicals
- Full basement
Tags
Neighborhood map
What this means for you Summary
Snapshot
- This is a 5-bed/1.5-bath single-family listed at $169k. Condition is rated fair.
Deal economics
- At list price, monthly cash flow is $143 ($2k/yr) — positive.
- The deal already cash-flows at list — no discount required.
- To meet the 1% rule (rent ≥ 1% of price), the offer needs to be $166k (1.8% below list).
- Recommended offer: $154k (9.0% below list) — sets the bar for market timing.
- Cap rate 7.3% vs local median 6.0% in Lansing — meaningfully above typical; check what's discounted (condition, days-on-market, listing class) to confirm the premium yield is real.
Location & tenants
- Location reads 79/100 on livability (#94 in MI, #2,182 nationally) — a middle-class / working-renter tenant base. Strengths: amenities A+, commute A+, cost of living A+; Watch: employment D, schools F, crime F.
- Lansing Public School District (urban): math 14% / reading 23% proficiency, ranked #650 of 760 in MI (top 86%) — low school quality limits family demand, transient renter base, plan for 1-2y turnover; 68% free/reduced lunch — lower-income household profile, screen leases tightly.
- Market conditions: 13 active listings in the ZIP; 1 comparable units currently listed for rent nearby; lower-income renter base — watch delinquency; 350 units permitted in Ingham County in 2024 (186 in 5+ unit buildings).
- At $1,660/mo this rent would consume 59% of the median local household income ($34k/yr) (locally 413% of renters already pay >50% of income on rent) — very limited rent-growth headroom before tenants either downsize or default.
Forward outlook
- In year one you build about $17k of equity ($1k loan paydown + $16k appreciation (9.4% local appreciation)).
- Ingham County population projected at +11% by 2050 — modest demand growth; plan on rents tracking national, not racing it.
- At projected returns (9.4% appreciation + 3.0% rent growth), your $47k cash investment doubles in ~3 years — after that, you're playing with house money.
- By year 3, paydown + projected appreciation supports a ~$43k cash-out refi (75% LTV) — recoverable capital for the next deal without selling this one.
Negotiation context
- It's been on market 112 days — a 9% lower offer ($154k) is reasonable based on typical stale-listing flexibility.
- 7 sale attempts since 11y ago with the ask held roughly flat each time — persistent listings suggest the price (not the market) is what's stuck; bring a comps-based counter.
Risks & watch-outs
- Watch-outs: built in 1908 — expect roof / HVAC / electrical / plumbing capex.
Questions for the listing agent
- It's been on market 112 days. Have you received any prior offers? Is the seller open to a 9% concession, seller financing, or rate buy-down credit?
- Have any recent inspections been done? Can we get a copy of the seller's disclosures and any deferred-maintenance estimates?
- Built in 1908 — when were the roof, HVAC, electrical panel, plumbing, and water heater last replaced?
- Why hasn't it sold? Are there any deal-killer items the seller is aware of (foundation, flood, title, zoning, code violations)?
- Is there a deadline driving the sale (1031 exchange, divorce, estate, relocation)? That informs how much negotiation room exists.
- Schools are F-rated, which usually means shorter tenancies and higher turnover. Who's the typical renter profile here, and what's been the actual vacancy rate?
- Crime grade is F in this area — have there been break-ins, vandalism, or insurance claims at this property in the last 3 years? What carrier currently insures it and at what premium?
- What's the average days-on-market for RENTAL listings here right now (not sales)? A rising rental-DOM trend means longer vacancies and softer asking-rent achievability than the comps imply.
- What's the recent tenant-quality profile in this submarket — average credit score on applications, eviction rate, late-payment / NSF rate, and stable-employment percentage? A property-management company in the area should have these aggregated.
- How much new for-sale + rental construction is in the pipeline within 1–3 miles? Heavy new supply typically softens prices + rents 12–24 months out; constrained supply supports both.
Investment metrics
- 1% rule
- 0.98% ✗
- Cap rate
- 7.31%
- Cash-on-cash
- 3.63%
- DSCR
- 1.16
- GRM
- 8.5
CMA / ARV
- ARV (median comp)
- $171,066
- List price
- $169,000
- Delta
- -1.21%
- Verdict
- FAIR
- Comps
- 20 within 1.0 mi
Show comp detail 12 sales within ~0.75 mi
| Address | Dist | Beds/Ba | Sqft | Sold | Price | $/sf | Match |
|---|---|---|---|---|---|---|---|
| 609 W Shiawassee St | 0.18mi | 5/2.0 | 1,830 (-4%) | 8mo | $85,000 | $46 | 77 |
| 805 Bancroft Ct | 0.38mi | 4/2.0 (-1) | 1,986 (+4%) | 7mo | $102,500 | $52 | 62 |
| 506 W Oakland Ave | 0.55mi | 4/2.5 (-1) | 1,944 (+2%) | 7mo | $113,500 | $58 | 56 |
| 412 W Madison St | 0.46mi | 4/2.0 (-1) | 1,964 (+3%) | 12mo | $190,000 | $97 | 56 |
| 815 Bancroft Ct | 0.40mi | 4/1.5 (-1) | 2,118 (+11%) | 10mo | $210,000 | $99 | 50 |
| 820 Princeton Ave | 0.67mi | 4/1.5 (-1) | 1,692 (-11%) | 4mo | $129,900 | $77 | 42 |
| 528 S Walnut St | 0.56mi | 5/1.5 | 1,638 (-14%) | 13mo | $125,000 | $76 | 40 |
| 705 Princeton Ave | 0.57mi | 4/3.0 (-1) | 1,662 (-13%) | 4mo | $115,000 | $69 | 38 |
| 1234 W Allegan St | 0.68mi | 6/4.0 (+1) | 2,118 (+11%) | 3mo | $160,000 | $76 | 33 |
| 909 N Sycamore St | 0.61mi | 4/2.0 (-1) | 1,656 (-13%) | 12mo | $135,000 | $82 | 32 |
| 1319 W Michigan Ave | 0.71mi | 4/2.0 (-1) | 1,627 (-15%) | 4mo | $172,000 | $106 | 32 |
| 1032 N Seymour Ave | 0.71mi | 4/3.5 (-1) | 2,045 (+7%) | 12mo | $220,000 | $108 | 32 |
Match score weights: distance 35% · size 25% · config 20% · recency 20%. Top-matched comps best support the ARV.
Projected returns pro-forma
9.36% appreciation · 3.0% rent growth · sell at horizon
- IRR
- 25.6%
- Equity multiple
- 2.98×
- Total profit
- $93,794
- Equity at exit
- $144,386
- IRR
- 22.7%
- Equity multiple
- 6.65×
- Total profit
- $267,390
- Equity at exit
- $303,370
Cash invested: $47,320 (down + closing). Projections, not guarantees.
Landlord ↔ Tenant lean methodology
- Overall (STATE)
- 62 Landlord-Friendly
- State Michigan
- 62 Landlord-Friendly · EVEN
- County
- — inherits STATE
- City
- — inherits STATE
ZIP-level market 48933
- Home prices YoY
- 4.1%
- Active inventory
- 13
- Price-to-rent
- 8.5×
Monthly cashflow live
- Estimated rent
- $1,660 medium interval (Pro) →
- Mortgage (P&I)
- −$886
- Tax est. 1.5%
- −$211 /mo · $2,535/yr
- Insurance
- −$70
- HOA
- −$0
- Vacancy / Maint / Mgmt
- −$349
- Net cashflow
- $143
Break-even live
UW: 25.0% down · 7.5% · 30yr · 1.5% tax · 5.0% vac · 8.0% maint · 8.0% mgmt
Financing live
Cash to close
- Down payment
- $42,250
- Closing costs
- $5,070
- Reserves months
- —
- Total cash needed
- —
Loan-product check · same deal, 3 products live
Conventional
25% down · 7.5% · 30yr
- Down + closing
- —
- Monthly P&I
- —
- Monthly cashflow
- —
- DSCR
- —
- Eligible?
- —
Personal DTI + credit; lowest rate.
DSCR
20% down · 8.5% · 30yr
- Down + closing
- —
- Monthly P&I
- —
- Monthly cashflow
- —
- DSCR
- —
- Eligible?
- —
No personal income docs; deal must DSCR.
Hard money
10% down · 12.0% · 12mo
- Down + closing
- —
- Monthly P&I
- —
- Monthly cashflow
- —
- DSCR
- —
- Eligible?
- —
Short-term bridge; refi at stabilization.
Rent comps 1 comps
| Address | Beds | Baths | Sqft | Rent | $/sqft | DOM | Units | Dist |
|---|---|---|---|---|---|---|---|---|
| 1012 Ontario St Lansing, MI | 4.0 | 2.0 | 1320 | $1,600 | $1.21 | 21d | 1 | 1.07mi |
Listing history 30 events
-
2026-06-18days on market $169,000 Active 112 DOM
-
2026-06-17days on market $169,000 Active 111 DOM
-
2026-06-16days on market $169,000 Active 110 DOM
-
2026-06-15days on market $169,000 Active 109 DOM
-
2026-06-14days on market $169,000 Active 107 DOM
-
2026-06-13days on market $169,000 Active 106 DOM
-
2026-06-10days on market $169,000 Active 104 DOM
-
2026-06-09days on market $169,000 Active 103 DOM
-
2026-06-08days on market $169,000 Active 102 DOM
-
2026-06-07days on market $169,000 Active 101 DOM
-
2026-06-05days on market $169,000 Active 98 DOM
-
2026-06-03days on market $169,000 Active 97 DOM
-
2026-06-02days on market $169,000 Active 96 DOM
-
2026-06-01days on market $169,000 Active 95 DOM
-
2026-05-31days on market $169,000 Active 94 DOM
-
2026-05-30days on market $169,000 Active 93 DOM
-
2026-02-25$169,000 Active 784-char remark
Show marketing remark (784 chars)
Whatever you can imagine can be created in this 1908 built 2 story structure with over 1900 finished square feet. If you're looking to customize the home and reside in it, you will enjoy the covered front porch, attached garage, original wall cabinet in kitchen area and updated mechanicals and roof. Could be a fantastic owner occupied or even duplex property with walkability to anywhere downtown. Vacant and Currently set up as commercial office with 4 offices on the main floor and kitchenette area with half bath. 2nd floor offers a full bath, plumbing for a 2nd kitchen area and an additional 4 office spaces. Full basement below. Newer HVAC units in both 1st floor area and 2nd floor area. Roof was a full tear off and re-shingle within the last year with all new underlayment.
-
2025-10-01historical
-
2025-06-05historical Active Under Contract
-
2025-05-23$169,000 Active
-
2024-05-21status Pending
-
2024-05-13historical
-
2024-05-13historical
-
2023-12-22$149,000 Active
-
2023-12-22$149,000
-
2016-10-12historical
-
2016-10-12historical
-
2015-10-12$89,000
-
2015-10-12$89,000
ⓘ Source: listings_history table (triggers on properties + properties_extension) + one-shot
backfill from property_details.listing_events for pre-trigger history.
Climate risk First Street
- Flood 1/10 Low FEMA zone X (unshaded) · 0% chance over 30 yrs
- Wildfire 1/10 Low
- Heat 3/10 Moderate 7 d/yr ≥97°F today · 16 d/yr by 30 yrs out
- Wind 2/10 Low
- Air quality 2/10 Low 1 unhealthy d/yr today · 2 by 30 yrs out
Nearby sold comps map
Loading sold comps map…
Walkable amenities ~0.75 mi
Loading nearby amenities…
Taxation est. · year 1
- Rental income
- $19,915
- − Mortgage interest
- −$9,467
- − Property taxes
- −$2,535
- − Insurance
- −$845
- − Repairs & maintenance
- −$1,593
- − Management
- −$1,593
- − Depreciation
- −$4,916
- Taxable loss
- −$1,034
- Est. tax savings @ 24.0%
- +$248
- After-tax cash flow
- $1,966/yr
For passive investors: Depreciation is non-cash, so a rental often shows a tax loss while cash-flowing — sheltering income. Rental losses are passive: they offset passive income freely, and up to $25,000/yr can offset ordinary (W-2) income if you actively participate and your MAGI is under $100k (phasing out to $0 by $150k); unused losses carry forward. On sale, claimed depreciation is recaptured at up to 25%, and gains may owe capital-gains tax (a 1031 exchange can defer both). Figures are a year-1 estimate at your 24.0% rate — not tax advice; consult a CPA.
Condition & rehab AI · 13 photos
This 1908-built home requires significant repairs and maintenance, including painting, landscaping, and flooring updates. While it has newer HVAC units, the overall condition is fair, and improvements can significantly enhance its value for resale or rental.
Repairs flagged
- Major Painting — Peeling paint on siding and interior walls.
- Major Landscaping — Overgrown vegetation and general lack of landscaping.
- Major Flooring — Carpeted floors in poor condition.
Value-add opportunities
- Both Painting — Fresh paint can improve the home's curb appeal and interior aesthetics, enhancing both resale and rental value.
- Both Landscaping — Well-maintained landscaping can significantly improve the home's curb appeal and attract potential buyers or renters.
- Both Flooring — Replacing worn-out carpet with a more durable and visually appealing flooring option can improve the home's overall condition and value.
Renovation cost estimate screening
| Repair item | Severity | Est. cost |
|---|---|---|
| Painting · Peeling paint on siding and interior walls. | Major | $15,000–50,000 |
| Landscaping · Overgrown vegetation and general lack of landscaping. | Major | $15,000–50,000 |
| Flooring · Carpeted floors in poor condition. | Major | $15,000–50,000 |
| Total estimated repair cost · 3 items | $45,000–150,000 |
Value-add ROI direction
- Both Painting — Fresh paint can improve the home's curb appeal and interior aesthetics, enhancing both resale and rental value. ↑
- Both Landscaping — Well-maintained landscaping can significantly improve the home's curb appeal and attract potential buyers or renters. ↑
- Both Flooring — Replacing worn-out carpet with a more durable and visually appealing flooring option can improve the home's overall condition and value. ↑
ⓘ Cost ranges are severity-bucket heuristics (US national rule-of-thumb). Get contractor quotes + a written scope before underwriting a rehab budget.
Schools (NCES district)
- District
- Lansing Public School District
- NCES district ID
- 2621150
- Math proficiency
- 14% ▲ 1.00%
- Reading proficiency
- 23% ▲ 3.00%
- Median HH income
- $37,453
- Composite
- 18.76/100
- National rank
- #14002
- State rank
- #650 of 760 in MI
Livability — Lansing
- Score
- 79/100
- State rank
- #94
- US rank
- #2182
Category grades
Schools grade is shown separately in the Schools card above.
Census & demographics
- Census place
- Lansing, MI
- County
- Ingham County · 237,052 people
- City population
- 161,269
- Metro
- Lansing-East Lansing, MI
- Population (ZIP)
- 3,107
- Household income
- $33,589
- Rent vs Own
- Severe rent burden
- 413.0
Population outlook (Ingham County) Hauer SSP2
- Today (2025)
- 300,362 people
- By 2030
- 307,808 · +2.5%
- By 2040
- 320,492 · +6.7%
- By 2050
- 333,223 · +10.9%
- By 2075
- 373,693 · +24.4%
- By 2100
- 392,021 · +30.5%
Race, ethnicity, and origin ACS 2023
- Neighborhood character
- Diverse neighborhood (Simpson 0.66)
- Race & ethnicity
- White 48% Black 33% Two or more races 10% Hispanic / Latino 7% Asian 3%
- Hispanic origin (detail)
- Mexican 4%
- Common ancestry
- Ukrainian 12% Romanian 8% Slovak 2%
- Foreign-born
- 16% · Canada, South Korea
- Languages at home
- 80% English-only · Spanish 3% Arabic 2% Other Asian/Pacific 2%
Political lean MEDSL · Ingham
- 2024 margin
- Strong D (+29.7) · D 63.9% · R 34.2% · Other 2.0%
- 2008→2024 swing
- -3.6pp toward R · 2008: 33.3pp · 2024: 29.7pp
- All cycles
- 2024: D+29.7 2020: D+32.2 2016: D+27.6 2012: D+27.9 2008: D+33.3
Not yet ingested
- Civics
- —
Market trends
- HPI YoY
- ▲ 9.36%
- Current HPI
- 237.0666
- Rent YoY
- —
- Metro
- Lansing-East Lansing, MI
- State GDP YoY
- ▲ 1.37%
- F500 in state
- 28
Industry mix (Fortune 500 HQ in MI)
| Industry | F500 HQs | Revenue |
|---|---|---|
| Automotive Parts | 3 | $48B |
|
||
| Automotive | 2 | $372B |
|
||
| Chemicals | 1 | $45B |
|
||
| Automotive Retail | 1 | $29B |
|
||
| Healthcare / Medical Devices | 1 | $23B |
|
||
| Automotive Technology | 1 | $20B |
|
||
Price history
+89.9% since first listed14 events — show timeline
- 2026-02-25 Listed $169,000 Greater Lansing AoR
- 2026-02-25 Listed $169,000 REALCOMP
- 2025-10-01 Listing Removed — REALCOMP
- 2025-06-05 Contingent — REALCOMP
- 2025-05-23 Listed $169,000 REALCOMP
- 2024-05-21 Pending — Greater Lansing AoR
- 2024-05-13 Listing Removed — REALCOMP
- 2024-05-13 Listing Removed — Greater Lansing AoR
- 2023-12-22 Listed $149,000 REALCOMP
- 2023-12-22 Listed $149,000 Greater Lansing AoR
- 2016-10-12 Listing Removed — Greater Lansing AoR
- 2016-10-12 Listing Removed — REALCOMP
- 2015-10-12 Listed $89,000 Greater Lansing AoR
- 2015-10-12 Listed $89,000 REALCOMP
Cash-flow waterfall
monthlySold comps — $/sqft
last 12 mo · ≤1 miLoading sold comps…