 Duplex
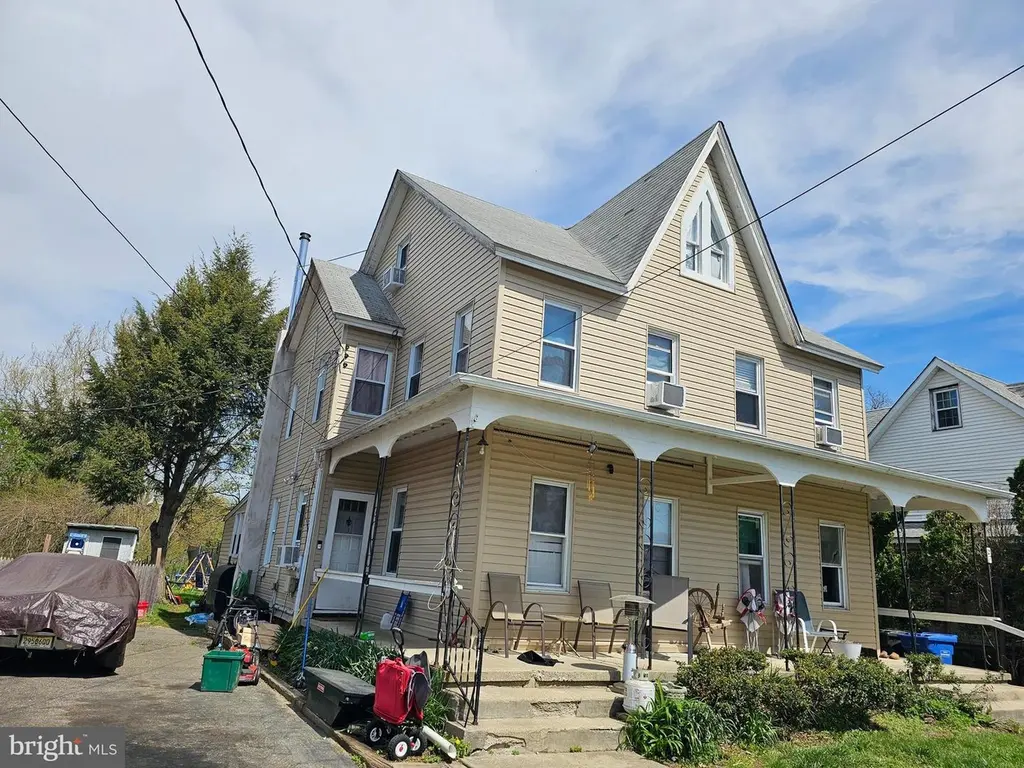
25-27 East Ave · Quinton, NJ
Flood risk 1/10 · Minimal
- FEMA flood zone
- X (unshaded)
- Chance of flooding over 30 yrs
- 0.0%
- Est. flood insurance / yr
- $507 – $1,088
Fire risk 4/10 · Minor
- Est. fire insurance / yr
- $526 – $976
Heat risk 7/10 · Major
- Hot days now (above 102°F)
- 7 days/yr
- Hot days in 30 yrs
- 15 days/yr
Wind risk 6/10 · Moderate
- Chance of severe wind over 30 yrs
- 27.0%
Air-quality risk 4/10 · Minor
- Unhealthy air days now
- 4 days/yr
- Unhealthy air days in 30 yrs
- 7 days/yr
Risk factors via First Street. Map © Google.
Why this score? — see what drove the B- grade
The composite is a weighted blend of 9 inputs, each scored 0–100. Each bar is that input's sub-score; the figure is the points it added to the 100-point composite (weight × sub-score).
- Cash flow +26.4/30.0
- DSCR +9.0/10.0
- ARV discount +7.5/15.0
- 1% rule +7.1/10.0
- Appreciation +5.0/10.0
- Schools +4.6/10.0
- Livability +3.0/5.0
- Rent growth +2.5/5.0
- Condition / age +2.2/5.0
$224,900
🖨 Deal sheet 📄 Offer letter ✓ Due diligence
Multi-family units
County records classify this as Multi-Family (2-4 Unit). Listing-text estimate: 2 units. confirmed
Listing remarks
Tenants are currently on a month to month. Live in one side as the other side helps pay the mortgage. Or rent it in it's entirety. Heat is forced air/oil on 1st & 2nd fl. 3rd floors are electric baseboard heat. Multi-family homes are hard to find in Quinton. This one is priced to sell.
Key facts
- 5,663 sq ft lot
- Built 1900
- Listed 50 days
Property features AI
Finance
- Financial info: Property is operated with month-to-month leases; Two rental units total; both currently leased
Exterior
- Parking: On-street parking
- Utilities: Public sewer; Well water; Municipal trash service
- Home design: Detached structure; Pitched roof; Vinyl siding
- Construction: Vinyl siding construction; Pitched roof; Other foundation details; Above-grade other structures
- Exterior features: Replacement windows; No tidal water
Interior
- Bedrooms: Two 3-bedroom units (both currently leased, month-to-month)
- Flooring: Fully carpeted
- Heating & cooling: Forced air heating; Electric baseboard heating; Window air conditioning units; 100 Amp electric service; Oil and electric heating fuel; Other hot water system
- Interior features: Fully carpeted floors; Unfinished basement
Neighborhood map
What this means for you Summary
Snapshot
- This is a 2 × 3-bed/?-bath units multifamily listed at $225k. Condition is rated fair.
Deal economics
- At list price, monthly cash flow is $590 ($7k/yr) — positive. Per door: $295/mo.
- The deal already cash-flows at list — no discount required.
- Meets the 1% rule at list price ($3k rent vs $225k).
- Recommended offer: $218k (3.0% below list) — sets the bar for market timing.
Location & tenants
- Location reads 60/100 on livability (#478 in NJ) — a middle-class / working-renter tenant base. Strengths: cost of living A+, housing B+; Watch: amenities F, commute F, health & safety F.
- Quinton Township School District (rural): math 45% / reading 55% proficiency, ranked #374 of 612 in NJ (top 61%) — acceptable for families but not a draw, mixed tenant base, ~2y average lease.
- Market conditions: 4 active listings in the ZIP; 95 units permitted in Salem County in 2024 (0 in 5+ unit buildings).
Forward outlook
- In year one you build about $8k of equity ($2k loan paydown + $7k appreciation (3.0% local appreciation)).
- Salem County population projected at -23% by 2050 — secular population decline; favor cash flow + early exit over multi-decade hold.
- At projected returns (3.0% appreciation + 3.0% rent growth), your $63k cash investment doubles in ~4 years — after that, you're playing with house money.
- By year 5, paydown + projected appreciation supports a ~$36k cash-out refi (75% LTV) — recoverable capital for the next deal without selling this one.
Negotiation context
- It's been on market 50 days — a 3% lower offer ($218k) is reasonable based on typical stale-listing flexibility.
- 2 sale attempts; this cycle's ask has dropped $15k (6%) from the opening price — seller is motivated, your offer sets the floor, not the list.
Risks & watch-outs
- Watch-outs: built in 1900 — expect roof / HVAC / electrical / plumbing capex.
- Climate carrying-cost: major wind risk, 27% chance of damaging wind over 30y; extreme-heat days projected 7→15/yr by 2055 (HVAC capex compounding) — expect insurance premiums to compound above CPI over the hold.
Questions for the listing agent
- It's been on market 50 days. Have you received any prior offers? Is the seller open to a 3% concession, seller financing, or rate buy-down credit?
- Can we see the unit-by-unit rent roll, current vacancy, and any below-market leases? What's the average tenancy length?
- What capital expenditures (roof, boiler, parking lot, exteriors) have been made in the last 5 years, and what's planned in the next 2?
- Have any recent inspections been done? Can we get a copy of the seller's disclosures and any deferred-maintenance estimates?
- Built in 1900 — when were the roof, HVAC, electrical panel, plumbing, and water heater last replaced?
- Is there a deadline driving the sale (1031 exchange, divorce, estate, relocation)? That informs how much negotiation room exists.
- What's the average days-on-market for RENTAL listings here right now (not sales)? A rising rental-DOM trend means longer vacancies and softer asking-rent achievability than the comps imply.
- What's the recent tenant-quality profile in this submarket — average credit score on applications, eviction rate, late-payment / NSF rate, and stable-employment percentage? A property-management company in the area should have these aggregated.
- How much new apartment / multifamily construction is in the pipeline within 1–3 miles? Heavy new supply (>2% of stock underway) typically softens rents 12–24 months out; light construction supports rent growth.
Investment metrics
- 1% rule
- 1.21% ✓
- Cap rate
- 9.44%
- Cash-on-cash
- 11.24%
- DSCR
- 1.50
- GRM
- 6.9
CMA / ARV
No comps found within radius.
Projected returns pro-forma
3.0% appreciation · 3.0% rent growth · sell at horizon
- IRR
- 18.0%
- Equity multiple
- 2.03×
- Total profit
- $64,700
- Equity at exit
- $101,125
- IRR
- 19.4%
- Equity multiple
- 3.82×
- Total profit
- $177,769
- Equity at exit
- $155,845
Cash invested: $62,972 (down + closing). Projections, not guarantees.
Landlord ↔ Tenant lean methodology
- Overall (STATE)
- 21 Tenant-Leaning
- State New Jersey
- 21 Tenant-Leaning · D+6
- County
- — inherits STATE
- City
- — inherits STATE
ZIP-level market 08072
- Active inventory
- 4
- Price-to-rent
- 13.8×
Monthly cashflow live
- Estimated rent
- $2,714 medium interval (Pro) →
- Mortgage (P&I)
- −$1,179
- Tax est. 1.5%
- −$281 /mo · $3,374/yr
- Insurance
- −$94
- HOA
- −$0
- Vacancy / Maint / Mgmt
- −$570
- Net cashflow
- $590
Break-even live
2-unit breakdown (identical units grouped — click to expand)
| Units | Beds | Baths | Est. rent |
|---|---|---|---|
| 2× units | 3 | — | $2,714 |
| #1 | 3 | — | $1,357 |
| #2 | 3 | — | $1,357 |
| Total (2 units) | $2,714 | ||
UW: 25.0% down · 7.5% · 30yr · 1.5% tax · 5.0% vac · 8.0% maint · 8.0% mgmt
Financing live
Cash to close
- Down payment
- $56,225
- Closing costs
- $6,747
- Reserves months
- —
- Total cash needed
- —
Loan-product check · same deal, 3 products live
Conventional
25% down · 7.5% · 30yr
- Down + closing
- —
- Monthly P&I
- —
- Monthly cashflow
- —
- DSCR
- —
- Eligible?
- —
Personal DTI + credit; lowest rate.
DSCR
20% down · 8.5% · 30yr
- Down + closing
- —
- Monthly P&I
- —
- Monthly cashflow
- —
- DSCR
- —
- Eligible?
- —
No personal income docs; deal must DSCR.
Hard money
10% down · 12.0% · 12mo
- Down + closing
- —
- Monthly P&I
- —
- Monthly cashflow
- —
- DSCR
- —
- Eligible?
- —
Short-term bridge; refi at stabilization.
Listing history 12 events
-
2026-06-07status $224,900 Pending 50 DOM
-
2026-06-04days on market $224,900 Active 50 DOM
-
2026-06-03days on market $224,900 Active 49 DOM
-
2026-06-02days on market $224,900 Active 48 DOM
-
2026-06-01days on market $224,900 Active 47 DOM
-
2026-05-31days on market $224,900 Active 46 DOM
-
2026-05-19price $224,900
-
2026-05-14price $229,900
-
2026-04-15$239,900 Active
-
2026-03-31historical
-
2026-02-11$259,500 Active
-
2026-01-21historical
ⓘ Source: listings_history table (triggers on properties + properties_extension) + one-shot
backfill from property_details.listing_events for pre-trigger history.
Climate risk First Street
- Flood 1/10 Low FEMA zone X (unshaded) · 0% chance over 30 yrs
- Wildfire 4/10 Moderate
- Heat 7/10 Severe 7 d/yr ≥102°F today · 15 d/yr by 30 yrs out
- Wind 6/10 Major 27% chance of damaging wind over 30 yrs
- Air quality 4/10 Moderate 4 unhealthy d/yr today · 7 by 30 yrs out
Nearby sold comps map
Loading sold comps map…
Walkable amenities ~0.75 mi
Loading nearby amenities…
Taxation est. · year 1
- Rental income
- $32,568
- − Mortgage interest
- −$12,598
- − Property taxes
- −$3,374
- − Insurance
- −$1,124
- − Repairs & maintenance
- −$2,605
- − Management
- −$2,605
- − Depreciation
- −$6,543
- Taxable income
- $3,719
- Est. tax owed @ 24.0%
- −$892
- After-tax cash flow
- $6,185/yr
For passive investors: Depreciation is non-cash, so a rental often shows a tax loss while cash-flowing — sheltering income. Rental losses are passive: they offset passive income freely, and up to $25,000/yr can offset ordinary (W-2) income if you actively participate and your MAGI is under $100k (phasing out to $0 by $150k); unused losses carry forward. On sale, claimed depreciation is recaptured at up to 25%, and gains may owe capital-gains tax (a 1031 exchange can defer both). Figures are a year-1 estimate at your 24.0% rate — not tax advice; consult a CPA.
Condition & rehab AI · 1 photo
This multi-family home requires moderate renovations to improve its exterior, interior, and curb appeal, significantly increasing its resale and rental value.
Repairs flagged
- Major exterior siding — Significant wear and tear
- Major flooring — Worn carpet
- Major interior walls/paint — Painted walls with visible wear
Value-add opportunities
- Both Painting and repainting the exterior siding — Enhances curb appeal and value
- Both Replacing worn carpet with new flooring — Improves living space and rental appeal
- Both Painting interior walls and trim — Enhances interior appearance and rental appeal
Renovation cost estimate screening
| Repair item | Severity | Est. cost |
|---|---|---|
| exterior siding · Significant wear and tear | Major | $15,000–50,000 |
| flooring · Worn carpet | Major | $15,000–50,000 |
| interior walls/paint · Painted walls with visible wear | Major | $15,000–50,000 |
| Total estimated repair cost · 3 items | $45,000–150,000 |
Value-add ROI direction
- Both Painting and repainting the exterior siding — Enhances curb appeal and value ↑
- Both Replacing worn carpet with new flooring — Improves living space and rental appeal ↑
- Both Painting interior walls and trim — Enhances interior appearance and rental appeal ↑
ⓘ Cost ranges are severity-bucket heuristics (US national rule-of-thumb). Get contractor quotes + a written scope before underwriting a rehab budget.
Schools (NCES district)
- District
- Quinton Township School District
- NCES district ID
- 3413500
- Math proficiency
- 45% ▼ -3.00%
- Reading proficiency
- 55% ▲ 2.00%
- Median HH income
- $62,197
- Composite
- 45.94/100
- National rank
- #5537
- State rank
- #374 of 612 in NJ
Livability — Quinton
- Score
- 60/100
- State rank
- #478
- US rank
- #18522
Category grades
Schools grade is shown separately in the Schools card above.
Census & demographics
- Census place
- Quinton, NJ
- City population
- 173
- Population (ZIP)
- 173
Population outlook (Salem County) Hauer SSP2
- Today (2025)
- 59,905 people
- By 2030
- 57,351 · -4.3%
- By 2040
- 51,837 · -13.5%
- By 2050
- 46,356 · -22.6%
- By 2075
- 36,452 · -39.2%
- By 2100
- 28,907 · -51.7%
Race, ethnicity, and origin ACS 2023
- Neighborhood character
- Predominantly White (99%)
- Race & ethnicity
- White 99%
Political lean MEDSL · Salem
- 2024 margin
- R (+19.2) · D 39.6% · R 58.8% · Other 1.6%
- 2008→2024 swing
- -23.1pp toward R · 2008: 3.9pp · 2024: -19.2pp
- All cycles
- 2024: R+19.2 2020: R+12.8 2016: R+15.4 2012: D+0.8 2008: D+3.9
Not yet ingested
- Civics
- —
Market trends
- HPI YoY
- —
- Current HPI
- —
- Rent YoY
- —
- Metro
- —
- State GDP YoY
- ▲ 2.05%
- F500 in state
- 34
Industry mix (Fortune 500 HQ in NJ)
| Industry | F500 HQs | Revenue |
|---|---|---|
| Consumer Goods | 3 | $31B |
|
||
| Pharmaceuticals | 2 | $153B |
|
||
| Technology | 2 | $21B |
|
||
| Insurance | 2 | $20B |
|
||
| Healthcare | 2 | $19B |
|
||
| Financial Services | 1 | $70B |
|
||
Price history
-13.3% since first listed6 events — show timeline
- 2026-05-19 Price Changed $224,900 BRIGHT MLS
- 2026-05-14 Price Changed $229,900 BRIGHT MLS
- 2026-04-15 Listed $239,900 BRIGHT MLS
- 2026-03-31 Listing Removed — BRIGHT MLS
- 2026-02-11 Listed $259,500 BRIGHT MLS
- 2026-01-21 Coming Soon — BRIGHT MLS
Cash-flow waterfall
monthlySold comps — $/sqft
last 12 mo · ≤1 miLoading sold comps…