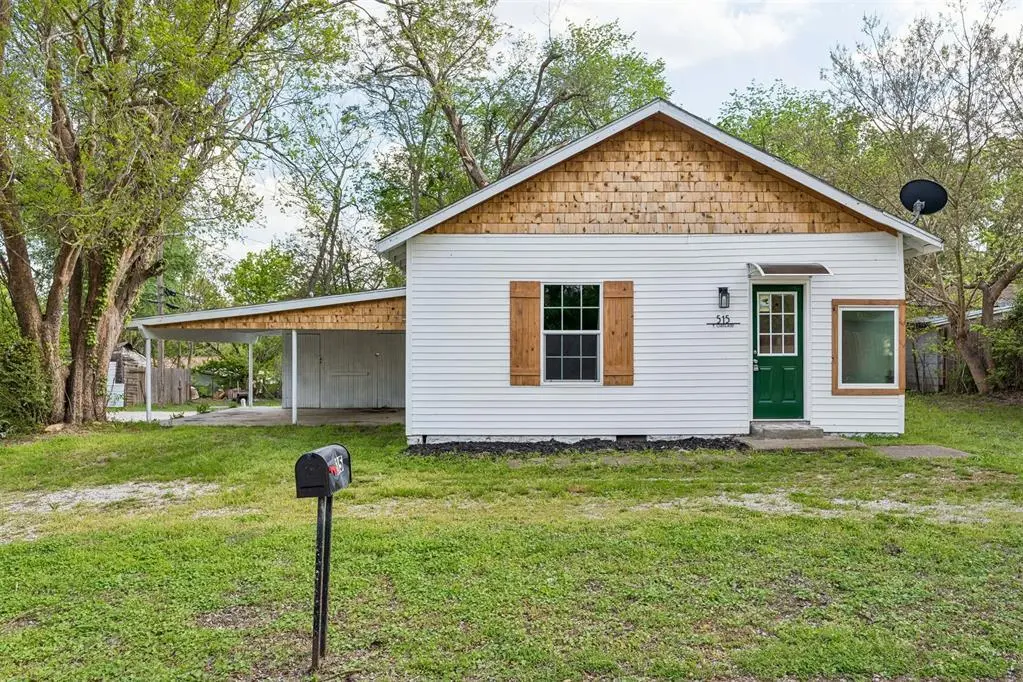
515 E Oakland St · Shawnee, OK
Flood risk 1/10 · Minimal
- FEMA flood zone
- X (unshaded)
- Chance of flooding over 30 yrs
- 0.0%
- Est. flood insurance / yr
- $507 – $1,088
Fire risk 7/10 · Major
- Est. fire insurance / yr
- $2,463 – $4,575
Heat risk 5/10 · Moderate
- Hot days now (above 109°F)
- 7 days/yr
- Hot days in 30 yrs
- 18 days/yr
Wind risk 3/10 · Minor
- Chance of severe wind over 30 yrs
- 5.0%
Air-quality risk 2/10 · Minimal
- Unhealthy air days now
- 1 days/yr
- Unhealthy air days in 30 yrs
- 1 days/yr
Risk factors via First Street. Map © Google.
Why this score? — see what drove the B- grade
The composite is a weighted blend of 9 inputs, each scored 0–100. Each bar is that input's sub-score; the figure is the points it added to the 100-point composite (weight × sub-score).
- Cash flow +30.0/30.0
- DSCR +10.0/10.0
- 1% rule +7.5/10.0
- ARV discount +7.5/15.0
- Rent growth +3.2/5.0
- Livability +3.2/5.0
- Appreciation +2.7/10.0
- Condition / age +2.5/5.0
- Schools +1.1/10.0
$99,900
🖨 Deal sheet (PDF) 📄 Offer letter ✓ Due diligence
Listing remarks
Fully remodeled 2-bed, 1-bath, 768 sq ft home that feels brand-new the moment you step inside. This move-in-ready property offers a bright, open layout with all-new finishes throughout, making it perfect for first-time buyers, downsizers, or anyone wanting a clean, modern space without the hassle of renovations. The home has been updated from top to bottom, featuring a beautifully refreshed kitchen, new flooring, fresh paint, and a completely renovated bathroom. Natural light fills the interior, creating a warm and inviting atmosphere in every room. Outside, the manageable yard provides space to relax, garden, or entertain. Conveniently located near local shopping, dining, and schools, this
Key facts
- 3,498 sq ft lot
- Garage
- Built 1935
Property features AI
Finance
- Other: Taxes listed (amount provided); No conditions affecting sale; Not occupied; Days on market: 42
- Financial info: Assumable status: Unknown; Loan qualification: Unknown; Current price: $102,900
- HOA & community: No mandatory association dues
Exterior
- Parking: 1-car garage
- Utilities: Manual geocode (location verified)
- Home design: Single family residence; One-story; Residential property; Existing property
- Construction: Vinyl siding; Composition roof; Conventional foundation; Built (existing structure)
- Exterior features: Covered patio; Outbuildings; Interior lot
Interior
- Bedrooms: 2 bedrooms
- Bathrooms: 1 full bathroom
- Heating & cooling: Electric heating
- Interior features: One living area; No fireplace; No study
Neighborhood map
What this means for you Summary
Snapshot
- This is a 3-bed/1.0-bath single-family listed at $100k.
Deal economics
- At list price, monthly cash flow is $387 ($5k/yr) — positive.
- The deal already cash-flows at list — no discount required.
- Meets the 1% rule at list price ($1k rent vs $100k).
- Recommended offer: $94k (6.0% below list) — sets the bar for market timing.
- Cap rate 10.9% vs local median 3.9% in Shawnee — top-decile yield for the area; either an underpriced asset or a hidden risk that comps aren't pricing in. Stress-test before assuming the spread holds.
Location & tenants
- Location reads 63/100 on livability (#217 in OK) — a middle-class / working-renter tenant base. Strengths: cost of living A+, housing A+; Watch: crime F, amenities F, commute F.
- Shawnee (town): math 11% / reading 17% proficiency, ranked #238 of 270 in OK (top 88%) — low school quality limits family demand, transient renter base, plan for 1-2y turnover; 70% free/reduced lunch — lower-income household profile, screen leases tightly.
- Zoned schools: Horace Mann Es (math 12% / reading 12%, grade F, #667 of 845 statewide, top 82%, 225 students, 0% FRL); Shawnee Ms (math 6% / reading 14%, grade F, #277 of 345 statewide, top 83%, 711 students, 0% FRL); Shawnee Hs (math 16% / reading 35%, grade F, #142 of 447 statewide, top 32%, 987 students, 0% FRL) — zoned schools average 0% FRL vs 70% district-wide (70 pts lower); this property's tenant base skews higher-income than the district average.
- Market conditions: Rents rising (+2.8%/yr); 192 active listings in the ZIP; 2 comparable units currently listed for rent nearby; 183 units permitted in Pottawatomie County in 2024 (16 in 5+ unit buildings).
Forward outlook
- Local home prices are declining (-3.0%/yr); year-one equity from $691 of loan paydown is wiped out by about $3k of value loss. Plan a longer hold.
- Pottawatomie County population projected at +12% by 2050 — modest demand growth; plan on rents tracking national, not racing it.
- At projected returns (-3.0% appreciation + 2.8% rent growth), your $28k cash investment doubles in ~8 years — after that, you're playing with house money.
Negotiation context
- It's been on market 74 days — a 6% lower offer ($94k) is reasonable based on typical stale-listing flexibility.
- 4 sale attempts since 2y ago with the ask held roughly flat each time — persistent listings suggest the price (not the market) is what's stuck; bring a comps-based counter.
- Current owner paid $25k; list at $100k implies a 300% gain — meaningful room to come down on a strong offer.
Risks & watch-outs
- Watch-outs: built in 1935 — expect roof / HVAC / electrical / plumbing capex.
- Climate carrying-cost: major wildfire risk; extreme-heat days projected 7→18/yr by 2055 (HVAC capex compounding) — expect insurance premiums to compound above CPI over the hold.
Questions for the listing agent
- It's been on market 74 days. Have you received any prior offers? Is the seller open to a 6% concession, seller financing, or rate buy-down credit?
- Built in 1935 — when were the roof, HVAC, electrical panel, plumbing, and water heater last replaced?
- Why hasn't it sold? Are there any deal-killer items the seller is aware of (foundation, flood, title, zoning, code violations)?
- Is there a deadline driving the sale (1031 exchange, divorce, estate, relocation)? That informs how much negotiation room exists.
- Schools are F-rated, which usually means shorter tenancies and higher turnover. Who's the typical renter profile here, and what's been the actual vacancy rate?
- Crime grade is F in this area — have there been break-ins, vandalism, or insurance claims at this property in the last 3 years? What carrier currently insures it and at what premium?
- What's the average days-on-market for RENTAL listings here right now (not sales)? A rising rental-DOM trend means longer vacancies and softer asking-rent achievability than the comps imply.
- What's the recent tenant-quality profile in this submarket — average credit score on applications, eviction rate, late-payment / NSF rate, and stable-employment percentage? A property-management company in the area should have these aggregated.
- How much new for-sale + rental construction is in the pipeline within 1–3 miles? Heavy new supply typically softens prices + rents 12–24 months out; constrained supply supports both.
Investment metrics
- 1% rule
- 1.25% ✓
- Cap rate
- 10.94%
- Cash-on-cash
- 16.60%
- DSCR
- 1.74
- GRM
- 6.7
CMA / ARV
- ARV (on-the-fly)
- $49,152
- Comps found
- 12
Show comp detail 12 sales within ~0.75 mi
| Address | Dist | Beds/Ba | Sqft | Sold | Price | $/sf | Match |
|---|---|---|---|---|---|---|---|
| 824 S Bell Ave | 0.49mi | 2/1.0 (-1) | 760 (-1%) | 3mo | $43,500 | $57 | 68 |
| 913 Buck Dr | 0.44mi | 2/1.0 (-1) | 800 (+4%) | 3mo | $43,529 | $54 | 65 |
| 909 Buck Dr | 0.42mi | 2/1.0 (-1) | 750 (-2%) | 11mo | $114,000 | $152 | 62 |
| 7 E Farrall | 0.40mi | 3/1.0 | 684 (-11%) | 3mo | $43,500 | $64 | 61 |
| 803 S Bell Ave | 0.43mi | 2/1.0 (-1) | 852 (+11%) | 3mo | $43,000 | $50 | 54 |
| 718 E 11th St | 0.54mi | 2/1.0 (-1) | 756 (-2%) | 20mo | $35,000 | $46 | 51 |
| 129 N Shawnee Ave | 0.52mi | 2/1.0 (-1) | 720 (-6%) | 19mo | $80,000 | $111 | 44 |
| 833 S Union Ave | 0.45mi | 2/1.0 (-1) | 850 (+11%) | 16mo | $80,000 | $94 | 43 |
| 604 N Tucker Ave | 0.69mi | 2/1.0 (-1) | 864 (+12%) | 3mo | $51,100 | $59 | 40 |
| 606 N Tucker Ave | 0.70mi | 2/1.0 (-1) | 732 (-5%) | 20mo | $89,900 | $123 | 38 |
| 134 S Osage Ave | 0.73mi | 2/1.5 (-1) | 736 (-4%) | 21mo | $23,500 | $32 | 35 |
| 414 N Tucker Ave | 0.55mi | 2/2.0 (-1) | 863 (+12%) | 22mo | $149,900 | $174 | 26 |
Match score weights: distance 35% · size 25% · config 20% · recency 20%. Top-matched comps best support the ARV.
Projected returns pro-forma
-3.0% appreciation · 2.82% rent growth · sell at horizon
- IRR
- 7.5%
- Equity multiple
- 1.29×
- Total profit
- $8,194
- Equity at exit
- $14,895
- IRR
- 16.6%
- Equity multiple
- 2.35×
- Total profit
- $37,797
- Equity at exit
- $8,638
Cash invested: $27,972 (down + closing). Projections, not guarantees.
Landlord ↔ Tenant lean methodology
- Overall (STATE)
- 83 Strongly Landlord-Friendly
- State Oklahoma
- 83 Strongly Landlord-Friendly · R+20
- County
- — inherits STATE
- City
- — inherits STATE
ZIP-level market 74801
- Home prices YoY
- -1.7%
- Rents YoY
- 2.8%
- Active inventory
- 192
- Price-to-rent
- 6.7×
Monthly cashflow live
- Estimated rent
- $1,250 medium interval (Pro) →
- Mortgage (P&I)
- −$524
- Tax from tax record
- −$35 /mo · $424/yr
- Insurance
- −$42
- HOA
- −$0
- Vacancy / Maint / Mgmt
- −$263
- Net cashflow
- $387
Break-even live
Sensitivity live
| Price | -10% $443 | -5% $415 | +0% $387 | +5% $359 | +10% $330 |
|---|---|---|---|---|---|
| Rent | -10% $288 | -5% $338 | +0% $387 | +5% $436 | +10% $486 |
| Rate | -1.0pp $437 | -0.5pp $412 | base $387 | +0.5pp $361 | +1.0pp $335 |
UW: 25.0% down · 7.5% · 30yr · 1.5% tax · 5.0% vac · 8.0% maint · 8.0% mgmt
Financing live
Cash to close
- Down payment
- $24,975
- Closing costs
- $2,997
- Reserves months
- —
- Total cash needed
- —
Loan-product check · same deal, 3 products live
Conventional
25% down · 7.5% · 30yr
- Down + closing
- —
- Monthly P&I
- —
- Monthly cashflow
- —
- DSCR
- —
- Eligible?
- —
Personal DTI + credit; lowest rate.
DSCR
20% down · 8.5% · 30yr
- Down + closing
- —
- Monthly P&I
- —
- Monthly cashflow
- —
- DSCR
- —
- Eligible?
- —
No personal income docs; deal must DSCR.
Hard money
10% down · 12.0% · 12mo
- Down + closing
- —
- Monthly P&I
- —
- Monthly cashflow
- —
- DSCR
- —
- Eligible?
- —
Short-term bridge; refi at stabilization.
Rent comps 2 comps
| Address | Beds | Baths | Sqft | Rent | $/sqft | DOM | Units | Dist |
|---|---|---|---|---|---|---|---|---|
| 414 N Aydelotte Ave Shawnee, OK | 2.0 | 2.0 | 864 | $1,250 | $1.45 | 6d | 1 | 0.97mi |
| 315 S Kennedy Ave Shawnee, OK | 2.0–3.0 | 1.0–2.0 | 979 | $898 | $0.92 | 25d | 5 | 1.13mi |
Listing history 35 events
-
2026-06-21days on market $99,900 Active 74 DOM
-
2026-06-19days on market $99,900 Active 72 DOM
-
2026-06-18days on market $99,900 Active 71 DOM
-
2026-06-17days on market $99,900 Active 70 DOM
-
2026-06-16days on market $99,900 Active 69 DOM
-
2026-06-15days on market $99,900 Active 68 DOM
-
2026-06-14days on market $99,900 Active 66 DOM
-
2026-06-12days on market $99,900 Active 65 DOM
-
2026-06-09days on market $99,900 Active 62 DOM
-
2026-06-09price $99,900 Active 61 DOM
-
2026-06-08days on market $102,900 Active 61 DOM
-
2026-06-07days on market $102,900 Active 60 DOM
-
2026-06-05days on market $102,900 Active 57 DOM
-
2026-06-02days on market $102,900 Active 55 DOM
-
2026-06-01days on market $102,900 Active 54 DOM
-
2026-05-31days on market $102,900 Active 53 DOM
-
2026-05-30days on market $102,900 Active 52 DOM
-
2026-05-20price $102,900
-
2026-04-08$104,900 Active
-
2026-02-27historical
-
2026-01-06price $105,000
-
2025-12-19$109,000 Active
-
2025-12-15historical
-
2025-11-22price $109,000
-
2025-10-30price $112,500
-
2025-09-27price $114,900
-
2025-08-31$120,000 Active
-
2025-01-31soldstatus $25,000 Closed
-
2025-01-18status Pending
-
2024-12-12price $50,000
-
2024-11-13price $58,000
-
2024-10-20price $59,000
-
2024-10-12$60,000 Active
-
2016-10-05soldstatus $34,000
-
1998-09-29soldstatus $5,000
ⓘ Source: listings_history table (triggers on properties + properties_extension) + one-shot
backfill from property_details.listing_events for pre-trigger history.
Tax reassessment forecast OK · Resets to sale price
- Current annual tax
- $424 · $35/mo
- Projected year-2 tax
- $899 · $75/mo
- Expected delta
- +$475/yr (+$40/mo · 112.1%)
ⓘ Screening estimate from a state-policy table — verify with the county assessor before closing.
Climate risk First Street
- Flood 1/10 Low FEMA zone X (unshaded) · 0% chance over 30 yrs
- Wildfire 7/10 Severe
- Heat 5/10 Major 7 d/yr ≥109°F today · 18 d/yr by 30 yrs out
- Wind 3/10 Moderate 5% chance of damaging wind over 30 yrs
- Air quality 2/10 Low 1 unhealthy d/yr today · 1 by 30 yrs out
Nearby sold comps map
Loading sold comps map…
Walkable amenities ~0.75 mi
Loading nearby amenities…
Taxation est. · year 1
- Rental income
- $15,004
- − Mortgage interest
- −$5,596
- − Property taxes
- −$424
- − Insurance
- −$500
- − Repairs & maintenance
- −$1,200
- − Management
- −$1,200
- − Depreciation
- −$2,906
- Taxable income
- $3,178
- Est. tax owed @ 24.0%
- −$763
- After-tax cash flow
- $3,880/yr
For passive investors: Depreciation is non-cash, so a rental often shows a tax loss while cash-flowing — sheltering income. Rental losses are passive: they offset passive income freely, and up to $25,000/yr can offset ordinary (W-2) income if you actively participate and your MAGI is under $100k (phasing out to $0 by $150k); unused losses carry forward. On sale, claimed depreciation is recaptured at up to 25%, and gains may owe capital-gains tax (a 1031 exchange can defer both). Figures are a year-1 estimate at your 24.0% rate — not tax advice; consult a CPA.
Schools (NCES district)
- District
- Shawnee
- NCES district ID
- 4027570
- Math proficiency
- 11% ▼ -10.00%
- Reading proficiency
- 17% ▼ -10.00%
- Median HH income
- $32,128
- Composite
- 11.21/100
- National rank
- #9724
- State rank
- #238 of 270 in OK
Livability — Shawnee
- Score
- 63/100
- State rank
- #217
- US rank
- #15593
Category grades
Schools grade is shown separately in the Schools card above.
Census & demographics
- Census place
- Shawnee, OK
- County
- Pottawatomie County · 45,194 people
- City population
- 45,194
- Metro
- Shawnee, OK
- Population (ZIP)
- 21,967
- Household income
- $55,077
- Rent vs Own
- Severe rent burden
- 594.0
Population outlook (Pottawatomie County) Hauer SSP2
- Today (2025)
- 76,622 people
- By 2030
- 78,816 · +2.9%
- By 2040
- 82,766 · +8.0%
- By 2050
- 86,031 · +12.3%
- By 2075
- 93,316 · +21.8%
- By 2100
- 95,820 · +25.1%
Race, ethnicity, and origin ACS 2023
- Neighborhood character
- Predominantly White (67%)
- Race & ethnicity
- White 67% Native American 15% Two or more races 10% Hispanic / Latino 7% Black 3%
- Hispanic origin (detail)
- Mexican 6%
- Common ancestry
- Lithuanian 1% Slovak 1% Italian 1%
- Foreign-born
- 2% · Canada
- Languages at home
- 96% English-only · Spanish 2% Other Asian/Pacific 1%
Political lean MEDSL · Pottawatomie
- 2024 margin
- Solid R (+47.4) · D 25.2% · R 72.7% · Other 2.1%
- 2008→2024 swing
- -9.1pp toward R · 2008: -38.4pp · 2024: -47.4pp
- All cycles
- 2024: R+47.4 2020: R+46.0 2016: R+46.5 2012: R+38.7 2008: R+38.4
Not yet ingested
- Civics
- —
Market trends
- HPI YoY
- ▼ -4.66%
- Current HPI
- 266.7965
- Rent YoY
- ▲ 2.82%
- Metro
- Shawnee, OK
- State GDP YoY
- ▲ 1.55%
- F500 in state
- 6
Industry mix (Fortune 500 HQ in OK)
| Industry | F500 HQs | Revenue |
|---|---|---|
| Energy | 3 | $48B |
|
||
Price history
+1958.0% since first listed18 events — show timeline
- 2026-05-20 Price Changed $102,900 MLSOK
- 2026-04-08 Listed $104,900 MLSOK
- 2026-02-27 Listing Removed — MLSOK
- 2026-01-06 Price Changed $105,000 MLSOK
- 2025-12-19 Listed $109,000 MLSOK
- 2025-12-15 Listing Removed — MLSOK
- 2025-11-22 Price Changed $109,000 MLSOK
- 2025-10-30 Price Changed $112,500 MLSOK
- 2025-09-27 Price Changed $114,900 MLSOK
- 2025-08-31 Listed $120,000 MLSOK
- 2025-01-31 Sold (MLS) $25,000 MLSOK
- 2025-01-18 Pending — MLSOK
- 2024-12-12 Price Changed $50,000 MLSOK
- 2024-11-13 Price Changed $58,000 MLSOK
- 2024-10-20 Price Changed $59,000 MLSOK
- 2024-10-12 Listed $60,000 MLSOK
- 2016-10-05 Sold (Public Records) $34,000 Public Records
- 1998-09-29 Sold (Public Records) $5,000 Public Records
Property tax history
+13.2%/yrLatest (2025): $424 · +4.2% YoY. Source: county tax records.
Cash-flow waterfall
monthlySold comps — $/sqft
last 12 mo · ≤1 miLoading sold comps…