5863 Southgood St · Houston, TX
Flood risk 6/10 · Moderate
- FEMA flood zone
- X (unshaded)
- Chance of flooding over 30 yrs
- 0.71%
- Est. flood insurance / yr
- $507 – $1,088
Fire risk 1/10 · Minimal
- Est. fire insurance / yr
- $1,222 – $2,270
Heat risk 9/10 · Severe
- Hot days now (above 109°F)
- 7 days/yr
- Hot days in 30 yrs
- 24 days/yr
Wind risk 9/10 · Severe
- Chance of severe wind over 30 yrs
- 99.0%
Air-quality risk 2/10 · Minimal
- Unhealthy air days now
- 2 days/yr
- Unhealthy air days in 30 yrs
- 2 days/yr
Risk factors via First Street. Map © Google.
Why this score? — see what drove the B- grade
The composite is a weighted blend of 9 inputs, each scored 0–100. Each bar is that input's sub-score; the figure is the points it added to the 100-point composite (weight × sub-score).
- Cash flow +30.0/30.0
- DSCR +10.0/10.0
- ARV discount +9.2/15.0
- 1% rule +7.8/10.0
- Rent growth +3.9/5.0
- Livability +3.7/5.0
- Schools +2.7/10.0
- Condition / age +2.5/5.0
- Appreciation +0.0/10.0
$149,999
🖨 Deal sheet (PDF) 📄 Offer letter ✓ Due diligence
Listing remarks MLS
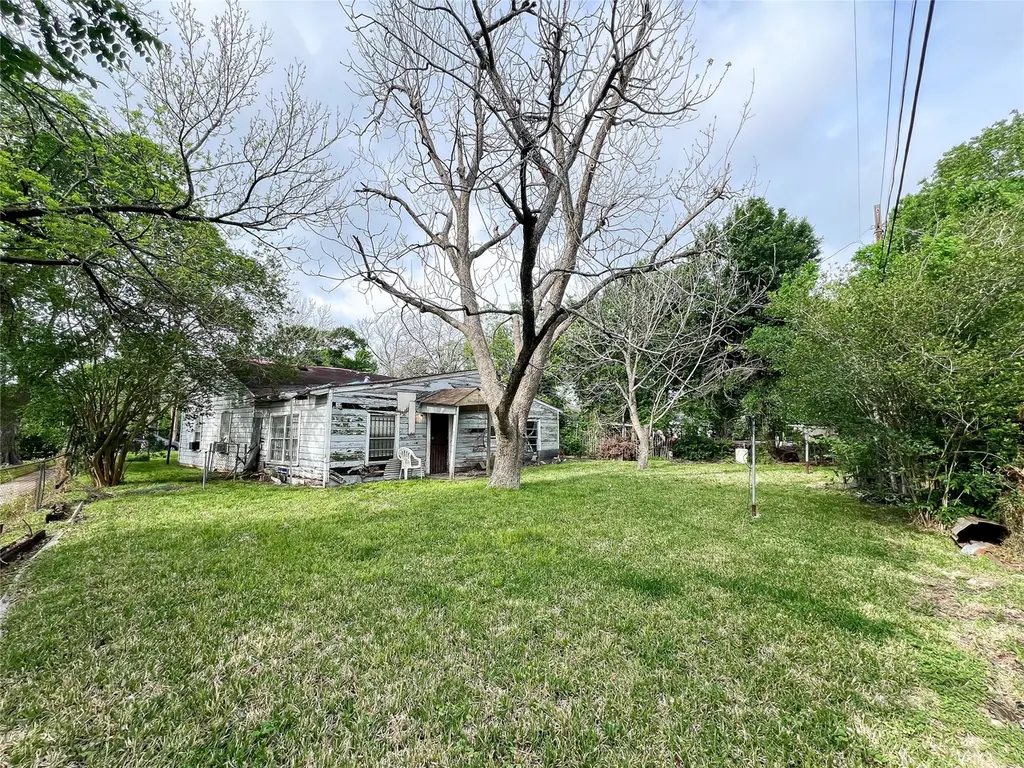
INVESTOR SPECIAL! Spacious property with endless potential—being sold as-is and priced to reflect a fantastic investment opportunity. Ideally located just minutes from NRG Stadium, the Texas Medical Center, and I-610, this home combines convenience with upside potential in a high-demand area. Situated near Downtown Houston, this home sits on a large corner lot with plenty of room for expansion or redevelopment. Whether you’re looking to renovate, build new, or create a duplex for added income potential, this property offers the flexibility to bring your vision to life. Don’t miss your chance to invest in a rapidly growing area with strong upside.
Key facts
- Large corner lot
- Room for expansion
- Redevelopment
Tags
Neighborhood map
What this means for you Summary
Snapshot
- This is a 3-bed/2.0-bath single-family listed at $150k.
Deal economics
- At list price, monthly cash flow is $595 ($7k/yr) — positive.
- The deal already cash-flows at list — no discount required.
- Meets the 1% rule at list price ($2k rent vs $150k).
- Recommended offer: $141k (6.0% below list) — sets the bar for market timing.
- Cap rate 11.1% vs local median 3.2% in Houston — top-decile yield for the area; either an underpriced asset or a hidden risk that comps aren't pricing in. Stress-test before assuming the spread holds.
Location & tenants
- Location reads 74/100 on livability (#184 in TX, #4,771 nationally) — a middle-class / working-renter tenant base. Strengths: amenities A+, cost of living A+, housing A+; Watch: schools D, crime F.
- Houston ISD (urban): math 27% / reading 35% proficiency, ranked #593 of 826 in TX (top 72%) — families likely to look elsewhere, expect single-tenant / working-renter base with shorter leases; 71% free/reduced lunch — lower-income household profile, screen leases tightly.
- Market conditions: Rents rising fast (+5.5%/yr); 345 active listings in the ZIP; 38 comparable units currently listed for rent nearby; rentals at typical pace (median 19d on market — plan ~3-4 weeks tenant-placement turnaround); lower-income renter base — watch delinquency; 29,883 units permitted in Harris County in 2024 (8,621 in 5+ unit buildings).
- At $1,926/mo this rent would consume 61% of the median local household income ($38k/yr) (locally 1728% of renters already pay >50% of income on rent) — very limited rent-growth headroom before tenants either downsize or default.
Forward outlook
- Local home prices are declining (-3.0%/yr); year-one equity from $1k of loan paydown is wiped out by about $4k of value loss. Plan a longer hold.
- Harris County population projected at +47% by 2050 — long-run rental-demand tailwind backs the buy-and-hold thesis.
- At projected returns (-3.0% appreciation + 5.5% rent growth), your $42k cash investment doubles in ~7 years — after that, you're playing with house money.
Negotiation context
- It's been on market 68 days — a 6% lower offer ($141k) is reasonable based on typical stale-listing flexibility.
Risks & watch-outs
- Watch-outs: built in 1947 — expect roof / HVAC / electrical / plumbing capex.
- Climate carrying-cost: major flood risk; severe wind risk, 99% chance of damaging wind over 30y; extreme-heat days projected 7→24/yr by 2055 (HVAC capex compounding) — expect insurance premiums to compound above CPI over the hold.
Questions for the listing agent
- It's been on market 68 days. Have you received any prior offers? Is the seller open to a 6% concession, seller financing, or rate buy-down credit?
- Built in 1947 — when were the roof, HVAC, electrical panel, plumbing, and water heater last replaced?
- Why hasn't it sold? Are there any deal-killer items the seller is aware of (foundation, flood, title, zoning, code violations)?
- Is there a deadline driving the sale (1031 exchange, divorce, estate, relocation)? That informs how much negotiation room exists.
- Schools are D-rated, which usually means shorter tenancies and higher turnover. Who's the typical renter profile here, and what's been the actual vacancy rate?
- Crime grade is F in this area — have there been break-ins, vandalism, or insurance claims at this property in the last 3 years? What carrier currently insures it and at what premium?
- What's the average days-on-market for RENTAL listings here right now (not sales)? A rising rental-DOM trend means longer vacancies and softer asking-rent achievability than the comps imply.
- What's the recent tenant-quality profile in this submarket — average credit score on applications, eviction rate, late-payment / NSF rate, and stable-employment percentage? A property-management company in the area should have these aggregated.
- How much new for-sale + rental construction is in the pipeline within 1–3 miles? Heavy new supply typically softens prices + rents 12–24 months out; constrained supply supports both.
Investment metrics
- 1% rule
- 1.28% ✓
- Cap rate
- 11.05%
- Cash-on-cash
- 17.00%
- DSCR
- 1.76
- GRM
- 6.5
CMA / ARV
- ARV (median comp)
- $155,747
- List price
- $149,999
- Delta
- -3.69%
- Verdict
- FAIR
- Comps
- 20 within 1.0 mi
Show comp detail 12 sales within ~0.75 mi
| Address | Dist | Beds/Ba | Sqft | Sold | Price | $/sf | Match |
|---|---|---|---|---|---|---|---|
| 6650 Crestridge St | 0.28mi | 4/2.0 (+1) | 1,624 (-2%) | 10mo | $175,000 | $108 | 71 |
| 5915 Southtown St | 0.12mi | 4/1.0 (+1) | 1,472 (-11%) | 4mo | $115,000 | $78 | 64 |
| 6718 Crestridge St | 0.21mi | 3/1.0 | 1,464 (-11%) | 5mo | $194,900 | $133 | 63 |
| 5815 Pershing St | 0.29mi | 3/1.0 | 1,518 (-8%) | 10mo | $80,000 | $53 | 61 |
| 6025 Wortham Way | 0.64mi | 4/2.5 (+1) | 1,629 (-1%) | 6mo | $225,000 | $138 | 56 |
| 5614 Malmedy Rd | 0.48mi | 4/2.0 (+1) | 1,748 (+6%) | 10mo | $177,000 | $101 | 54 |
| 5715 Willow Glen Dr | 0.70mi | 3/1.0 | 1,567 (-5%) | 9mo | $175,000 | $112 | 47 |
| 5911 Southurst St | 0.41mi | 4/2.0 (+1) | 1,444 (-13%) | 10mo | $220,000 | $152 | 47 |
| 5978 Southmont St | 0.58mi | 4/2.5 (+1) | 1,520 (-8%) | 9mo | $240,000 | $158 | 45 |
| 5722 Glenhurst Dr | 0.62mi | 3/2.0 | 1,450 (-12%) | 7mo | $95,000 | $66 | 44 |
| 5730 Doulton Dr | 0.58mi | 3/2.0 | 1,450 (-12%) | 12mo | $265,000 | $183 | 42 |
| 6511 Beekman Rd | 0.73mi | 4/2.0 (+1) | 1,480 (-10%) | 10mo | $165,000 | $111 | 36 |
Match score weights: distance 35% · size 25% · config 20% · recency 20%. Top-matched comps best support the ARV.
Projected returns pro-forma
-3.0% appreciation · 5.45% rent growth · sell at horizon
- IRR
- 10.8%
- Equity multiple
- 1.44×
- Total profit
- $18,413
- Equity at exit
- $22,365
- IRR
- 21.6%
- Equity multiple
- 3.04×
- Total profit
- $85,657
- Equity at exit
- $12,969
Cash invested: $42,000 (down + closing). Projections, not guarantees.
Landlord ↔ Tenant lean methodology
- Overall (STATE)
- 87 Strongly Landlord-Friendly
- State Texas
- 87 Strongly Landlord-Friendly · R+5
- County
- — inherits STATE
- City
- — inherits STATE
ZIP-level market 77033
- Home prices YoY
- -16.3%
- Rents YoY
- 5.5%
- Active inventory
- 345
- Price-to-rent
- 6.5×
Monthly cashflow live
- Estimated rent
- $1,926 high interval (Pro) →
- Mortgage (P&I)
- −$787
- Tax from tax record
- −$77 /mo · $928/yr
- Insurance
- −$62
- HOA
- −$0
- Vacancy / Maint / Mgmt
- −$404
- Net cashflow
- $595
Break-even live
Sensitivity live
| Price | -10% $680 | -5% $637 | +0% $595 | +5% $553 | +10% $510 |
|---|---|---|---|---|---|
| Rent | -10% $443 | -5% $519 | +0% $595 | +5% $671 | +10% $747 |
| Rate | -1.0pp $671 | -0.5pp $633 | base $595 | +0.5pp $556 | +1.0pp $517 |
UW: 25.0% down · 7.5% · 30yr · 1.5% tax · 5.0% vac · 8.0% maint · 8.0% mgmt
Financing live
Cash to close
- Down payment
- $37,500
- Closing costs
- $4,500
- Reserves months
- —
- Total cash needed
- —
Loan-product check · same deal, 3 products live
Conventional
25% down · 7.5% · 30yr
- Down + closing
- —
- Monthly P&I
- —
- Monthly cashflow
- —
- DSCR
- —
- Eligible?
- —
Personal DTI + credit; lowest rate.
DSCR
20% down · 8.5% · 30yr
- Down + closing
- —
- Monthly P&I
- —
- Monthly cashflow
- —
- DSCR
- —
- Eligible?
- —
No personal income docs; deal must DSCR.
Hard money
10% down · 12.0% · 12mo
- Down + closing
- —
- Monthly P&I
- —
- Monthly cashflow
- —
- DSCR
- —
- Eligible?
- —
Short-term bridge; refi at stabilization.
Rent comps 38 comps
| Address | Beds | Baths | Sqft | Rent | $/sqft | DOM | Units | Dist |
|---|---|---|---|---|---|---|---|---|
| 6850 Southbank St Unit A Houston, TX | 3.0 | 3.0 | 2000 | $2,200 | $1.10 | 5d | 1 | 0.12mi |
| 6850 Southbank St Unit A Houston, TX | 3.0 | 3.0 | 2000 | $2,200 | $1.10 | 6d | 1 | 0.12mi |
| 5954 Doolittle Blvd Houston, TX | 3.0 | 2.0 | 1371 | $1,575 | $1.15 | 45d | 1 | 0.24mi |
| 5835 Southmont St Houston, TX | 3.0 | 2.0 | 1200 | $1,700 | $1.42 | 45d | 1 | 0.45mi |
| 5317 Chennault Rd Unit A Houston, TX | 3.0 | 2.5 | 1608 | $1,849 | $1.15 | 0d | 1 | 0.47mi |
| 5818 Glenhurst Dr Houston, TX | 3.0 | 2.0 | 1441 | $1,750 | $1.21 | 0d | 1 | 0.63mi |
| 5314 Longmeadow St Houston, TX | 3.0 | 3.0 | 1646 | $1,900 | $1.15 | 45d | 1 | 0.74mi |
| 5942 Ridgeway Dr Houston, TX | 4.0 | 2.0 | 1490 | $2,250 | $1.51 | 45d | 1 | 0.79mi |
| 4942 Bataan Rd Unit 77033 Houston, TX | 4.0 | 2.0 | 1350 | $1,800 | $1.33 | 45d | 1 | 0.83mi |
| 7358 Guadalcanal Rd Houston, TX | 3.0 | 3.0 | 1768 | $2,195 | $1.24 | 45d | 1 | 0.95mi |
| 5514 Griggs Rd Unit 2187 Houston, TX | 2.0 | 2.0 | 1322 | $1,174 | $0.89 | 0d | 1 | 0.95mi |
| 5514 Griggs Rd Unit 5571 Houston, TX | 2.0 | 2.0 | 1322 | $1,214 | $0.92 | 12d | 1 | 0.95mi |
| 5514 Griggs Rd Unit 422 Houston, TX | 2.0 | 2.0 | 1322 | $1,190 | $0.90 | 9d | 1 | 0.95mi |
| 5514 Griggs Rd Unit 2165 Houston, TX | 2.0 | 2.0 | 1322 | $1,215 | $0.92 | 0d | 1 | 0.95mi |
| 5514 Griggs Rd Unit 2162 Houston, TX | 2.0 | 2.0 | 1322 | $1,190 | $0.90 | 6d | 1 | 0.95mi |
| 5514 Griggs Rd Houston, TX | 2.0 | 2.0 | 1322 | $1,210 | $0.92 | 45d | 1 | 0.97mi |
| 5623 Bellfort St Houston, TX | 4.0 | 1.0 | 1320 | $1,700 | $1.29 | 16d | 1 | 1.02mi |
| 5222 Northridge Dr Houston, TX | 4.0 | 2.0 | 1300 | $1,850 | $1.42 | 25d | 1 | 1.02mi |
| 5514 Griggs Rd Unit 2047 Houston, TX | 2.0 | 2.0 | 1322 | $1,225 | $0.93 | 12d | 1 | 1.03mi |
| 5514 Griggs Rd Unit 2047 Houston, TX | 2.0 | 2.0 | 1322 | $1,214 | $0.92 | 4d | 1 | 1.03mi |
| 7710 Darnay Dr Houston, TX | 3.0 | 3.0 | 1635 | $2,095 | $1.28 | 45d | 1 | 1.04mi |
| 5767 Belcrest St Houston, TX | 4.0 | 2.0 | 1480 | $1,790 | $1.21 | 45d | 1 | 1.04mi |
| 5123 Dewberry St Houston, TX | 4.0 | 2.0 | 1391 | $2,400 | $1.73 | 45d | 1 | 1.05mi |
| 5520 Griggs Rd Houston, TX | 2.0 | 2.0 | 1322 | $1,241 | $0.94 | 45d | 1 | 1.06mi |
| 5520 Griggs Rd Houston, TX | 2.0 | 2.0 | 1322 | $1,241 | $0.94 | 23d | 1 | 1.06mi |
| 6528 Weston St Unit A Houston, TX | 3.0 | 3.0 | 1484 | $2,200 | $1.48 | 0d | 1 | 1.16mi |
| 6528 Weston St Unit A Houston, TX | 3.0 | 3.0 | 1484 | $2,200 | $1.48 | 45d | 1 | 1.16mi |
| 6532 Weston St Unit A Houston, TX | 3.0 | 3.0 | 1484 | $2,200 | $1.48 | 19d | 1 | 1.17mi |
| 4705 Idaho St Houston, TX | 3.0 | 2.5 | 1664 | $2,500 | $1.50 | 18d | 1 | 1.23mi |
| 5154 Griggs Rd Unit CAVE Houston, TX | 2.0 | 2.0 | 1322 | $1,420 | $1.07 | 4d | 1 | 1.26mi |
| 5116 Griggs Rd Houston, TX | 3.0 | 2.0 | 1131 | $1,316 | $1.16 | 45d | 1 | 1.27mi |
| 6926 Paris St Houston, TX | 3.0 | 2.0 | 1276 | $1,900 | $1.49 | 0d | 1 | 1.31mi |
| 6928 Paris St Houston, TX | 3.0 | 2.0 | 1276 | $1,900 | $1.49 | 0d | 1 | 1.31mi |
| 6109 Wayland St Houston, TX | 4.0 | 2.0 | 1600 | $1,595 | $1.00 | 0d | 1 | 1.34mi |
| 6731 New York St Houston, TX | 3.0 | 3.0 | 2211 | $2,100 | $0.95 | 45d | 1 | 1.35mi |
| 6419 Belarbor St Houston, TX | 3.0 | 1.0 | 1240 | $1,425 | $1.15 | 45d | 1 | 1.42mi |
| 8107 Calhoun Rd Houston, TX | 3.0 | 2.5 | 1304 | $2,250 | $1.73 | 25d | 1 | 1.49mi |
| 4835 Sunflower St Unit 1546466P Houston, TX | 3.0 | 2.0 | 1883 | $4,516 | $2.40 | 16d | 1 | 1.49mi |
Listing history 15 events
-
2026-06-21days on market $149,999 Active 68 DOM
-
2026-06-18days on market $149,999 Active 65 DOM
-
2026-06-17days on market $149,999 Active 64 DOM
-
2026-06-16days on market $149,999 Active 63 DOM
-
2026-06-15days on market $149,999 Active 62 DOM
-
2026-06-13days on market $149,999 Active 60 DOM
-
2026-06-10days on market $149,999 Active 56 DOM
-
2026-06-08days on market $149,999 Active 55 DOM
-
2026-06-07days on market $149,999 Active 54 DOM
-
2026-06-04days on market $149,999 Active 51 DOM
-
2026-06-01days on market $149,999 Active 48 DOM
-
2026-05-31days on market $149,999 Active 47 DOM
-
2026-04-14$149,999 Active 672-char remark
Show marketing remark (672 chars)
INVESTOR SPECIAL! Spacious property with endless potential—being sold as-is and priced to reflect a fantastic investment opportunity. Ideally located just minutes from NRG Stadium, the Texas Medical Center, and I-610, this home combines convenience with upside potential in a high-demand area. Situated near Downtown Houston, this home sits on a large corner lot with plenty of room for expansion or redevelopment. Whether you’re looking to renovate, build new, or create a duplex for added income potential, this property offers the flexibility to bring your vision to life. Don’t miss your chance to invest in a rapidly growing area with strong upside.
-
2013-04-08soldstatus
-
1998-09-05soldstatus
ⓘ Source: listings_history table (triggers on properties + properties_extension) + one-shot
backfill from property_details.listing_events for pre-trigger history.
Tax reassessment forecast TX · Resets to sale price
- Current annual tax
- $928 · $77/mo
- Projected year-2 tax
- $2,745 · $229/mo
- Expected delta
- +$1,817/yr (+$151/mo · 195.9%)
ⓘ Screening estimate from a state-policy table — verify with the county assessor before closing.
Climate risk First Street
- Flood 6/10 Major FEMA zone X (unshaded) · 71% chance over 30 yrs
- Wildfire 1/10 Low
- Heat 9/10 Extreme 7 d/yr ≥109°F today · 24 d/yr by 30 yrs out
- Wind 9/10 Extreme 99% chance of damaging wind over 30 yrs
- Air quality 2/10 Low 2 unhealthy d/yr today · 2 by 30 yrs out
Nearby sold comps map
Loading sold comps map…
Walkable amenities ~0.75 mi
Loading nearby amenities…
Taxation est. · year 1
- Rental income
- $23,110
- − Mortgage interest
- −$8,402
- − Property taxes
- −$928
- − Insurance
- −$750
- − Repairs & maintenance
- −$1,849
- − Management
- −$1,849
- − Depreciation
- −$4,364
- Taxable income
- $4,969
- Est. tax owed @ 24.0%
- −$1,192
- After-tax cash flow
- $5,947/yr
For passive investors: Depreciation is non-cash, so a rental often shows a tax loss while cash-flowing — sheltering income. Rental losses are passive: they offset passive income freely, and up to $25,000/yr can offset ordinary (W-2) income if you actively participate and your MAGI is under $100k (phasing out to $0 by $150k); unused losses carry forward. On sale, claimed depreciation is recaptured at up to 25%, and gains may owe capital-gains tax (a 1031 exchange can defer both). Figures are a year-1 estimate at your 24.0% rate — not tax advice; consult a CPA.
Schools (NCES district)
- District
- Houston ISD
- NCES district ID
- 4823640
- Math proficiency
- 27% ▼ -18.00%
- Reading proficiency
- 35% ▼ -6.00%
- Median HH income
- $46,054
- Composite
- 26.63/100
- National rank
- #7173
- State rank
- #593 of 826 in TX
Livability — Houston
- Score
- 74/100
- State rank
- #184
- US rank
- #4771
Category grades
Schools grade is shown separately in the Schools card above.
Census & demographics
- Census place
- Houston, TX
- County
- Harris County · 4,702,590 people
- City population
- 3,226,434
- Metro
- Houston-The Woodlands-Sugar Land, TX
- Population (ZIP)
- 29,154
- Household income
- $38,071
- Rent vs Own
- Severe rent burden
- 1728.0
Population outlook (Harris County) Hauer SSP2
- Today (2025)
- 5,571,493 people
- By 2030
- 6,089,821 · +9.3%
- By 2040
- 7,142,806 · +28.2%
- By 2050
- 8,185,864 · +46.9%
- By 2075
- 10,574,329 · +89.8%
- By 2100
- 12,109,958 · +117.4%
Race, ethnicity, and origin ACS 2023
- Neighborhood character
- Majority Black (55%)
- Race & ethnicity
- Black 55% Hispanic / Latino 43% Two or more races 17% Native American 1%
- Hispanic origin (detail)
- Mexican 35%
- Common ancestry
- Lithuanian 1%
- Foreign-born
- 18% · Canada
- Languages at home
- 61% English-only · Spanish 39%
Political lean MEDSL · Harris
- 2024 margin
- Lean D (+5.5) · D 52.0% · R 46.4% · Other 1.6%
- 2008→2024 swing
- +3.9pp toward D · 2008: 1.6pp · 2024: 5.5pp
- All cycles
- 2024: D+5.5 2020: D+13.3 2016: D+12.4 2012: D+0.1 2008: D+1.6
Not yet ingested
- Civics
- —
Market trends
- HPI YoY
- ▼ -41.49%
- Current HPI
- 212.6472
- Rent YoY
- ▲ 5.45%
- Metro
- Houston-The Woodlands-Sugar Land, TX
- State GDP YoY
- ▲ 3.95%
- F500 in state
- 110
Industry mix (Fortune 500 HQ in TX)
| Industry | F500 HQs | Revenue |
|---|---|---|
| Energy | 16 | $1,198B |
|
||
| Technology | 5 | $198B |
|
||
| Engineering / Construction | 4 | $72B |
|
||
| Energy Services | 3 | $60B |
|
||
| Utilities | 3 | $41B |
|
||
| Healthcare | 2 | $330B |
|
||
Price history
3 events — show timeline
- 2026-04-14 Listed $149,999 HARMLS
- 2013-04-08 Sold (Public Records) — Public Records
- 1998-09-05 Sold (Public Records) — Public Records
Property tax history
+5.2%/yrLatest (2025): $928 · +11.7% YoY. Source: county tax records.
Cash-flow waterfall
monthlySold comps — $/sqft
last 12 mo · ≤1 miLoading sold comps…