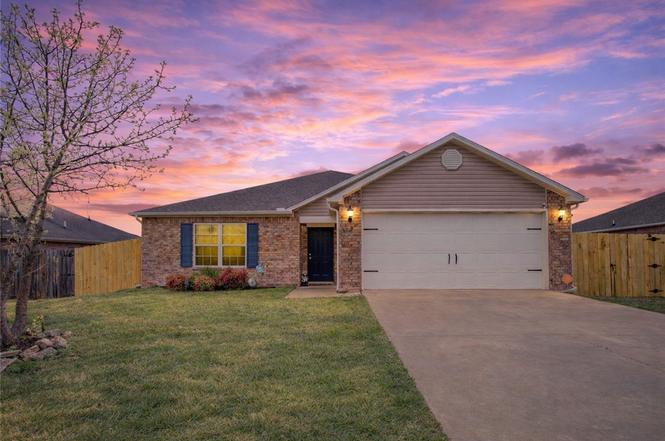
6202 SW Warrington Rd · Bentonville, AR
Flood risk 1/10 · Minimal
- FEMA flood zone
- X (unshaded)
- Chance of flooding over 30 yrs
- 0.0%
- Est. flood insurance / yr
- $507 – $1,088
Fire risk 5/10 · Moderate
- Est. fire insurance / yr
- $1,499 – $2,785
Heat risk 5/10 · Moderate
- Hot days now (above 105°F)
- 7 days/yr
- Hot days in 30 yrs
- 21 days/yr
Wind risk 2/10 · Minimal
- Chance of severe wind over 30 yrs
- 2.0%
Air-quality risk 1/10 · Minimal
- Unhealthy air days now
- 0 days/yr
- Unhealthy air days in 30 yrs
- 0 days/yr
Risk factors via First Street. Map © Google.
Why this score? — see what drove the D grade
The composite is a weighted blend of 9 inputs, each scored 0–100. Each bar is that input's sub-score; the figure is the points it added to the 100-point composite (weight × sub-score).
- Appreciation +10.0/10.0
- ARV discount +7.7/15.0
- Cash flow +6.8/30.0
- Schools +5.2/10.0
- Livability +4.2/5.0
- Rent growth +2.6/5.0
- Condition / age +2.5/5.0
- DSCR +1.0/10.0
- 1% rule +0.9/10.0
$305,000
🖨 Deal sheet (PDF) 📄 Offer letter ✓ Due diligence
Listing remarks MLS
Ross floor plan. A wonderful 3 bedroom home, with 2 bathrooms, two car garage, very spacious and perfect for a family. Why continue renting when you can own for less?
Key facts
- Open floor plan
- Tile back splash
- Back deck
Tags
Property features AI
Finance
- HOA & community: Monthly association fee; Near fire station; Near schools
Exterior
- Parking: Attached garage; 2 covered spaces
- Utilities: Electricity available; Public water; Public sewer
- Home design: Single-story; Aluminum siding and brick exterior; Architectural shingle roof; Fronts on a public road; Sloped lot in a subdivision/near industrial park/central business district
- Construction: Built with aluminum siding and brick; Slab foundation
- Exterior features: Concrete driveway; Back yard fencing
Interior
- Kitchen: Dishwasher; Electric oven; Electric range; Microwave; Microwave hood fan; Disposal
- Flooring: Carpet; Laminate
- Bathrooms: 2 full bathrooms
- Heating & cooling: Central heating (electric); Central air conditioning (electric)
- Interior features: Attic; Ceiling fans; Eat-in kitchen; Pantry; Split bedrooms; Storage; Window treatments; Blinds
- Laundry & utility: Washer hookup; Dryer hookup; Electric water heater
Neighborhood map
What this means for you Summary
Snapshot
- This is a 3-bed/2.0-bath single-family listed at $305k.
Deal economics
- At list price, monthly cash flow is $-474 ($-6k/yr) — negative.
- To cash-flow at today's rent, offer at most $221k (27.4% below list).
- To meet the 1% rule (rent ≥ 1% of price), the offer needs to be $179k (41.2% below list).
- Recommended offer: $179k (41.2% below list) — sets the bar for 1% rule.
- Cap rate 4.4% vs local median 2.6% in Bentonville — top-decile yield for the area; either an underpriced asset or a hidden risk that comps aren't pricing in. Stress-test before assuming the spread holds.
Location & tenants
- Location reads 83/100 on livability (#2 in AR, #864 nationally) — a professional / high-income tenant draw. Strengths: employment A+, housing A+, health & safety A+; Watch: amenities F.
- Bentonville School District (urban): math 59% / reading 59% proficiency, ranked #3 of 238 in AR (top 1%) — acceptable for families but not a draw, mixed tenant base, ~2y average lease.
- Market conditions: Rents flat; 710 active listings in the ZIP; 12 comparable units currently listed for rent nearby; rentals at typical pace (median 25d on market — plan ~3-4 weeks tenant-placement turnaround); high-income renter base; 4,359 units permitted in Benton County in 2024 (402 in 5+ unit buildings).
- This rent is only 18% of the median local income ($120k/yr) — well below the 30% rent-burden line; pricing power to push rent on renewal without tenant pushback.
Forward outlook
- In year one you build about $33k of equity ($2k loan paydown + $30k appreciation (10.0% local appreciation)).
- Benton County population projected at +56% by 2050 — long-run rental-demand tailwind backs the buy-and-hold thesis.
- By year 2, paydown + projected appreciation supports a ~$52k cash-out refi (75% LTV) — recoverable capital for the next deal without selling this one.
Negotiation context
- It's been on market 54 days — a 3% lower offer ($296k) is reasonable based on typical stale-listing flexibility.
- 2 sale attempts since 9y ago with the ask held roughly flat each time — persistent listings suggest the price (not the market) is what's stuck; bring a comps-based counter.
- Current owner paid $165k; list at $305k implies a 85% gain — meaningful room to come down on a strong offer.
Risks & watch-outs
- Climate carrying-cost: moderate wildfire risk; extreme-heat days projected 7→21/yr by 2055 (HVAC capex compounding) — expect insurance premiums to compound above CPI over the hold.
Questions for the listing agent
- What do current leases actually rent for vs. the listed asking? Can we see a recent rent roll and the last 12 months of T-12 income?
- It's been on market 54 days. Have you received any prior offers? Is the seller open to a 41% concession, seller financing, or rate buy-down credit?
- Is there a deadline driving the sale (1031 exchange, divorce, estate, relocation)? That informs how much negotiation room exists.
- Schools are A-rated — typically a magnet for longer-tenancy family renters. What's the average tenant stay here, and is there a school-zone premium baked into asking?
- The area grade is low — what's the realistic commute time and amenity access for the typical tenant pool here? Any planned neighborhood developments (good or bad) we should know about?
- What's the average days-on-market for RENTAL listings here right now (not sales)? A rising rental-DOM trend means longer vacancies and softer asking-rent achievability than the comps imply.
- What's the recent tenant-quality profile in this submarket — average credit score on applications, eviction rate, late-payment / NSF rate, and stable-employment percentage? A property-management company in the area should have these aggregated.
- How much new for-sale + rental construction is in the pipeline within 1–3 miles? Heavy new supply typically softens prices + rents 12–24 months out; constrained supply supports both.
Investment metrics
- 1% rule
- 0.59% ✗
- Cap rate
- 4.43%
- Cash-on-cash
- -6.66%
- DSCR
- 0.70
- GRM
- 14.2
CMA / ARV
- ARV (on-the-fly)
- $306,270
- Comps found
- 12
Show comp detail 12 sales within ~0.75 mi
| Address | Dist | Beds/Ba | Sqft | Sold | Price | $/sf | Match |
|---|---|---|---|---|---|---|---|
| 6202 SW Warrington Rd | 0.00mi | 3/2.0 | 1,494 (0%) | 1mo | $300,000 | $201 | 99 |
| 4307 SW Comstock Ave | 0.10mi | 3/2.0 | 1,459 (-2%) | 3mo | $270,000 | $185 | 88 |
| 4204 Comstock Ave | 0.09mi | 3/2.0 | 1,468 (-2%) | 8mo | $295,000 | $201 | 86 |
| 6709 SW Whitmarsh Rd | 0.30mi | 3/2.0 | 1,485 (-1%) | 2mo | $305,000 | $205 | 84 |
| 6301 Chalkstone Rd | 0.15mi | 3/2.0 | 1,585 (+6%) | 6mo | $315,000 | $199 | 78 |
| 6802 SW Chalkstone Rd | 0.37mi | 3/2.0 | 1,485 (-1%) | 12mo | $315,000 | $212 | 71 |
| 6316 SW Chestnut Hill Rd | 0.12mi | 3/2.0 | 1,332 (-11%) | 10mo | $299,000 | $224 | 68 |
| 6314 SW Chestnut Hill Rd | 0.12mi | 3/2.0 | 1,353 (-9%) | 18mo | $286,200 | $212 | 64 |
| 6905 SW Whitmarsh Rd | 0.39mi | 3/2.0 | 1,456 (-2%) | 17mo | $312,500 | $215 | 63 |
| 6901 Pilgrim Rd | 0.37mi | 3/2.0 | 1,423 (-5%) | 20mo | $275,000 | $193 | 58 |
| 4304 SW Lexington Ave | 0.24mi | 3/2.0 | 1,353 (-9%) | 20mo | $277,500 | $205 | 56 |
| 4406 SW Lexington Ave | 0.29mi | 3/2.0 | 1,310 (-12%) | 12mo | $300,000 | $229 | 56 |
Match score weights: distance 35% · size 25% · config 20% · recency 20%. Top-matched comps best support the ARV.
Projected returns pro-forma
10.0% appreciation · 0.39% rent growth · sell at horizon
- IRR
- 19.0%
- Equity multiple
- 2.54×
- Total profit
- $131,242
- Equity at exit
- $274,768
- IRR
- 17.1%
- Equity multiple
- 5.70×
- Total profit
- $401,646
- Equity at exit
- $592,548
Cash invested: $85,400 (down + closing). Projections, not guarantees.
Landlord ↔ Tenant lean methodology
- Overall (STATE)
- 92 Strongly Landlord-Friendly
- State Arkansas
- 92 Strongly Landlord-Friendly · R+14
- County
- — inherits STATE
- City
- — inherits STATE
ZIP-level market 72713
- Home prices YoY
- 3.5%
- Rents YoY
- 0.4%
- Active inventory
- 710
- Price-to-rent
- 14.2×
Monthly cashflow live
- Estimated rent
- $1,793 high interval (Pro) →
- Mortgage (P&I)
- −$1,599
- Tax from tax record
- −$164 /mo · $1,967/yr
- Insurance
- −$127
- HOA
- −$0
- Vacancy / Maint / Mgmt
- −$377
- Net cashflow
- $-474
Break-even live
Sensitivity live
| Price | -10% $-301 | -5% $-387 | +0% $-474 | +5% $-560 | +10% $-646 |
|---|---|---|---|---|---|
| Rent | -10% $-615 | -5% $-545 | +0% $-474 | +5% $-403 | +10% $-332 |
| Rate | -1.0pp $-320 | -0.5pp $-396 | base $-474 | +0.5pp $-553 | +1.0pp $-633 |
UW: 25.0% down · 7.5% · 30yr · 1.5% tax · 5.0% vac · 8.0% maint · 8.0% mgmt
Financing live
Cash to close
- Down payment
- $76,250
- Closing costs
- $9,150
- Reserves months
- —
- Total cash needed
- —
Loan-product check · same deal, 3 products live
Conventional
25% down · 7.5% · 30yr
- Down + closing
- —
- Monthly P&I
- —
- Monthly cashflow
- —
- DSCR
- —
- Eligible?
- —
Personal DTI + credit; lowest rate.
DSCR
20% down · 8.5% · 30yr
- Down + closing
- —
- Monthly P&I
- —
- Monthly cashflow
- —
- DSCR
- —
- Eligible?
- —
No personal income docs; deal must DSCR.
Hard money
10% down · 12.0% · 12mo
- Down + closing
- —
- Monthly P&I
- —
- Monthly cashflow
- —
- DSCR
- —
- Eligible?
- —
Short-term bridge; refi at stabilization.
Rent comps 12 comps
| Address | Beds | Baths | Sqft | Rent | $/sqft | DOM | Units | Dist |
|---|---|---|---|---|---|---|---|---|
| 6611 SW Warrington Rd Bentonville, AR | 3.0 | 2.0 | 1353 | $1,700 | $1.26 | 16d | 1 | 0.27mi |
| 6706 SW Whitmarsh Rd Bentonville, AR | 4.0 | 2.0 | 1657 | $1,695 | $1.02 | 23d | 1 | 0.30mi |
| 6801 SW Chestnut Hill Rd Bentonville, AR | 4.0 | 2.0 | 1652 | $1,750 | $1.06 | 25d | 1 | 0.31mi |
| 6804 SW Chalkstone Rd Bentonville, AR | 4.0 | 2.0 | 1650 | $1,885 | $1.14 | 16d | 1 | 0.38mi |
| 5806 SW Crozier Cir Bentonville, AR | 1.0–2.0 | 1.0–2.0 | 945 | $1,452 | $1.54 | 16d | 25 | 0.41mi |
| 4205 SW Lenox Ave Bentonville, AR | 4.0 | 2.0 | 1652 | $1,850 | $1.12 | 25d | 1 | 0.42mi |
| 4404 SW Sackett Ave Bentonville, AR | 3.0 | 2.0 | 1480 | $1,700 | $1.15 | 25d | 1 | 0.54mi |
| 4405 SW Sackett Ave Bentonville, AR | 3.0 | 2.0 | 1480 | $1,700 | $1.15 | 25d | 1 | 0.56mi |
| 5302 SW Monaco Ln Bentonville, AR | 3.0 | 2.0 | 1202 | $1,550 | $1.29 | 25d | 1 | 0.80mi |
| 3800 SW Mistletoe Ave Unit 1221819P Bentonville, AR | 3.0 | 2.0 | 1593 | $5,861 | $3.68 | 15d | 1 | 1.19mi |
| 6000 SW Desert Ave Bentonville, AR | 3.0 | 2.0 | 1669 | $2,050 | $1.23 | 16d | 1 | 1.45mi |
| 6708 SW Shady Rd Bentonville, AR | 4.0 | 2.0 | 1500 | $1,800 | $1.20 | 25d | 1 | 1.47mi |
Listing history 6 events
-
2026-05-04status Pending
-
2026-03-11$305,000 Active
-
2025-09-12price $317,500
-
2019-08-19soldstatus $165,000
-
2017-11-01soldstatus $161,350 166-char remark
Show marketing remark (166 chars)
Ross floor plan. A wonderful 3 bedroom home, with 2 bathrooms, two car garage, very spacious and perfect for a family. Why continue renting when you can own for less?
-
2017-02-13$161,350 166-char remark
Show marketing remark (166 chars)
Ross floor plan. A wonderful 3 bedroom home, with 2 bathrooms, two car garage, very spacious and perfect for a family. Why continue renting when you can own for less?
ⓘ Source: listings_history table (triggers on properties + properties_extension) + one-shot
backfill from property_details.listing_events for pre-trigger history.
Tax reassessment forecast AR · Resets to sale price
- Current annual tax
- $1,967 · $164/mo
- Projected year-2 tax
- $1,967 · $164/mo
- Expected delta
- $0/yr ($0/mo · 0.0%)
ⓘ Screening estimate from a state-policy table — verify with the county assessor before closing.
Climate risk First Street
- Flood 1/10 Low FEMA zone X (unshaded) · 0% chance over 30 yrs
- Wildfire 5/10 Major
- Heat 5/10 Major 7 d/yr ≥105°F today · 21 d/yr by 30 yrs out
- Wind 2/10 Low 2% chance of damaging wind over 30 yrs
- Air quality 1/10 Low 0 unhealthy d/yr today · 0 by 30 yrs out
Nearby sold comps map
Loading sold comps map…
Walkable amenities ~0.75 mi
Loading nearby amenities…
Taxation est. · year 1
- Rental income
- $21,520
- − Mortgage interest
- −$17,085
- − Property taxes
- −$1,967
- − Insurance
- −$1,525
- − Repairs & maintenance
- −$1,722
- − Management
- −$1,722
- − Depreciation
- −$8,873
- Taxable loss
- −$11,373
- Est. tax savings @ 24.0%
- +$2,730
- After-tax cash flow
- $-2,955/yr
For passive investors: Depreciation is non-cash, so a rental often shows a tax loss while cash-flowing — sheltering income. Rental losses are passive: they offset passive income freely, and up to $25,000/yr can offset ordinary (W-2) income if you actively participate and your MAGI is under $100k (phasing out to $0 by $150k); unused losses carry forward. On sale, claimed depreciation is recaptured at up to 25%, and gains may owe capital-gains tax (a 1031 exchange can defer both). Figures are a year-1 estimate at your 24.0% rate — not tax advice; consult a CPA.
Schools (NCES district)
- District
- Bentonville School District
- NCES district ID
- 0503060
- Math proficiency
- 59% ▼ -8.00%
- Reading proficiency
- 59% ▼ -6.00%
- Median HH income
- $66,721
- Composite
- 51.85/100
- National rank
- #1661
- State rank
- #3 of 238 in AR
Livability — Bentonville
- Score
- 83/100
- State rank
- #2
- US rank
- #864
Category grades
Schools grade is shown separately in the Schools card above.
Census & demographics
- Census place
- Bentonville, AR
- County
- Benton County · 259,241 people
- City population
- 19,701
- Metro
- Fayetteville-Springdale-Rogers, AR
- Population (ZIP)
- 28,999
- Household income
- $119,853
- Rent vs Own
- Severe rent burden
- 508.0
Population outlook (Benton County) Hauer SSP2
- Today (2025)
- 318,683 people
- By 2030
- 353,481 · +10.9%
- By 2040
- 425,280 · +33.4%
- By 2050
- 497,239 · +56.0%
- By 2075
- 662,114 · +107.8%
- By 2100
- 776,431 · +143.6%
Race, ethnicity, and origin ACS 2023
- Neighborhood character
- Diverse neighborhood (Simpson 0.66)
- Race & ethnicity
- White 54% Asian 20% Two or more races 16% Hispanic / Latino 11% Black 3%
- Hispanic origin (detail)
- Mexican 8%
- Common ancestry
- Italian 2% Slovak 2% Romanian 1%
- Foreign-born
- 22% · Canada, China, Vietnam
- Languages at home
- 79% English-only · Other Asian/Pacific 8% Spanish 6% Other Indo-European 5%
Political lean MEDSL · Benton
- 2024 margin
- Strong R (+27.0) · D 35.2% · R 62.1% · Other 2.7%
- 2008→2024 swing
- +9.6pp toward D · 2008: -36.5pp · 2024: -27.0pp
- All cycles
- 2024: R+27.0 2020: R+26.4 2016: R+34.9 2012: R+40.4 2008: R+36.5
Not yet ingested
- Civics
- —
Market trends
- HPI YoY
- ▲ 10.77%
- Current HPI
- 319.3081
- Rent YoY
- ▲ 0.39%
- Metro
- Fayetteville-Springdale-Rogers, AR
- State GDP YoY
- ▲ 3.80%
- F500 in state
- 10
Industry mix (Fortune 500 HQ in AR)
| Industry | F500 HQs | Revenue |
|---|---|---|
| Retail | 1 | $681B |
|
||
| Food / Agriculture | 1 | $53B |
|
||
| Retail / Energy | 1 | $22B |
|
||
| Transportation / Logistics | 1 | $12B |
|
||
| Energy | 1 | $4B |
|
||
Price history
+89.0% since first listed6 events — show timeline
- 2026-05-04 Pending — NWARMLS
- 2026-03-11 Listed $305,000 NWARMLS
- 2025-09-12 Price Changed $317,500 NWARMLS
- 2019-08-19 Sold (Public Records) $165,000 Public Records
- 2017-11-01 Sold (MLS) $161,350 NWARMLS
- 2017-02-13 Listed $161,350 NWARMLS
Property tax history
-0.8%/yrLatest (2025): $1,967 · +1.8% YoY. Source: county tax records.
Cash-flow waterfall
monthlySold comps — $/sqft
last 12 mo · ≤1 miLoading sold comps…