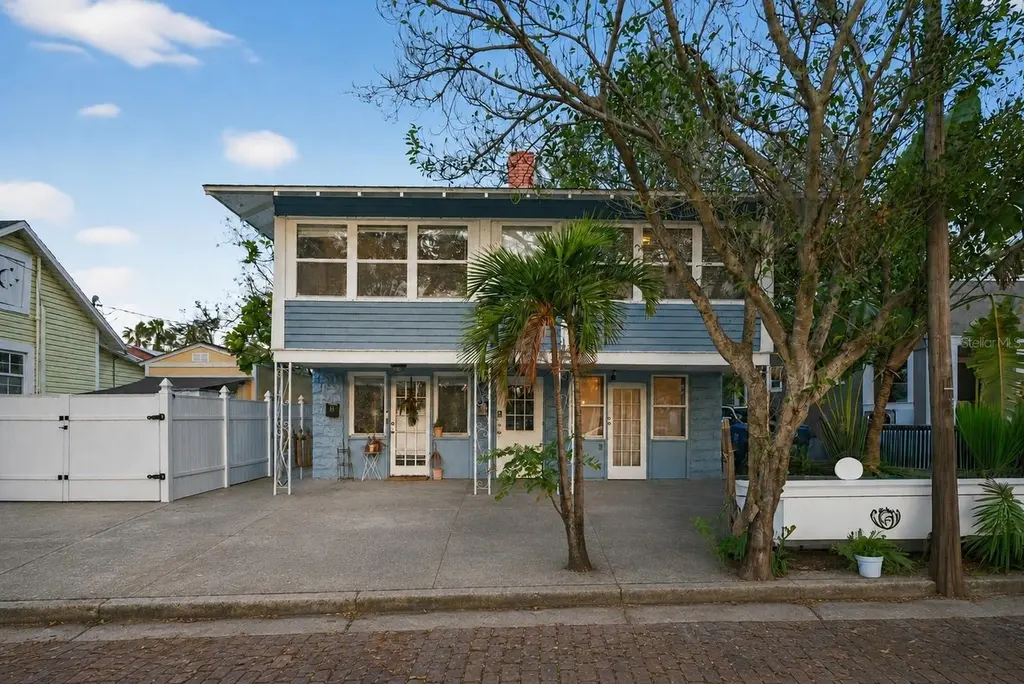
 Duplex
1059 5th St N · St. Petersburg, FL
Flood risk 1/10 · Minimal
- FEMA flood zone
- X (unshaded)
- Chance of flooding over 30 yrs
- 0.0%
- Est. flood insurance / yr
- $507 – $1,088
Fire risk 1/10 · Minimal
- Est. fire insurance / yr
- $947 – $1,759
Heat risk 10/10 · Severe
- Hot days now (above 106°F)
- 6 days/yr
- Hot days in 30 yrs
- 24 days/yr
Wind risk 10/10 · Severe
- Chance of severe wind over 30 yrs
- 99.0%
Air-quality risk 3/10 · Minor
- Unhealthy air days now
- 2 days/yr
- Unhealthy air days in 30 yrs
- 3 days/yr
Risk factors via First Street. Map © Google.
Why this score? — see what drove the C+ grade
The composite is a weighted blend of 9 inputs, each scored 0–100. Each bar is that input's sub-score; the figure is the points it added to the 100-point composite (weight × sub-score).
- Cash flow +26.7/30.0
- DSCR +9.2/10.0
- ARV discount +7.5/15.0
- 1% rule +7.3/10.0
- Schools +4.3/10.0
- Livability +2.5/5.0
- Condition / age +2.5/5.0
- Rent growth +1.6/5.0
- Appreciation +0.0/10.0
$499,000
🖨 Deal sheet 📄 Offer letter ✓ Due diligence
Multi-family units
County records classify this as Multi-Family (2-4 Unit). Listing-text estimate: 2 units. confirmed
Listing remarks MLS
Historic Uptown St. Petersburg Duplex. Fresh Exterior paint, 1st and 2nd floor's are neat and clean, & have been updated. The Duplex is Centrally located within the city and simply Minutes from St. Anthony's Hospital, Crescent Lake, I-275 access, many coffee houses, pub's, and more. Along with the eclectic and vibrant St. Petersburg downtown waterfront, St. Petersburg Pier and many restaurants and eateries. .. Please provide a 24 hr. notice to view as a courtesy to our residents.
Key facts
- Extra storage space
- Shared laundry room
- On street parking
Tags
Property features AI
Finance
- Other: Living area reported as 1,820 square feet (building area 1,976 sq ft)
- Financial info: Gross income reported: $49,440; Annual net income reported: $33,156; Lease restrictions applicable; Pro forma rents: $2,320 for the 2-bedroom unit, $1,800 for the 1-bedroom unit
- HOA & community: No HOA association indicated; Pets allowed
Exterior
- Parking: Curb parking
- Utilities: Public water; Public sewer; Electricity connected; Water connected; Sewer connected
- Home design: Residential income duplex; One building
- Construction: Block construction; Shingle roof; Slab foundation; Built on a 0.04-acre lot
- Exterior features: Front porch; Sidewalk
Interior
- Kitchen: Microwave; Range; Refrigerator
- Bedrooms: 3 bedrooms total; Unit mix: one 2-bedroom unit (occupied), one 1-bedroom unit (vacancy)
- Flooring: Tile flooring
- Bathrooms: Unit mix: 2 bathrooms in the 2-bedroom unit, 1 bathroom in the 1-bedroom unit
- Heating & cooling: Central heating; Central air conditioning
- Interior features: Other interior features; Inside utility
- Laundry & utility: Washer inside (laundry room)
Neighborhood map
What this means for you Summary
Snapshot
- This is a 2 × 3-bed/3.0-bath units multifamily listed at $499k.
Deal economics
- At list price, monthly cash flow is $1k ($16k/yr) — positive. Per door: $676/mo.
- The deal already cash-flows at list — no discount required.
- Meets the 1% rule at list price ($6k rent vs $499k).
- Cap rate 9.5% vs local median 2.6% in St. Petersburg — top-decile yield for the area; either an underpriced asset or a hidden risk that comps aren't pricing in. Stress-test before assuming the spread holds.
Location & tenants
- Location reads: area grade C — affects rentability + tenant quality, not the cash-flow math above.
- Pinellas (suburban): math 51% / reading 51% proficiency, ranked #31 of 73 in FL (top 42%) — acceptable for families but not a draw, mixed tenant base, ~2y average lease.
- Market conditions: Rents falling (-3.6%/yr); 345 active listings in the ZIP; 2,676 units permitted in Pinellas County in 2024 (1,422 in 5+ unit buildings).
- At $6,148/mo this rent would consume 100% of the median local household income ($74k/yr) (locally 2230% of renters already pay >50% of income on rent) — very limited rent-growth headroom before tenants either downsize or default.
Forward outlook
- Local home prices are declining (-3.0%/yr); year-one equity from $3k of loan paydown is wiped out by about $15k of value loss. Plan a longer hold.
- Pinellas County population projected at +14% by 2050 — modest demand growth; plan on rents tracking national, not racing it.
Negotiation context
- Only 8 days on market — expect competitive offers; lowballing is unlikely to land.
- 9 sale attempts since 22y ago with the ask held roughly flat each time — persistent listings suggest the price (not the market) is what's stuck; bring a comps-based counter.
- Current owner paid $381k; 31% above their basis — modest negotiation headroom, anchor on the comps not their cost.
Risks & watch-outs
- Watch-outs: built in 1915 — expect roof / HVAC / electrical / plumbing capex.
- Climate carrying-cost: severe wind risk, 99% chance of damaging wind over 30y; extreme-heat days projected 6→24/yr by 2055 (HVAC capex compounding) — expect insurance premiums to compound above CPI over the hold.
Questions for the listing agent
- Can we see the unit-by-unit rent roll, current vacancy, and any below-market leases? What's the average tenancy length?
- What capital expenditures (roof, boiler, parking lot, exteriors) have been made in the last 5 years, and what's planned in the next 2?
- Built in 1915 — when were the roof, HVAC, electrical panel, plumbing, and water heater last replaced?
- Is there a deadline driving the sale (1031 exchange, divorce, estate, relocation)? That informs how much negotiation room exists.
- What's the average days-on-market for RENTAL listings here right now (not sales)? A rising rental-DOM trend means longer vacancies and softer asking-rent achievability than the comps imply.
- What's the recent tenant-quality profile in this submarket — average credit score on applications, eviction rate, late-payment / NSF rate, and stable-employment percentage? A property-management company in the area should have these aggregated.
- How much new apartment / multifamily construction is in the pipeline within 1–3 miles? Heavy new supply (>2% of stock underway) typically softens rents 12–24 months out; light construction supports rent growth.
Investment metrics
- 1% rule
- 1.23% ✓
- Cap rate
- 9.54%
- Cash-on-cash
- 11.61%
- DSCR
- 1.52
- GRM
- 6.8
CMA / ARV
No comps found within radius.
Projected returns pro-forma
-3.0% appreciation · 0.0% rent growth · sell at horizon
- IRR
- -2.5%
- Equity multiple
- 0.91×
- Total profit
- $-12,665
- Equity at exit
- $74,403
- IRR
- 3.5%
- Equity multiple
- 1.22×
- Total profit
- $30,708
- Equity at exit
- $43,144
Cash invested: $139,720 (down + closing). Projections, not guarantees.
Landlord ↔ Tenant lean methodology
- Overall (STATE)
- 87 Strongly Landlord-Friendly
- State Florida
- 87 Strongly Landlord-Friendly · R+3
- County
- — inherits STATE
- City
- — inherits STATE
ZIP-level market 33701
- Rents YoY
- -3.6%
- Active inventory
- 345
- Price-to-rent
- 13.5×
Monthly cashflow live
- Estimated rent
- $6,148 high interval (Pro) →
- Mortgage (P&I)
- −$2,617
- Tax from tax record
- −$681 /mo · $8,167/yr
- Insurance
- −$208
- HOA
- −$0
- Vacancy / Maint / Mgmt
- −$1,291
- Net cashflow
- $1,352
Break-even live
2-unit breakdown (identical units grouped — click to expand)
| Units | Beds | Baths | Est. rent |
|---|---|---|---|
| 2× units | 3 | 3 | $6,148 |
| #1 | 3 | 3 | $3,074 |
| #2 | 3 | 3 | $3,074 |
| Total (2 units) | $6,148 | ||
UW: 25.0% down · 7.5% · 30yr · 1.5% tax · 5.0% vac · 8.0% maint · 8.0% mgmt
Financing live
Cash to close
- Down payment
- $124,750
- Closing costs
- $14,970
- Reserves months
- —
- Total cash needed
- —
Loan-product check · same deal, 3 products live
Conventional
25% down · 7.5% · 30yr
- Down + closing
- —
- Monthly P&I
- —
- Monthly cashflow
- —
- DSCR
- —
- Eligible?
- —
Personal DTI + credit; lowest rate.
DSCR
20% down · 8.5% · 30yr
- Down + closing
- —
- Monthly P&I
- —
- Monthly cashflow
- —
- DSCR
- —
- Eligible?
- —
No personal income docs; deal must DSCR.
Hard money
10% down · 12.0% · 12mo
- Down + closing
- —
- Monthly P&I
- —
- Monthly cashflow
- —
- DSCR
- —
- Eligible?
- —
Short-term bridge; refi at stabilization.
Listing history 5 events
-
2026-06-13statusdays on market $499,000 Pending 8 DOM
-
2026-06-09days on market $499,000 Active 5 DOM
-
2026-06-08days on market $499,000 Active 4 DOM
-
2026-06-07remarks 699-char remark
-
2026-06-07$499,000 Active 3 DOM
ⓘ Source: listings_history table (triggers on properties + properties_extension) + one-shot
backfill from property_details.listing_events for pre-trigger history.
Tax reassessment forecast FL · Resets to sale price
- Current annual tax
- $8,167 · $681/mo
- Projected year-2 tax
- $8,167 · $681/mo
- Expected delta
- $0/yr ($0/mo · 0.0%)
ⓘ Screening estimate from a state-policy table — verify with the county assessor before closing.
Climate risk First Street
- Flood 1/10 Low FEMA zone X (unshaded) · 0% chance over 30 yrs
- Wildfire 1/10 Low
- Heat 10/10 Extreme 6 d/yr ≥106°F today · 24 d/yr by 30 yrs out
- Wind 10/10 Extreme 99% chance of damaging wind over 30 yrs
- Air quality 3/10 Moderate 2 unhealthy d/yr today · 3 by 30 yrs out
Nearby sold comps map
Loading sold comps map…
Walkable amenities ~0.75 mi
Loading nearby amenities…
Taxation est. · year 1
- Rental income
- $73,776
- − Mortgage interest
- −$27,952
- − Property taxes
- −$8,167
- − Insurance
- −$2,495
- − Repairs & maintenance
- −$5,902
- − Management
- −$5,902
- − Depreciation
- −$14,516
- Taxable income
- $8,842
- Est. tax owed @ 24.0%
- −$2,122
- After-tax cash flow
- $14,097/yr
For passive investors: Depreciation is non-cash, so a rental often shows a tax loss while cash-flowing — sheltering income. Rental losses are passive: they offset passive income freely, and up to $25,000/yr can offset ordinary (W-2) income if you actively participate and your MAGI is under $100k (phasing out to $0 by $150k); unused losses carry forward. On sale, claimed depreciation is recaptured at up to 25%, and gains may owe capital-gains tax (a 1031 exchange can defer both). Figures are a year-1 estimate at your 24.0% rate — not tax advice; consult a CPA.
Schools (NCES district)
- District
- Pinellas
- NCES district ID
- 1201560
- Math proficiency
- 51% ▼ -5.00%
- Reading proficiency
- 51% ▼ -3.00%
- Median HH income
- $46,270
- Composite
- 43.27/100
- National rank
- #3046
- State rank
- #31 of 73 in FL
Livability — St. Petersburg
No livability data for this city. (Only ~50 U.S. cities are tracked.)
Census & demographics
- Census place
- St. Petersburg, FL
- County
- Pinellas County · 939,478 people
- City population
- 249,151
- Metro
- Tampa-St. Petersburg-Clearwater, FL
- Population (ZIP)
- 18,823
- Household income
- $73,542
- Rent vs Own
- Severe rent burden
- 2230.0
Population outlook (Pinellas County) Hauer SSP2
- Today (2025)
- 1,027,532 people
- By 2030
- 1,063,586 · +3.5%
- By 2040
- 1,125,020 · +9.5%
- By 2050
- 1,168,637 · +13.7%
- By 2075
- 1,265,188 · +23.1%
- By 2100
- 1,260,357 · +22.7%
Race, ethnicity, and origin ACS 2023
- Neighborhood character
- Predominantly White (74%)
- Race & ethnicity
- White 74% Hispanic / Latino 10% Black 10% Two or more races 7% Asian 2%
- Hispanic origin (detail)
- Mexican 1% Puerto Rican 2% Cuban 3%
- Common ancestry
- Romanian 4% Lithuanian 4% Slovak 3%
- Foreign-born
- 10% · Canada, Jamaica, China
- Languages at home
- 88% English-only · Spanish 6% Other Indo-European 2% Russian/Polish/Slavic 1%
Political lean MEDSL · Pinellas
- 2024 margin
- Lean R (+5.2) · D 46.9% · R 52.1%
- 2008→2024 swing
- -13.5pp toward R · 2008: 8.3pp · 2024: -5.2pp
- All cycles
- 2024: R+5.2 2020: D+0.2 2016: R+1.1 2012: D+5.6 2008: D+8.3
Not yet ingested
- Civics
- —
Market trends
- HPI YoY
- ▼ -425.52%
- Current HPI
- 486.3846
- Rent YoY
- ▼ -3.56%
- Metro
- Tampa-St. Petersburg-Clearwater, FL
- State GDP YoY
- ▲ 3.28%
- F500 in state
- 36
Industry mix (Fortune 500 HQ in FL)
| Industry | F500 HQs | Revenue |
|---|---|---|
| Industrial Technology | 2 | $29B |
|
||
| Insurance | 2 | $17B |
|
||
| Retail | 1 | $60B |
|
||
| Technology Distribution | 1 | $58B |
|
||
| Homebuilding | 1 | $35B |
|
||
| Technology Manufacturing | 1 | $35B |
|
||
Price history
+2751.4% since first listed26 events — show timeline
- 2026-06-04 Listed $499,000 Stellar MLS as Distributed by MLS Grid
- 2022-02-11 Price Changed $2,300 RENT.
- 2021-12-02 Sold (Public Records) $381,000 Public Records
- 2021-11-30 Sold (MLS) $381,000 Stellar MLS as Distributed by MLS Grid
- 2021-11-03 Pending — Stellar MLS as Distributed by MLS Grid
- 2021-11-01 Listed $350,000 Stellar MLS as Distributed by MLS Grid
- 2015-03-11 Sold (Public Records) $141,000 Public Records
- 2015-03-06 Sold (MLS) $141,000 Stellar MLS as Distributed by MLS Grid
- 2015-03-01 Pending — Stellar MLS as Distributed by MLS Grid
- 2015-02-03 Listing Removed — Stellar MLS as Distributed by MLS Grid
- 2014-12-24 Listed $159,900 Stellar MLS as Distributed by MLS Grid
- 2014-12-24 Price Changed $15,000 Stellar MLS as Distributed by MLS Grid
- 2014-12-24 Listed $159,900 Stellar MLS as Distributed by MLS Grid
- 2014-12-23 Listing Removed — Stellar MLS as Distributed by MLS Grid
- 2014-12-23 Listed $159,900 Stellar MLS as Distributed by MLS Grid
- 2006-05-23 Listing Removed — Stellar MLS as Distributed by MLS Grid
- 2006-05-01 Listed $269,000 Stellar MLS as Distributed by MLS Grid
- 2006-04-17 Listing Removed — Stellar MLS as Distributed by MLS Grid
- 2006-03-09 Listed $289,000 Stellar MLS as Distributed by MLS Grid
- 2005-05-13 Sold (Public Records) $175,000 Public Records
- 2005-05-07 Sold (MLS) $175,000 Stellar MLS as Distributed by MLS Grid
- 2004-12-28 Listed $179,900 Stellar MLS as Distributed by MLS Grid
- 2004-12-28 Listed $179,900 Stellar MLS as Distributed by MLS Grid
- 2003-12-01 Sold (Public Records) $75,000 Public Records
- 1996-10-03 Sold (Public Records) $46,900 Public Records
- 1990-10-10 Sold (Public Records) $17,500 Public Records
Property tax history
+13.6%/yrLatest (2025): $8,167 · +2.1% YoY. Source: county tax records.
Cash-flow waterfall
monthlySold comps — $/sqft
last 12 mo · ≤1 miLoading sold comps…