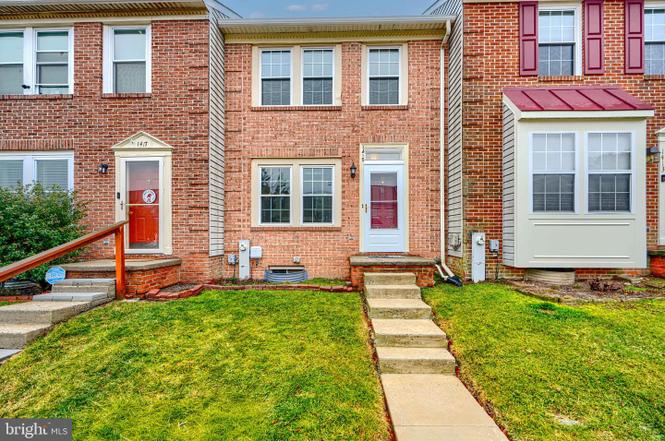
1415 St Christopher Ct · Edgewood, MD
Flood risk 1/10 · Minimal
- FEMA flood zone
- X (unshaded)
- Chance of flooding over 30 yrs
- 0.0%
- Est. flood insurance / yr
- $473 – $860
Fire risk 1/10 · Minimal
- Est. fire insurance / yr
- $755 – $1,403
Heat risk 7/10 · Major
- Hot days now (above 104°F)
- 7 days/yr
- Hot days in 30 yrs
- 15 days/yr
Wind risk 6/10 · Moderate
- Chance of severe wind over 30 yrs
- 27.0%
Air-quality risk 4/10 · Minor
- Unhealthy air days now
- 4 days/yr
- Unhealthy air days in 30 yrs
- 6 days/yr
Risk factors via First Street. Map © Google.
Why this score? — see what drove the D- grade
The composite is a weighted blend of 9 inputs, each scored 0–100. Each bar is that input's sub-score; the figure is the points it added to the 100-point composite (weight × sub-score).
- Cash flow +12.9/30.0
- ARV discount +4.8/15.0
- DSCR +3.9/10.0
- Rent growth +3.7/5.0
- Livability +3.7/5.0
- 1% rule +3.4/10.0
- Schools +2.9/10.0
- Condition / age +2.5/5.0
- Appreciation +0.0/10.0
$235,000
🖨 Deal sheet 📄 Offer letter ✓ Due diligence
Listing remarks MLS
List & Sold Simultaneously
Key facts
- Bright living area
- $104 HOA
- 2 parking spots
Tags
Property features AI
Finance
- HOA & community: Homeowners association fee of $104 per month
Exterior
- Parking: Two assigned parking spaces (space #15); On-street parking available
- Utilities: Public water; Public sewer; Electric service
- Home design: Interior townhouse/rowhouse; Fee simple ownership
- Construction: Brick construction; Shingle roof; Other foundation
- Exterior features: No tidal water
Interior
- Kitchen: Built-in microwave; Refrigerator; Stove; Dishwasher; Disposal
- Bedrooms: Three bedrooms on the upper level
- Flooring: Carpet; Engineered wood; Vinyl
- Bathrooms: One full bathroom (upper level); One half bathroom (lower level)
- Heating & cooling: Heat pump heating; Central air conditioning; Electric hot water
- Interior features: Tub/shower combination; Open living and dining area (combination dining/living); Finished basement; Sump pump
- Laundry & utility: Washer and dryer located on lower floor / basement
Neighborhood map
What this means for you Summary
Snapshot
- This is a 3-bed/1.5-bath townhouse listed at $235k.
Deal economics
- At list price, monthly cash flow is $-16 ($-198/yr) — negative.
- To cash-flow at today's rent, offer at most $232k (1.2% below list).
- To meet the 1% rule (rent ≥ 1% of price), the offer needs to be $197k (16.2% below list).
- Recommended offer: $197k (16.2% below list) — sets the bar for 1% rule.
Location & tenants
- Location reads 73/100 on livability (#118 in MD, #4,991 nationally) — a middle-class / working-renter tenant base. Strengths: commute A+, housing A+, health & safety A+; Watch: schools D, amenities D, crime F.
- Harford County Public Schools (suburban): math 22% / reading 39% proficiency, ranked #9 of 24 in MD (top 38%) — families likely to look elsewhere, expect single-tenant / working-renter base with shorter leases.
- Market conditions: Rents rising fast (+4.9%/yr); 94 active listings in the ZIP; 14 comparable units currently listed for rent nearby; rentals at typical pace (median 24d on market — plan ~3-4 weeks tenant-placement turnaround); 43% of comp listings sitting > 30 days — soft ceiling on asking rent; solid renter incomes; 803 units permitted in Harford County in 2024 (26 in 5+ unit buildings).
Forward outlook
- Local home prices are declining (-3.0%/yr); year-one equity from $2k of loan paydown is wiped out by about $7k of value loss. Plan a longer hold.
Negotiation context
- Only 9 days on market — expect competitive offers; lowballing is unlikely to land.
- 7 sale attempts since 26y ago with the ask held roughly flat each time — persistent listings suggest the price (not the market) is what's stuck; bring a comps-based counter.
- Current owner paid $173k; 36% above their basis — modest negotiation headroom, anchor on the comps not their cost.
Risks & watch-outs
- Climate carrying-cost: major wind risk, 27% chance of damaging wind over 30y; extreme-heat days projected 7→15/yr by 2055 (HVAC capex compounding) — expect insurance premiums to compound above CPI over the hold.
Questions for the listing agent
- What do current leases actually rent for vs. the listed asking? Can we see a recent rent roll and the last 12 months of T-12 income?
- What does the HOA fee cover, when was the last increase, and are there any pending special assessments or reserve-fund shortfalls?
- Is there a deadline driving the sale (1031 exchange, divorce, estate, relocation)? That informs how much negotiation room exists.
- Schools are D-rated, which usually means shorter tenancies and higher turnover. Who's the typical renter profile here, and what's been the actual vacancy rate?
- Crime grade is F in this area — have there been break-ins, vandalism, or insurance claims at this property in the last 3 years? What carrier currently insures it and at what premium?
- The area grade is low — what's the realistic commute time and amenity access for the typical tenant pool here? Any planned neighborhood developments (good or bad) we should know about?
- What's the average days-on-market for RENTAL listings here right now (not sales)? A rising rental-DOM trend means longer vacancies and softer asking-rent achievability than the comps imply.
- What's the recent tenant-quality profile in this submarket — average credit score on applications, eviction rate, late-payment / NSF rate, and stable-employment percentage? A property-management company in the area should have these aggregated.
- How much new for-sale + rental construction is in the pipeline within 1–3 miles? Heavy new supply typically softens prices + rents 12–24 months out; constrained supply supports both.
Investment metrics
- 1% rule
- 0.84% ✗
- Cap rate
- 6.21%
- Cash-on-cash
- -0.30%
- DSCR
- 0.99
- GRM
- 9.9
CMA / ARV
- ARV (on-the-fly)
- $221,544
- Comps found
- 12
Show comp detail 12 sales within ~0.75 mi
| Address | Dist | Beds/Ba | Sqft | Sold | Price | $/sf | Match |
|---|---|---|---|---|---|---|---|
| 1415 St Christopher Ct | 0.00mi | 3/1.5 | 1,224 (0%) | 1mo | $230,000 | $188 | 99 |
| 1421 Saint Michael Ct | 0.04mi | 3/2.0 | 1,224 (0%) | 2mo | $250,000 | $204 | 94 |
| 1471 Charlestown Dr | 0.38mi | 3/2.0 | 1,240 (+1%) | 2mo | $225,000 | $181 | 76 |
| 620 Yorkshire Dr | 0.26mi | 3/3.0 | 1,240 (+1%) | 4mo | $240,000 | $194 | 76 |
| 1443 Charlestown Dr | 0.37mi | 3/2.0 | 1,240 (+1%) | 6mo | $235,000 | $190 | 73 |
| 982 Topview Dr | 0.36mi | 3/1.5 | 1,278 (+4%) | 3mo | $205,000 | $160 | 73 |
| 1860 Eloise Ln | 0.63mi | 3/1.5 | 1,240 (+1%) | 0mo | $185,000 | $149 | 68 |
| 1407 Harford Square Dr | 0.20mi | 3/1.5 | 1,386 (+13%) | 1mo | $224,000 | $162 | 67 |
| 844 Angel Valley Ct | 0.47mi | 3/1.5 | 1,120 (-8%) | 3mo | $240,000 | $214 | 62 |
| 803 Angel Valley Ct | 0.38mi | 2/2.0 (-1) | 1,325 (+8%) | 0mo | $223,000 | $168 | 61 |
| 1875 Brookside Dr | 0.70mi | 4/1.5 (+1) | 1,240 (+1%) | 5mo | $214,900 | $173 | 56 |
| 1770 Judy Way | 0.67mi | 4/1.5 (+1) | 1,360 (+11%) | 2mo | $215,000 | $158 | 43 |
Match score weights: distance 35% · size 25% · config 20% · recency 20%. Top-matched comps best support the ARV.
Projected returns pro-forma
-3.0% appreciation · 4.92% rent growth · sell at horizon
- IRR
- -14.7%
- Equity multiple
- 0.46×
- Total profit
- $-35,252
- Equity at exit
- $35,039
- IRR
- -3.3%
- Equity multiple
- 0.76×
- Total profit
- $-15,500
- Equity at exit
- $20,319
Cash invested: $65,800 (down + closing). Projections, not guarantees.
Landlord ↔ Tenant lean methodology
- Overall (STATE)
- 27 Tenant-Leaning
- State Maryland
- 27 Tenant-Leaning · D+14
- County
- — inherits STATE
- City
- — inherits STATE
ZIP-level market 21040
- Home prices YoY
- -29.4%
- Rents YoY
- 4.9%
- Active inventory
- 94
- Price-to-rent
- 9.9×
Monthly cashflow live
- Estimated rent
- $1,970 high interval (Pro) →
- Mortgage (P&I)
- −$1,232
- Tax from tax record
- −$139 /mo · $1,664/yr
- Insurance
- −$98
- HOA
- −$104
- Vacancy / Maint / Mgmt
- −$414
- Net cashflow
- $-16
Break-even live
UW: 25.0% down · 7.5% · 30yr · 1.5% tax · 5.0% vac · 8.0% maint · 8.0% mgmt
Financing live
Cash to close
- Down payment
- $58,750
- Closing costs
- $7,050
- Reserves months
- —
- Total cash needed
- —
Loan-product check · same deal, 3 products live
Conventional
25% down · 7.5% · 30yr
- Down + closing
- —
- Monthly P&I
- —
- Monthly cashflow
- —
- DSCR
- —
- Eligible?
- —
Personal DTI + credit; lowest rate.
DSCR
20% down · 8.5% · 30yr
- Down + closing
- —
- Monthly P&I
- —
- Monthly cashflow
- —
- DSCR
- —
- Eligible?
- —
No personal income docs; deal must DSCR.
Hard money
10% down · 12.0% · 12mo
- Down + closing
- —
- Monthly P&I
- —
- Monthly cashflow
- —
- DSCR
- —
- Eligible?
- —
Short-term bridge; refi at stabilization.
Rent comps 14 comps
| Address | Beds | Baths | Sqft | Rent | $/sqft | DOM | Units | Dist |
|---|---|---|---|---|---|---|---|---|
| 1501 Saint Christopher Ct Edgewood, MD | 4.0 | 2.0 | 1224 | $2,200 | $1.80 | 12d | 1 | 0.05mi |
| 719 Woodbridge Center Way Edgewood, MD | 4.0 | 2.0 | 994 | $2,700 | $2.72 | 17d | 1 | 0.14mi |
| 802 Kingston Ct Edgewood, MD | 1.0–3.0 | 1.0–1.5 | 1007 | $1,883 | $1.87 | 1d | 15 | 0.17mi |
| 805 Windstream Way Unit 805B Edgewood, MD | 3.0 | 1.5 | 1260 | $1,450 | $1.15 | 21d | 1 | 0.19mi |
| 807 Windstream Way Unit 807-C Edgewood, MD | 3.0 | 1.5 | 1260 | $1,800 | $1.43 | 2d | 1 | 0.20mi |
| 807 W Spring Meadow Ct Edgewood, MD | 3.0 | 1.5 | 1400 | $1,850 | $1.32 | 43d | 1 | 0.27mi |
| 1523 Charlestown Dr Edgewood, MD | 3.0 | 1.5 | 1240 | $1,595 | $1.29 | 43d | 1 | 0.36mi |
| 962 Topview Dr Edgewood, MD | 3.0 | 1.5 | 1278 | $1,700 | $1.33 | 2d | 1 | 0.38mi |
| 1703 Fountain Rock Way Unit 1703-B Edgewood, MD | 2.0 | 1.0 | 882 | $1,250 | $1.42 | 23d | 1 | 0.41mi |
| 905 Swallow Crest Ct Unit E Edgewood, MD | 2.0 | 1.0 | 990 | $1,495 | $1.51 | 43d | 1 | 0.53mi |
| 1772 Judy Way Edgewood, MD | 3.0 | 1.5 | 1040 | $2,195 | $2.11 | 43d | 1 | 0.67mi |
| 1857 Simons Ct Edgewood, MD | 3.0 | 1.5 | 1240 | $1,700 | $1.37 | 43d | 1 | 0.74mi |
| 2033 Armstrong St Edgewood, MD | 1.0–4.0 | 1.0–2.0 | 1000 | $1,766 | $1.77 | 1d | 6 | 1.28mi |
| 2120 Cedar Dr Apt F Edgewood, MD | 3.0 | 1.5 | 1000 | $1,295 | $1.29 | 43d | 1 | 1.28mi |
HOA detail
- Monthly dues
- $104 · $1,248/yr
Listing history 20 events
-
2026-05-20status Pending
-
2026-03-11historical Active Under Contract
-
2026-03-01$235,000 Active
-
2021-02-19soldstatus $173,000 Closed 32-char remark
Show marketing remark (32 chars)
List & Sold Simultaneously
-
2020-12-19status Pending 32-char remark
Show marketing remark (32 chars)
List & Sold Simultaneously
-
2020-12-17Active Under Contract 32-char remark
Show marketing remark (32 chars)
List & Sold Simultaneously
-
2020-12-17$173,000 32-char remark
Show marketing remark (32 chars)
List & Sold Simultaneously
-
2006-03-22soldstatus $165,000
-
2006-03-10soldstatus $165,000 385-char remark
Show marketing remark (385 chars)
Adorable, brick front, 3 bedroom, 1.5 bath townhome with fenced yard nestled on quiet cul-de-sac. Lovely kitchen with pass through to dining room/living room with fireplace. Finished lower level with half bath and plenty of storage space. Home warranty. Come see this lovely home today! Seller in process of replacing carpet upstairs and will contribute to closing w/ full price offer.
-
2006-01-26historical 385-char remark
Show marketing remark (385 chars)
Adorable, brick front, 3 bedroom, 1.5 bath townhome with fenced yard nestled on quiet cul-de-sac. Lovely kitchen with pass through to dining room/living room with fireplace. Finished lower level with half bath and plenty of storage space. Home warranty. Come see this lovely home today! Seller in process of replacing carpet upstairs and will contribute to closing w/ full price offer.
-
2005-11-27$165,000 385-char remark
Show marketing remark (385 chars)
Adorable, brick front, 3 bedroom, 1.5 bath townhome with fenced yard nestled on quiet cul-de-sac. Lovely kitchen with pass through to dining room/living room with fireplace. Finished lower level with half bath and plenty of storage space. Home warranty. Come see this lovely home today! Seller in process of replacing carpet upstairs and will contribute to closing w/ full price offer.
-
2003-06-19soldstatus $87,400
-
2003-05-30soldstatus $87,400
-
2003-04-14historical
-
2003-04-09$87,500
-
2002-01-30historical
-
2001-03-12
-
2001-03-12historical
-
2000-03-07
-
1989-11-27soldstatus $77,000
ⓘ Source: listings_history table (triggers on properties + properties_extension) + one-shot
backfill from property_details.listing_events for pre-trigger history.
Tax reassessment forecast MD · Partial reset (capped growth)
- Current annual tax
- $1,664 · $139/mo
- Projected year-2 tax
- $2,113 · $176/mo
- Expected delta
- +$449/yr (+$37/mo · 27.0%)
ⓘ Screening estimate from a state-policy table — verify with the county assessor before closing.
Climate risk First Street
- Flood 1/10 Low FEMA zone X (unshaded) · 0% chance over 30 yrs
- Wildfire 1/10 Low
- Heat 7/10 Severe 7 d/yr ≥104°F today · 15 d/yr by 30 yrs out
- Wind 6/10 Major 27% chance of damaging wind over 30 yrs
- Air quality 4/10 Moderate 4 unhealthy d/yr today · 6 by 30 yrs out
Nearby sold comps map
Loading sold comps map…
Walkable amenities ~0.75 mi
Loading nearby amenities…
Taxation est. · year 1
- Rental income
- $23,643
- − Mortgage interest
- −$13,164
- − Property taxes
- −$1,664
- − Insurance
- −$1,175
- − Repairs & maintenance
- −$1,891
- − Management
- −$1,891
- − HOA
- −$1,248
- − Depreciation
- −$6,836
- Taxable loss
- −$4,227
- Est. tax savings @ 24.0%
- +$1,015
- After-tax cash flow
- $817/yr
For passive investors: Depreciation is non-cash, so a rental often shows a tax loss while cash-flowing — sheltering income. Rental losses are passive: they offset passive income freely, and up to $25,000/yr can offset ordinary (W-2) income if you actively participate and your MAGI is under $100k (phasing out to $0 by $150k); unused losses carry forward. On sale, claimed depreciation is recaptured at up to 25%, and gains may owe capital-gains tax (a 1031 exchange can defer both). Figures are a year-1 estimate at your 24.0% rate — not tax advice; consult a CPA.
Schools (NCES district)
- District
- Harford County Public Schools
- NCES district ID
- 2400390
- Math proficiency
- 22% ▼ -23.00%
- Reading proficiency
- 39% ▼ -12.00%
- Median HH income
- $79,569
- Composite
- 29.38/100
- National rank
- #6527
- State rank
- #9 of 24 in MD
Livability — Edgewood
- Score
- 73/100
- State rank
- #118
- US rank
- #4991
Category grades
Schools grade is shown separately in the Schools card above.
Census & demographics
- Census place
- Edgewood, MD
- County
- Harford County · 198,512 people
- City population
- 24,960
- Metro
- Baltimore-Columbia-Towson, MD
- Population (ZIP)
- 24,960
- Household income
- $81,704
- Rent vs Own
- Severe rent burden
- 859.0
Population outlook (Harford County) Hauer SSP2
- Today (2025)
- 262,292 people
- By 2030
- 266,437 · +1.6%
- By 2040
- 269,954 · +2.9%
- By 2050
- 265,659 · +1.3%
- By 2075
- 252,886 · -3.6%
- By 2100
- 224,014 · -14.6%
Race, ethnicity, and origin ACS 2023
- Neighborhood character
- Diverse neighborhood (Simpson 0.66)
- Race & ethnicity
- Black 45% White 36% Two or more races 11% Hispanic / Latino 10% Asian 2%
- Hispanic origin (detail)
- Mexican 1% Puerto Rican 2%
- Common ancestry
- Romanian 4% Slovak 1% Italian 1%
- Foreign-born
- 8% · Canada, South Korea
- Languages at home
- 89% English-only · Spanish 5% Russian/Polish/Slavic 2% German/W. Germanic 1%
Political lean MEDSL · Harford
- 2024 margin
- R (+13.8) · D 41.9% · R 55.7% · Other 2.4%
- 2008→2024 swing
- +5.0pp toward D · 2008: -18.8pp · 2024: -13.8pp
- All cycles
- 2024: R+13.8 2020: R+12.0 2016: R+24.5 2012: R+19.5 2008: R+18.8
Not yet ingested
- Civics
- —
Market trends
- HPI YoY
- ▼ -106.14%
- Current HPI
- 254.2305
- Rent YoY
- ▲ 4.92%
- Metro
- Baltimore-Columbia-Towson, MD
- State GDP YoY
- ▲ 2.97%
- F500 in state
- 12
Industry mix (Fortune 500 HQ in MD)
| Industry | F500 HQs | Revenue |
|---|---|---|
| Aerospace / Defense | 1 | $71B |
|
||
| Utilities | 1 | $25B |
|
||
| Hotels | 1 | $24B |
|
||
| Consumer Goods | 1 | $7B |
|
||
| Real Estate | 1 | $6B |
|
||
| Chemicals | 1 | $2B |
|
||
Price history
+205.2% since first listed20 events — show timeline
- 2026-05-20 Pending — BRIGHT MLS
- 2026-03-11 Contingent — BRIGHT MLS
- 2026-03-01 Listed $235,000 BRIGHT MLS
- 2021-02-19 Sold (MLS) $173,000 BRIGHT MLS
- 2020-12-19 Pending — BRIGHT MLS
- 2020-12-17 Listed — BRIGHT MLS
- 2020-12-17 Listed $173,000 BRIGHT MLS
- 2006-03-22 Sold (Public Records) $165,000 Public Records
- 2006-03-10 Sold (MLS) $165,000 MRIS
- 2006-01-26 Delisted — MRIS
- 2005-11-27 Listed $165,000 MRIS
- 2003-06-19 Sold (Public Records) $87,400 Public Records
- 2003-05-30 Sold (MLS) $87,400 MRIS
- 2003-04-14 Delisted — MRIS
- 2003-04-09 Listed $87,500 MRIS
- 2002-01-30 Delisted — MRIS
- 2001-03-12 Delisted — MRIS
- 2001-03-12 Listed — MRIS
- 2000-03-07 Listed — MRIS
- 1989-11-27 Sold (Public Records) $77,000 Public Records
Property tax history
+1.7%/yrLatest (2025): $1,664 · +7.4% YoY. Source: county tax records.
Cash-flow waterfall
monthlySold comps — $/sqft
last 12 mo · ≤1 miLoading sold comps…