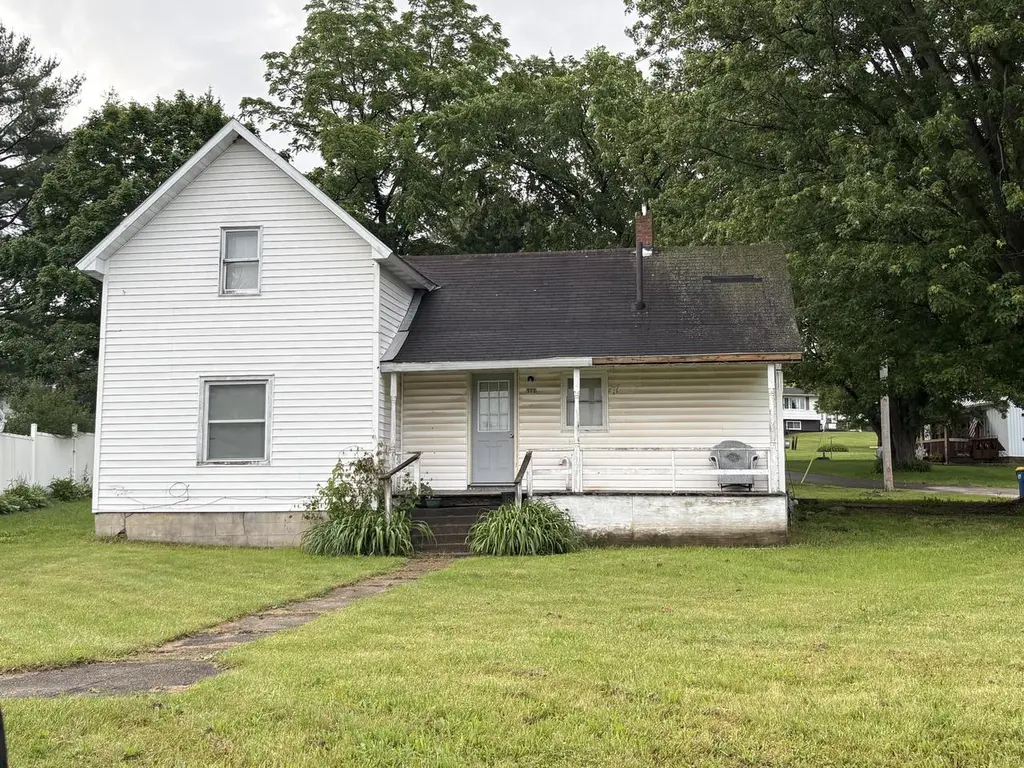
322 S Commercial St · Viola, WI
Flood risk 1/10 · Minimal
- FEMA flood zone
- X (unshaded)
- Chance of flooding over 30 yrs
- 0.0%
- Est. flood insurance / yr
- $473 – $860
Fire risk 2/10 · Minimal
- Est. fire insurance / yr
- $636 – $1,182
Heat risk 2/10 · Minimal
- Hot days now (above 99°F)
- 7 days/yr
- Hot days in 30 yrs
- 14 days/yr
Wind risk 2/10 · Minimal
- Chance of severe wind over 30 yrs
- —
Air-quality risk 1/10 · Minimal
- Unhealthy air days now
- 0 days/yr
- Unhealthy air days in 30 yrs
- 0 days/yr
Risk factors via First Street. Map © Google.
Why this score? — see what drove the B+ grade
The composite is a weighted blend of 9 inputs, each scored 0–100. Each bar is that input's sub-score; the figure is the points it added to the 100-point composite (weight × sub-score).
- Cash flow +30.0/30.0
- 1% rule +10.0/10.0
- DSCR +10.0/10.0
- Appreciation +8.7/10.0
- ARV discount +7.5/15.0
- Livability +3.2/5.0
- Schools +2.9/10.0
- Rent growth +2.5/5.0
- Condition / age +2.5/5.0
$59,000
🖨 Deal sheet 📄 Offer letter ✓ Due diligence
Listing remarks MLS
THIS COZY TWO BEDROOM, ONE BATH HOME SITS IN THE VILLAGE OF VIOLA. THE MAIN LEVEL CONSISTS OF A LARGE LIVING ROOM, EAT-IN KITCHEN, MASTER BEDROOM, FULL BATH, AND A MUD ROOM. UPPER LEVEL HAS A LANDING, THAT COULD A USED AS AN OFFICE OR A WALK THROUGH NURSERY, AND A NICE SIZED BEDROOM. THERE IS A ONE CAR ATTACHED GARAGE. NEWER IMPROVEMENTS INCLUDE FURNACE, WATER HEATER, AND SOME NEW WINDOWS. DON'T MISS OUT! CALL TODAY!
Key facts
- 0.25 acre lot
- Garage
- Built 1930
Property features AI
Exterior
- Parking: Attached 1-car garage; One additional parking space
- Utilities: Municipal water; Municipal sewer
- Home design: Two-story single-family home; Year built: see remarks
- Exterior features: Vinyl exterior; Lot less than 1/2 acre (approx. 0.25 acre); Residential zoning
Interior
- Kitchen: Kitchen on main level approximately 14 x 15; Oven; Refrigerator; Refrigerator and stove included
- Bedrooms: Master bedroom on main level approximately 11 x 13; Second bedroom on upper level approximately 14 x 16
- Bathrooms: One full bathroom
- Heating & cooling: Forced air heating; Natural gas fuel
- Interior features: Partial basement; Living room (main level) approximately 15 x 16; Additional upper-level room approximately 6 x 16
Neighborhood map
What this means for you Summary
Snapshot
- This is a 2-bed/1.0-bath other listed at $59k.
Deal economics
- At list price, monthly cash flow is $336 ($4k/yr) — positive.
- The deal already cash-flows at list — no discount required.
- Meets the 1% rule at list price ($978 rent vs $59k).
Location & tenants
- Location reads 63/100 on livability (#609 in WI) — a middle-class / working-renter tenant base. Strengths: cost of living A+, housing A; Watch: crime D+, health & safety D, amenities F.
- Kickapoo Area School District (rural): math 30% / reading 40% proficiency, ranked #239 of 342 in WI (top 70%) — families likely to look elsewhere, expect single-tenant / working-renter base with shorter leases.
- Zoned schools: Kickapoo Elementary (math 42% / reading 52%, grade D-, #319 of 1,041 statewide, top 34%, 205 students, 57% FRL); Kickapoo High (math 22% / reading 32%, grade F, #260 of 483 statewide, top 58%, 265 students, 42% FRL).
- Market conditions: 10 active listings in the ZIP; 117 units permitted in Vernon County in 2024 (0 in 5+ unit buildings).
Forward outlook
- In year one you build about $5k of equity ($408 loan paydown + $4k appreciation (7.3% local appreciation)).
- Vernon County population projected to shrink 9% by 2050 — rents likely to lag national; underwrite the cash flow, not the appreciation.
- At projected returns (7.3% appreciation + 3.0% rent growth), your $17k cash investment doubles in ~2 years — after that, you're playing with house money.
- By year 7, paydown + projected appreciation supports a ~$32k cash-out refi (75% LTV) — recoverable capital for the next deal without selling this one.
Negotiation context
- Only 1 days on market — expect competitive offers; lowballing is unlikely to land.
- 2 sale attempts since 11y ago with the ask held roughly flat each time — persistent listings suggest the price (not the market) is what's stuck; bring a comps-based counter.
Risks & watch-outs
- Watch-outs: built in 1930 — expect roof / HVAC / electrical / plumbing capex.
Questions for the listing agent
- Built in 1930 — when were the roof, HVAC, electrical panel, plumbing, and water heater last replaced?
- Is there a deadline driving the sale (1031 exchange, divorce, estate, relocation)? That informs how much negotiation room exists.
- Schools are D-rated, which usually means shorter tenancies and higher turnover. Who's the typical renter profile here, and what's been the actual vacancy rate?
- Crime grade is D in this area — have there been break-ins, vandalism, or insurance claims at this property in the last 3 years? What carrier currently insures it and at what premium?
- What's the average days-on-market for RENTAL listings here right now (not sales)? A rising rental-DOM trend means longer vacancies and softer asking-rent achievability than the comps imply.
- What's the recent tenant-quality profile in this submarket — average credit score on applications, eviction rate, late-payment / NSF rate, and stable-employment percentage? A property-management company in the area should have these aggregated.
- How much new for-sale + rental construction is in the pipeline within 1–3 miles? Heavy new supply typically softens prices + rents 12–24 months out; constrained supply supports both.
Investment metrics
- 1% rule
- 1.66% ✓
- Cap rate
- 13.14%
- Cash-on-cash
- 24.44%
- DSCR
- 2.09
- GRM
- 5.0
CMA / ARV
No comps found within radius.
Projected returns pro-forma
7.32% appreciation · 3.0% rent growth · sell at horizon
- IRR
- 38.3%
- Equity multiple
- 3.62×
- Total profit
- $43,238
- Equity at exit
- $42,133
- IRR
- 34.6%
- Equity multiple
- 7.64×
- Total profit
- $109,613
- Equity at exit
- $81,191
Cash invested: $16,520 (down + closing). Projections, not guarantees.
Landlord ↔ Tenant lean methodology
- Overall (STATE)
- 73 Landlord-Friendly
- State Wisconsin
- 73 Landlord-Friendly · R+2
- County
- — inherits STATE
- City
- — inherits STATE
ZIP-level market 54664
- Home prices YoY
- 3.5%
- Active inventory
- 10
- Price-to-rent
- 5.0×
Monthly cashflow live
- Estimated rent
- $978 medium interval (Pro) →
- Mortgage (P&I)
- −$309
- Tax from tax record
- −$102 /mo · $1,221/yr
- Insurance
- −$25
- HOA
- −$0
- Vacancy / Maint / Mgmt
- −$205
- Net cashflow
- $336
Break-even live
UW: 25.0% down · 7.5% · 30yr · 1.5% tax · 5.0% vac · 8.0% maint · 8.0% mgmt
Financing live
Cash to close
- Down payment
- $14,750
- Closing costs
- $1,770
- Reserves months
- —
- Total cash needed
- —
Loan-product check · same deal, 3 products live
Conventional
25% down · 7.5% · 30yr
- Down + closing
- —
- Monthly P&I
- —
- Monthly cashflow
- —
- DSCR
- —
- Eligible?
- —
Personal DTI + credit; lowest rate.
DSCR
20% down · 8.5% · 30yr
- Down + closing
- —
- Monthly P&I
- —
- Monthly cashflow
- —
- DSCR
- —
- Eligible?
- —
No personal income docs; deal must DSCR.
Hard money
10% down · 12.0% · 12mo
- Down + closing
- —
- Monthly P&I
- —
- Monthly cashflow
- —
- DSCR
- —
- Eligible?
- —
Short-term bridge; refi at stabilization.
Listing history 2 events
-
2026-06-18remarks 354-char remark
-
2026-06-18$59,000 Active 1 DOM
ⓘ Source: listings_history table (triggers on properties + properties_extension) + one-shot
backfill from property_details.listing_events for pre-trigger history.
Tax reassessment forecast WI · Partial reset (capped growth)
- Current annual tax
- $1,221 · $102/mo
- Projected year-2 tax
- $1,221 · $102/mo
- Expected delta
- $0/yr ($0/mo · 0.0%)
ⓘ Screening estimate from a state-policy table — verify with the county assessor before closing.
Climate risk First Street
- Flood 1/10 Low FEMA zone X (unshaded) · 0% chance over 30 yrs
- Wildfire 2/10 Low
- Heat 2/10 Low 7 d/yr ≥99°F today · 14 d/yr by 30 yrs out
- Wind 2/10 Low
- Air quality 1/10 Low 0 unhealthy d/yr today · 0 by 30 yrs out
Nearby sold comps map
Loading sold comps map…
Walkable amenities ~0.75 mi
Loading nearby amenities…
Taxation est. · year 1
- Rental income
- $11,730
- − Mortgage interest
- −$3,305
- − Property taxes
- −$1,221
- − Insurance
- −$295
- − Repairs & maintenance
- −$938
- − Management
- −$938
- − Depreciation
- −$1,716
- Taxable income
- $3,316
- Est. tax owed @ 24.0%
- −$796
- After-tax cash flow
- $3,242/yr
For passive investors: Depreciation is non-cash, so a rental often shows a tax loss while cash-flowing — sheltering income. Rental losses are passive: they offset passive income freely, and up to $25,000/yr can offset ordinary (W-2) income if you actively participate and your MAGI is under $100k (phasing out to $0 by $150k); unused losses carry forward. On sale, claimed depreciation is recaptured at up to 25%, and gains may owe capital-gains tax (a 1031 exchange can defer both). Figures are a year-1 estimate at your 24.0% rate — not tax advice; consult a CPA.
Schools (NCES district)
- District
- Kickapoo Area School District
- NCES district ID
- 5512540
- Math proficiency
- 30% ▼ -4.00%
- Reading proficiency
- 40% ▲ 3.00%
- Median HH income
- $41,104
- Composite
- 29.46/100
- National rank
- #6512
- State rank
- #239 of 342 in WI
Livability — Viola
- Score
- 63/100
- State rank
- #609
- US rank
- #15774
Category grades
Schools grade is shown separately in the Schools card above.
Census & demographics
- Census place
- Viola, WI
- Population (ZIP)
- 1,659
Population outlook (Vernon County) Hauer SSP2
- Today (2025)
- 30,605 people
- By 2030
- 30,461 · -0.5%
- By 2040
- 29,595 · -3.3%
- By 2050
- 27,730 · -9.4%
- By 2075
- 22,308 · -27.1%
- By 2100
- 14,855 · -51.5%
Race, ethnicity, and origin ACS 2023
- Neighborhood character
- Predominantly White (95%)
- Race & ethnicity
- White 95% Two or more races 2% Hispanic / Latino 1%
- Common ancestry
- Portuguese 13% Polish 10% Romanian 4%
- Foreign-born
- 1% · Canada
- Languages at home
- 86% English-only · German/W. Germanic 12% Spanish 1%
Political lean MEDSL · Vernon
- 2024 margin
- Lean R (+7.8) · D 45.3% · R 53.1% · Other 1.6%
- 2008→2024 swing
- -29.8pp toward R · 2008: 22.0pp · 2024: -7.8pp
- All cycles
- 2024: R+7.8 2020: R+4.8 2016: R+4.5 2012: D+14.8 2008: D+22.0
Not yet ingested
- Civics
- —
Market trends
- HPI YoY
- ▲ 7.32%
- Current HPI
- 214.39
- Rent YoY
- —
- Metro
- —
- State GDP YoY
- ▲ 2.10%
- F500 in state
- 20
Industry mix (Fortune 500 HQ in WI)
| Industry | F500 HQs | Revenue |
|---|---|---|
| Industrial Machinery | 4 | $23B |
|
||
| Industrial Technology | 2 | $36B |
|
||
| Insurance | 1 | $36B |
|
||
| Professional Services | 1 | $19B |
|
||
| Utilities | 1 | $9B |
|
||
| Consumer Goods | 1 | $3B |
|
||
Price history
+7.5% since first listed3 events — show timeline
- 2026-06-17 Listed $59,000 METROMLS
- 2016-05-22 Listing Removed — METROMLS
- 2015-06-12 Listed $54,900 METROMLS
Property tax history
+2.7%/yrLatest (2025): $1,221 · +20.8% YoY. Source: county tax records.
Cash-flow waterfall
monthlySold comps — $/sqft
last 12 mo · ≤1 miLoading sold comps…