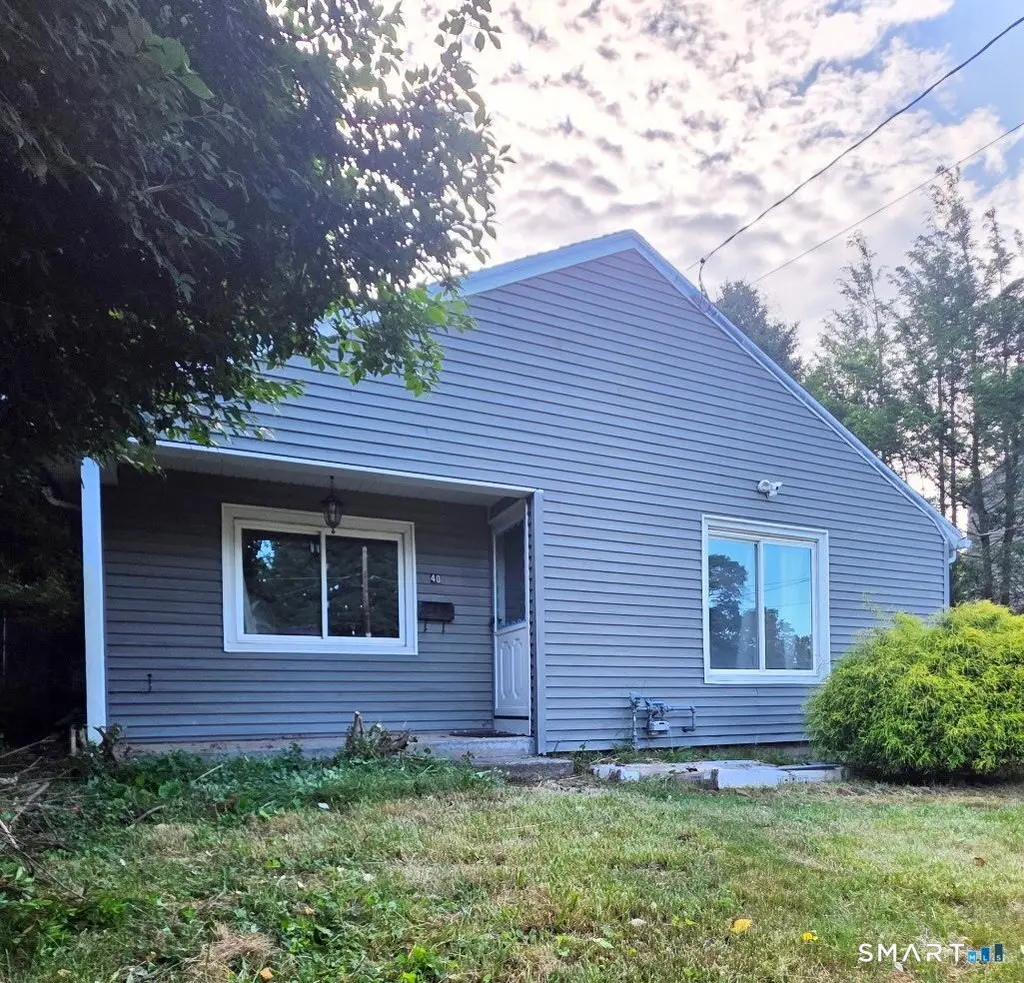
40 Concord St · Bristol, CT
Flood risk No data
- FEMA flood zone
- —
- Chance of flooding over 30 yrs
- —
- Est. flood insurance / yr
- —
Fire risk No data
- Est. fire insurance / yr
- —
Heat risk No data
- Hot days now (above threshold)
- —
- Hot days in 30 yrs
- —
Wind risk No data
- Chance of severe wind over 30 yrs
- —
Air-quality risk No data
- Unhealthy air days now
- —
- Unhealthy air days in 30 yrs
- —
Risk factors via First Street. Map © Google.
Why this score? — see what drove the C- grade
The composite is a weighted blend of 9 inputs, each scored 0–100. Each bar is that input's sub-score; the figure is the points it added to the 100-point composite (weight × sub-score).
- ARV discount +15.0/15.0
- Cash flow +13.6/30.0
- 1% rule +4.3/10.0
- DSCR +4.1/10.0
- Livability +4.0/5.0
- Rent growth +3.9/5.0
- Schools +3.2/10.0
- Condition / age +2.5/5.0
- Appreciation +0.0/10.0
$184,900
🖨 Deal sheet (PDF) 📄 Offer letter ✓ Due diligence
Listing remarks MLS
Ranch style home, enjoy first floor living, great home for first time home buyers or if your downsizing, hardwood floors under carpet, 3 bedrooms, newer natural gas heating system, vinyl siding, nice location, close to shopping!
Key facts
- Covered front porch
- Fenced yard
- Ranch style home
Tags
Property features AI
Exterior
- Parking: Paved driveway with off-street parking; Approximately 4 total parking spaces
- Utilities: Public water connected; Public sewer connected; Natural gas domestic hot water; Natural gas heating; Ridge vents (energy feature)
- Home design: Single-family home
- Construction: Frame construction; Concrete foundation; Asphalt shingle roof
- Exterior features: Vinyl siding; Shed; Gutters; Exterior lighting; Partially fenced yard with wood and chain-link fencing; Lightly wooded, level lot; Private paved driveway
Interior
- Kitchen: Range hood; Refrigerator
- Bedrooms: 3 bedrooms
- Bathrooms: 1 full bathroom
- Heating & cooling: Baseboard heating (natural gas); Window cooling unit(s)
- Interior features: Cable available; Full unfinished heated basement with interior access, concrete floor, storage and full hatchway; Attic with pull-down stairs
- Laundry & utility: Laundry room on lower level
Neighborhood map
What this means for you Summary
Snapshot
- This is a 3-bed/1.0-bath single-family listed at $185k.
Deal economics
- At list price, monthly cash flow is $12 ($139/yr) — positive.
- The deal already cash-flows at list — no discount required.
- To meet the 1% rule (rent ≥ 1% of price), the offer needs to be $173k (6.5% below list).
- Recommended offer: $173k (6.5% below list) — sets the bar for 1% rule.
- Cap rate 6.4% vs local median 3.3% in Bristol — top-decile yield for the area; either an underpriced asset or a hidden risk that comps aren't pricing in. Stress-test before assuming the spread holds.
Location & tenants
- Location reads 81/100 on livability (#21 in CT, #1,585 nationally) — a professional / high-income tenant draw. Strengths: crime A+, housing A+, health & safety A+; Watch: commute F.
- Bristol School District (suburban): math 28% / reading 44% proficiency, ranked #109 of 153 in CT (top 71%) — families likely to look elsewhere, expect single-tenant / working-renter base with shorter leases.
- Zoned schools: Stafford School (math 22% / reading 32%, grade F, #401 of 553 statewide, top 74%, 346 students, 59% FRL); Chippens Hill Middle School (math 26% / reading 50%, grade F, #111 of 175 statewide, top 63%, 580 students, 53% FRL); Bristol Eastern High School (math 23% / reading 51%, grade F, #112 of 194 statewide, top 60%, 1,113 students, 46% FRL) — zoned schools average 53% FRL vs 37% district-wide (16 pts higher); higher-poverty schools than district average — tighter screening recommended.
- Market conditions: Rents rising fast (+5.4%/yr); 222 active listings in the ZIP; 30 comparable units currently listed for rent nearby; rentals lingering (median 46d on market — plan ~5-8 weeks vacancy on turnover, expect pricing pressure); 57% of comp listings sitting > 30 days — soft ceiling on asking rent; solid renter incomes; 502 units permitted in Naugatuck Valley Planning Region in 2024 (171 in 5+ unit buildings).
Forward outlook
- Local home prices are declining (-3.0%/yr); year-one equity from $1k of loan paydown is wiped out by about $6k of value loss. Plan a longer hold.
Negotiation context
- Only 3 days on market — expect competitive offers; lowballing is unlikely to land.
- 4 sale attempts since 19y ago with the ask held roughly flat each time — persistent listings suggest the price (not the market) is what's stuck; bring a comps-based counter.
Risks & watch-outs
- Watch-outs: built in 1900 — expect roof / HVAC / electrical / plumbing capex.
Questions for the listing agent
- Built in 1900 — when were the roof, HVAC, electrical panel, plumbing, and water heater last replaced?
- Is there a deadline driving the sale (1031 exchange, divorce, estate, relocation)? That informs how much negotiation room exists.
- What's the average days-on-market for RENTAL listings here right now (not sales)? A rising rental-DOM trend means longer vacancies and softer asking-rent achievability than the comps imply.
- What's the recent tenant-quality profile in this submarket — average credit score on applications, eviction rate, late-payment / NSF rate, and stable-employment percentage? A property-management company in the area should have these aggregated.
- How much new for-sale + rental construction is in the pipeline within 1–3 miles? Heavy new supply typically softens prices + rents 12–24 months out; constrained supply supports both.
Investment metrics
- 1% rule
- 0.93% ✗
- Cap rate
- 6.37%
- Cash-on-cash
- 0.27%
- DSCR
- 1.01
- GRM
- 8.9
CMA / ARV
- ARV (on-the-fly)
- $269,244
- Comps found
- 11
Show comp detail 11 sales within ~0.75 mi
| Address | Dist | Beds/Ba | Sqft | Sold | Price | $/sf | Match |
|---|---|---|---|---|---|---|---|
| 51 Sharon St | 0.17mi | 3/1.5 | 936 (-4%) | 7mo | $305,000 | $326 | 78 |
| 81 Birge Rd | 0.46mi | 4/1.0 (+1) | 972 (0%) | 0mo | $307,500 | $316 | 73 |
| 77 Lewis St | 0.11mi | 2/1.0 (-1) | 1,032 (+6%) | 21mo | $180,000 | $174 | 62 |
| 56 Maheu St | 0.71mi | 3/1.5 | 994 (+2%) | 7mo | $305,000 | $307 | 55 |
| 81 Hoover Ave | 0.41mi | 4/1.0 (+1) | 1,114 (+15%) | 1mo | $300,000 | $269 | 51 |
| 53 Boivin St | 0.70mi | 3/1.5 | 994 (+2%) | 14mo | $320,000 | $322 | 50 |
| 156 Moody St | 0.57mi | 2/1.0 (-1) | 948 (-2%) | 19mo | $265,000 | $280 | 49 |
| 54 Vance Rd | 0.69mi | 3/1.0 | 1,114 (+15%) | 8mo | $300,000 | $269 | 37 |
| 49 Merriman St | 0.74mi | 2/1.0 (-1) | 1,040 (+7%) | 18mo | $288,000 | $277 | 34 |
| 40 Roberts St | 0.53mi | 2/1.0 (-1) | 1,070 (+10%) | 24mo | $250,000 | $234 | 34 |
| 81 Jerome Ave | 0.57mi | 3/1.5 | 1,093 (+12%) | 21mo | $280,000 | $256 | 33 |
Match score weights: distance 35% · size 25% · config 20% · recency 20%. Top-matched comps best support the ARV.
Projected returns pro-forma
-3.0% appreciation · 5.41% rent growth · sell at horizon
- IRR
- -13.0%
- Equity multiple
- 0.52×
- Total profit
- $-24,859
- Equity at exit
- $27,569
- IRR
- -0.5%
- Equity multiple
- 0.96×
- Total profit
- $-1,893
- Equity at exit
- $15,987
Cash invested: $51,772 (down + closing). Projections, not guarantees.
Landlord ↔ Tenant lean methodology
- Overall (STATE)
- 27 Tenant-Leaning
- State Connecticut
- 27 Tenant-Leaning · D+7
- County
- — inherits STATE
- City
- — inherits STATE
ZIP-level market 06010
- Rents YoY
- 5.4%
- Active inventory
- 222
- Price-to-rent
- 8.9×
Monthly cashflow live
- Estimated rent
- $1,729 high interval (Pro) →
- Mortgage (P&I)
- −$970
- Tax from tax record
- −$308 /mo · $3,690/yr
- Insurance
- −$77
- HOA
- −$0
- Vacancy / Maint / Mgmt
- −$363
- Net cashflow
- $12
Break-even live
Sensitivity live
| Price | -10% $116 | -5% $64 | +0% $12 | +5% $-41 | +10% $-93 |
|---|---|---|---|---|---|
| Rent | -10% $-125 | -5% $-57 | +0% $12 | +5% $80 | +10% $148 |
| Rate | -1.0pp $105 | -0.5pp $59 | base $12 | +0.5pp $-36 | +1.0pp $-85 |
UW: 25.0% down · 7.5% · 30yr · 1.5% tax · 5.0% vac · 8.0% maint · 8.0% mgmt
Financing live
Cash to close
- Down payment
- $46,225
- Closing costs
- $5,547
- Reserves months
- —
- Total cash needed
- —
Loan-product check · same deal, 3 products live
Conventional
25% down · 7.5% · 30yr
- Down + closing
- —
- Monthly P&I
- —
- Monthly cashflow
- —
- DSCR
- —
- Eligible?
- —
Personal DTI + credit; lowest rate.
DSCR
20% down · 8.5% · 30yr
- Down + closing
- —
- Monthly P&I
- —
- Monthly cashflow
- —
- DSCR
- —
- Eligible?
- —
No personal income docs; deal must DSCR.
Hard money
10% down · 12.0% · 12mo
- Down + closing
- —
- Monthly P&I
- —
- Monthly cashflow
- —
- DSCR
- —
- Eligible?
- —
Short-term bridge; refi at stabilization.
Rent comps 30 comps
| Address | Beds | Baths | Sqft | Rent | $/sqft | DOM | Units | Dist |
|---|---|---|---|---|---|---|---|---|
| 74 Burlington Ave Bristol, CT | 2.0 | 1.0 | 976 | $1,300 | $1.33 | 46d | 1 | 0.36mi |
| 65 Wooding St Unit 2 Bristol, CT | 2.0 | 1.0 | 1000 | $1,700 | $1.70 | 46d | 1 | 0.38mi |
| 4 Willoughby St Unit 1ST Bristol, CT | 3.0 | 1.0 | 880 | $1,800 | $2.05 | 46d | 1 | 0.41mi |
| 56 Ingraham Pl Unit 2 Bristol, CT | 2.0 | 1.0 | 800 | $1,800 | $2.25 | 18d | 1 | 0.48mi |
| 56 Ingraham Pl Unit 3 Bristol, CT | 3.0 | 1.0 | 1000 | $2,100 | $2.10 | 18d | 1 | 0.48mi |
| 11 Roberts St Unit 2 Bristol, CT | 2.0 | 1.0 | 750 | $1,350 | $1.80 | 46d | 1 | 0.52mi |
| 175 Goodwin St Unit 2nd Floor Bristol, CT | 2.0 | 1.0 | 1100 | $1,450 | $1.32 | 0d | 1 | 0.71mi |
| 443 N Main St Unit 2A Bristol, CT | 2.0 | 1.0 | 800 | $1,800 | $2.25 | 46d | 1 | 0.74mi |
| 435 N Main St Unit 5 Bristol, CT | 2.0 | 1.0 | 800 | $1,400 | $1.75 | 23d | 1 | 0.75mi |
| 431 N Main St Unit 12 Bristol, CT | 2.0 | 1.0 | 850 | $1,595 | $1.88 | 23d | 1 | 0.75mi |
| 431 N Main St Unit 16 Bristol, CT | 2.0 | 1.0 | 950 | $1,695 | $1.78 | 46d | 1 | 0.75mi |
| 431 N Main St Unit 8 Bristol, CT | 2.0 | 1.0 | 850 | $1,595 | $1.88 | 46d | 1 | 0.75mi |
| 425 N Main St Bristol, CT | 2.0 | 1.0 | 900 | $1,595 | $1.77 | 46d | 1 | 0.76mi |
| 411 N Main St #15 Bristol, CT | 2.0 | 1.0 | 875 | $1,595 | $1.82 | 25d | 1 | 0.78mi |
| 411 N Main St Unit 8 Bristol, CT | 2.0 | 1.0 | 1012 | $1,595 | $1.58 | 46d | 1 | 0.78mi |
| 9B Daniel Rd Unit 9B Bristol, CT | 3.0 | 1.0 | 786 | $2,150 | $2.74 | 25d | 1 | 0.89mi |
| 556 King St Bristol, CT | 1.0–2.0 | 1.0 | 712 | $1,400 | $1.96 | 0d | 1 | 0.90mi |
| 407 West St Unit 2nd Floor Bristol, CT | 3.0 | 1.0 | 1100 | $1,425 | $1.30 | 46d | 1 | 0.97mi |
| 403 West St Unit 1st FL Bristol, CT | 2.0 | 1.0 | 1044 | $1,375 | $1.32 | 46d | 1 | 0.98mi |
| 130 N Main St Unit 130-310 Bristol, CT | 2.0 | 1.0 | 1101 | $2,300 | $2.09 | 46d | 1 | 1.05mi |
| 34 Center St Unit 2 Bristol, CT | 2.0 | 1.0 | 900 | $1,350 | $1.50 | 46d | 1 | 1.07mi |
| 57 Kelley St Unit 3 Bristol, CT | 2.0 | 1.0 | 952 | $1,550 | $1.63 | 12d | 1 | 1.07mi |
| 44 Kelley St Unit 1 Bristol, CT | 2.0 | 1.0 | 762 | $1,400 | $1.84 | 25d | 1 | 1.08mi |
| 218 West St Unit B1 Bristol, CT | 2.0 | 1.0 | 1000 | $1,525 | $1.52 | 25d | 1 | 1.21mi |
| 218 West St Unit B2 Bristol, CT | 2.0 | 1.0 | 1000 | $1,550 | $1.55 | 25d | 1 | 1.21mi |
| 130 Main St Unit 210 Bristol, CT | 2.0 | 2.0 | 1101 | $2,300 | $2.09 | 46d | 1 | 1.28mi |
| 130 Main St Unit 310 Bristol, CT | 2.0 | 1.0 | 1101 | $2,300 | $2.09 | 46d | 1 | 1.28mi |
| 252 Blakeslee St #4 Bristol, CT | 2.0 | 1.5 | 800 | $1,800 | $2.25 | 46d | 1 | 1.31mi |
| 25 Pratt St Unit 3 Bristol, CT | 2.0 | 1.0 | 1068 | $1,375 | $1.29 | 25d | 1 | 1.40mi |
| 50 Hillside Pl Unit 3 Bristol, CT | 3.0 | 1.0 | 858 | $1,600 | $1.86 | 46d | 1 | 1.44mi |
Listing history 4 events
-
2026-06-15status $184,900 Under Contract 3 DOM
-
2026-06-15days on market $184,900 Active 3 DOM
-
2026-06-13remarks 699-char remark
-
2026-06-13$184,900 Active 1 DOM
ⓘ Source: listings_history table (triggers on properties + properties_extension) + one-shot
backfill from property_details.listing_events for pre-trigger history.
Tax reassessment forecast CT · Partial reset (capped growth)
- Current annual tax
- $3,690 · $308/mo
- Projected year-2 tax
- $3,823 · $319/mo
- Expected delta
- +$133/yr (+$11/mo · 3.6%)
ⓘ Screening estimate from a state-policy table — verify with the county assessor before closing.
Nearby sold comps map
Loading sold comps map…
Walkable amenities ~0.75 mi
Loading nearby amenities…
Taxation est. · year 1
- Rental income
- $20,746
- − Mortgage interest
- −$10,357
- − Property taxes
- −$3,690
- − Insurance
- −$924
- − Repairs & maintenance
- −$1,660
- − Management
- −$1,660
- − Depreciation
- −$5,379
- Taxable loss
- −$2,924
- Est. tax savings @ 24.0%
- +$702
- After-tax cash flow
- $841/yr
For passive investors: Depreciation is non-cash, so a rental often shows a tax loss while cash-flowing — sheltering income. Rental losses are passive: they offset passive income freely, and up to $25,000/yr can offset ordinary (W-2) income if you actively participate and your MAGI is under $100k (phasing out to $0 by $150k); unused losses carry forward. On sale, claimed depreciation is recaptured at up to 25%, and gains may owe capital-gains tax (a 1031 exchange can defer both). Figures are a year-1 estimate at your 24.0% rate — not tax advice; consult a CPA.
Schools (NCES district)
- District
- Bristol School District
- NCES district ID
- 0900510
- Math proficiency
- 28% ▼ -10.00%
- Reading proficiency
- 44% ▼ -5.00%
- Median HH income
- $59,953
- Composite
- 32.07/100
- National rank
- #5814
- State rank
- #109 of 153 in CT
Livability — Bristol
- Score
- 81/100
- State rank
- #21
- US rank
- #1585
Category grades
Schools grade is shown separately in the Schools card above.
Census & demographics
- Census place
- Bristol, CT
- County
- Hartford County · 754,208 people
- City population
- 61,684
- Metro
- Hartford-East Hartford-Middletown, CT
- Population (ZIP)
- 61,684
- Household income
- $79,314
- Rent vs Own
- Severe rent burden
- 2172.0
Population outlook (Naugatuck Valley County) Hauer SSP2
- By 2040
- 496,846
Race, ethnicity, and origin ACS 2023
- Neighborhood character
- Majority White (65%)
- Race & ethnicity
- White 65% Hispanic / Latino 19% Two or more races 13% Black 7% Asian 5%
- Hispanic origin (detail)
- Mexican 2% Puerto Rican 13%
- Common ancestry
- Lithuanian 11% Romanian 10% Slovak 1%
- Foreign-born
- 10% · Canada
- Languages at home
- 79% English-only · Spanish 11% Other Indo-European 3% Russian/Polish/Slavic 2%
Political lean MEDSL · Naugatuck Valley
- 2024 margin
- Lean R (+7.4) · D 45.6% · R 53.0% · Other 1.4%
- All cycles
- 2024: R+7.4
Not yet ingested
- Civics
- —
Market trends
- HPI YoY
- ▼ -293.55%
- Current HPI
- 255.5419
- Rent YoY
- ▲ 5.41%
- Metro
- Hartford-East Hartford-Middletown, CT
- State GDP YoY
- ▲ 1.06%
- F500 in state
- 38
Industry mix (Fortune 500 HQ in CT)
| Industry | F500 HQs | Revenue |
|---|---|---|
| Industrial Machinery | 4 | $38B |
|
||
| Insurance | 3 | $71B |
|
||
| Financial Services | 2 | $25B |
|
||
| Transportation / Logistics | 2 | $18B |
|
||
| Healthcare | 1 | $247B |
|
||
| Telecommunications | 1 | $55B |
|
||
Price history
+32.2% since first listed11 events — show timeline
- 2026-06-12 Listed $184,900 Smart MLS
- 2022-12-08 Sold (Public Records) $172,000 Public Records
- 2022-12-08 Sold (MLS) $172,000 Smart MLS
- 2022-12-06 Pending — Smart MLS
- 2022-10-30 Contingent — Smart MLS
- 2022-10-21 Listed $169,900 Smart MLS
- 2013-08-14 Listing Removed — Smart MLS
- 2013-04-14 Listed $150,000 Smart MLS
- 2007-11-26 Sold (Public Records) $145,000 Public Records
- 2007-11-21 Sold (MLS) $145,000 Smart MLS
- 2007-08-18 Listed $139,900 Smart MLS
Property tax history
+1.9%/yrLatest (2025): $3,690 · +6.0% YoY. Source: county tax records.
Cash-flow waterfall
monthlySold comps — $/sqft
last 12 mo · ≤1 miLoading sold comps…