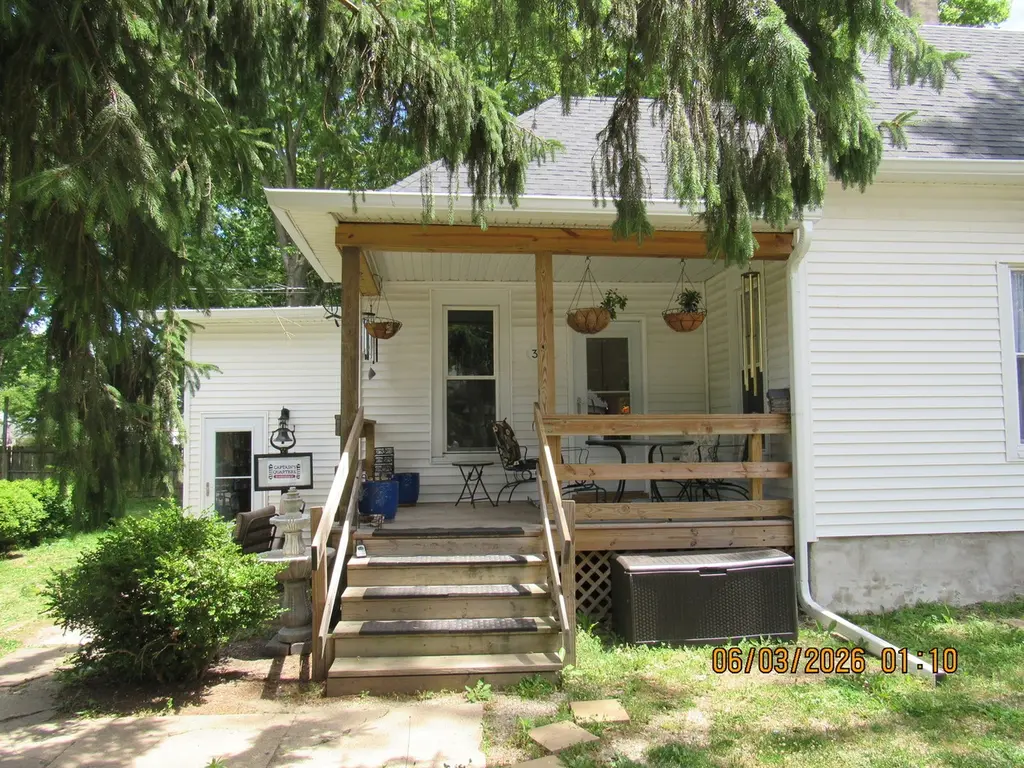
324 W Sumner St · Streator, IL
Flood risk 1/10 · Minimal
- FEMA flood zone
- X (unshaded)
- Chance of flooding over 30 yrs
- 0.0%
- Est. flood insurance / yr
- $473 – $860
Fire risk 1/10 · Minimal
- Est. fire insurance / yr
- $804 – $1,492
Heat risk 3/10 · Minor
- Hot days now (above 104°F)
- 7 days/yr
- Hot days in 30 yrs
- 17 days/yr
Wind risk 2/10 · Minimal
- Chance of severe wind over 30 yrs
- 1.0%
Air-quality risk 2/10 · Minimal
- Unhealthy air days now
- 1 days/yr
- Unhealthy air days in 30 yrs
- 1 days/yr
Risk factors via First Street. Map © Google.
Why this score? — see what drove the C grade
The composite is a weighted blend of 9 inputs, each scored 0–100. Each bar is that input's sub-score; the figure is the points it added to the 100-point composite (weight × sub-score).
- Cash flow +27.3/30.0
- DSCR +9.5/10.0
- 1% rule +7.6/10.0
- Livability +3.2/5.0
- ARV discount +3.1/15.0
- Rent growth +2.5/5.0
- Condition / age +2.5/5.0
- Schools +1.3/10.0
- Appreciation +0.0/10.0
$119,900
🖨 Deal sheet (PDF) 📄 Offer letter ✓ Due diligence
Listing remarks MLS
Remodeled in 2024 & 2025! 2 Bedroom 1 story home on a deep corner lot. The large picture window allows for ample light and the living room complete with a built in fire place. A bonus room that would be perfect as a den, office, craft space or even a 3rd bedroom if preferred. The separate dining room is great for entertaining. Plenty of storage room with a pantry area and full basement. Repairs included but not limited to new front deck, new furnace, new ac unit, roof repairs, all new siding, all new kitchen with granite countertops, completely new bathroom, new windows, new flooring throughout, freshly painted, new light fixtures throughout.
Key facts
- Plenty of storage
- Separate dining room
- Large picture window
Tags
Property features AI
Finance
- Other: Property is not currently leased; Possession at closing
- Financial info: Special service area: No
- HOA & community: No master association fee required
Exterior
- Parking: One parking space (off-street, gravel)
- Utilities: Public water; Public sewer
- Home design: Detached single-family home; One-story; Fee simple ownership; Rehab completed in 2025; Built approximately 61–70 years ago; Vinyl siding with brick accents
- Construction: Vinyl siding and brick construction; Property was rehabbed in 2025; Built before 1978
- Exterior features: Corner lot (dimensions 80 x 140); Lot approximately 0.25–0.49 acre; Off-street parking on gravel; Owned driveway/parking
Interior
- Kitchen: Granite counters; Kitchen on the main level
- Bedrooms: Two bedrooms (both on the main level); Additional bedroom labels referenced (Bedroom 3, Bedroom 4) but no details provided
- Flooring: Luxury vinyl in living room, kitchen, and dining room; Laminate flooring listed generally; Carpet in den and one bedroom
- Bathrooms: One full bathroom (on the first floor)
- Heating & cooling: Natural gas heating; Central air conditioning; One fireplace located in the living room
- Interior features: First-floor bedroom and first-floor full bathroom; Built-in features; Historic/period millwork; Open floor plan; Granite counters; Storm door(s); Drapes; Six total rooms
- Laundry & utility: Laundry room included
Neighborhood map
What this means for you Summary
Snapshot
- This is a 2-bed/1.0-bath single-family listed at $120k.
Deal economics
- At list price, monthly cash flow is $348 ($4k/yr) — positive.
- The deal already cash-flows at list — no discount required.
- Meets the 1% rule at list price ($2k rent vs $120k).
- Recommended offer: $118k (1.5% below list) — sets the bar for market timing.
- Cap rate 9.8% vs local median 7.8% in Streator — meaningfully above typical; check what's discounted (condition, days-on-market, listing class) to confirm the premium yield is real.
Location & tenants
- Location reads 63/100 on livability (#752 in IL) — a middle-class / working-renter tenant base. Strengths: cost of living A+, health & safety A+, housing B+; Watch: amenities F, commute F, employment F.
- Streator Twp Hsd 40 (town): math 11% / reading 19% proficiency, ranked #513 of 620 in IL (top 83%) — low school quality limits family demand, transient renter base, plan for 1-2y turnover.
- Zoned schools: Centennial Elem School (math 13% / reading 20%, grade F, #1,224 of 2,056 statewide, top 60%, 470 students, 0% FRL); Northlawn Jr High School (math 7% / reading 14%, grade F, #580 of 665 statewide, top 88%, 617 students, 0% FRL); Streator Twp High School (math 11% / reading 19%, grade F, #462 of 693 statewide, top 68%, 809 students, 0% FRL).
- Market conditions: 85 active listings in the ZIP; 4 comparable units currently listed for rent nearby; rentals at typical pace (median 24d on market — plan ~3-4 weeks tenant-placement turnaround); 82 units permitted in LaSalle County in 2024 (0 in 5+ unit buildings).
- This rent runs 31% of the median local income ($59k/yr) — at the standard rent-burdened threshold; future hikes will face affordability resistance.
Forward outlook
- Local home prices are declining (-3.0%/yr); year-one equity from $829 of loan paydown is wiped out by about $4k of value loss. Plan a longer hold.
- LaSalle County population projected at -16% by 2050 — secular population decline; favor cash flow + early exit over multi-decade hold.
- At projected returns (-3.0% appreciation + 3.0% rent growth), your $34k cash investment doubles in ~10 years — after that, you're playing with house money.
Negotiation context
- It's been on market 17 days — a 2% lower offer ($118k) is reasonable based on typical stale-listing flexibility.
- 3 sale attempts with the ask held roughly flat each time — persistent listings suggest the price (not the market) is what's stuck; bring a comps-based counter.
- Current owner paid $97k; 24% above their basis — modest negotiation headroom, anchor on the comps not their cost.
Questions for the listing agent
- Built in 1964 — when were the roof, HVAC, electrical panel, plumbing, and water heater last replaced?
- Is there a deadline driving the sale (1031 exchange, divorce, estate, relocation)? That informs how much negotiation room exists.
- Schools are F-rated, which usually means shorter tenancies and higher turnover. Who's the typical renter profile here, and what's been the actual vacancy rate?
- What's the average days-on-market for RENTAL listings here right now (not sales)? A rising rental-DOM trend means longer vacancies and softer asking-rent achievability than the comps imply.
- What's the recent tenant-quality profile in this submarket — average credit score on applications, eviction rate, late-payment / NSF rate, and stable-employment percentage? A property-management company in the area should have these aggregated.
- How much new for-sale + rental construction is in the pipeline within 1–3 miles? Heavy new supply typically softens prices + rents 12–24 months out; constrained supply supports both.
Investment metrics
- 1% rule
- 1.26% ✓
- Cap rate
- 9.77%
- Cash-on-cash
- 12.43%
- DSCR
- 1.55
- GRM
- 6.6
CMA / ARV
- ARV (on-the-fly)
- $109,250
- Comps found
- 12
Show comp detail 12 sales within ~0.75 mi
| Address | Dist | Beds/Ba | Sqft | Sold | Price | $/sf | Match |
|---|---|---|---|---|---|---|---|
| 324 W Sumner St | 0.00mi | 2/1.0 | 1,150 (0%) | 4mo | $97,001 | $84 | 97 |
| 424 W Bluff St | 0.20mi | 2/1.0 | 1,100 (-4%) | 1mo | $145,000 | $132 | 83 |
| 304 W Morrell St | 0.29mi | 2/1.0 | 1,125 (-2%) | 1mo | $135,000 | $120 | 82 |
| 112 W Grant St | 0.23mi | 2/1.0 | 1,108 (-4%) | 3mo | $65,000 | $59 | 81 |
| 807 N Park St | 0.38mi | 2/1.0 | 1,160 (+1%) | 6mo | $104,000 | $90 | 76 |
| 509 W Grant St | 0.26mi | 2/1.5 | 1,268 (+10%) | 1mo | $133,000 | $105 | 68 |
| 1012 N Bloomington St | 0.22mi | 3/1.0 (+1) | 1,050 (-9%) | 2mo | $100,000 | $95 | 68 |
| 307 E Bronson St | 0.41mi | 2/1.0 | 1,236 (+8%) | 4mo | $5,000 | $4 | 65 |
| 910 N Bloomington St | 0.24mi | 3/1.5 (+1) | 1,020 (-11%) | 3mo | $144,001 | $141 | 60 |
| 509 E Bronson St | 0.54mi | 2/2.0 | 1,082 (-6%) | 4mo | $47,500 | $44 | 58 |
| 904 N Vermillion St | 0.45mi | 3/1.5 (+1) | 1,240 (+8%) | 6mo | $155,000 | $125 | 54 |
| 611 N Sterling St | 0.63mi | 3/1.0 (+1) | 987 (-14%) | 6mo | $40,000 | $41 | 37 |
Match score weights: distance 35% · size 25% · config 20% · recency 20%. Top-matched comps best support the ARV.
Projected returns pro-forma
-3.0% appreciation · 3.0% rent growth · sell at horizon
- IRR
- 2.1%
- Equity multiple
- 1.08×
- Total profit
- $2,760
- Equity at exit
- $17,877
- IRR
- 11.8%
- Equity multiple
- 1.93×
- Total profit
- $31,070
- Equity at exit
- $10,367
Cash invested: $33,572 (down + closing). Projections, not guarantees.
Landlord ↔ Tenant lean methodology
- Overall (STATE)
- 43 Moderately Tenant-Leaning
- State Illinois
- 43 Moderately Tenant-Leaning · D+7
- County
- — inherits STATE
- City
- — inherits STATE
ZIP-level market 61364
- Home prices YoY
- -31.1%
- Active inventory
- 85
- Price-to-rent
- 6.6×
Monthly cashflow live
- Estimated rent
- $1,512 medium interval (Pro) →
- Mortgage (P&I)
- −$629
- Tax from tax record
- −$168 /mo · $2,017/yr
- Insurance
- −$50
- HOA
- −$0
- Vacancy / Maint / Mgmt
- −$318
- Net cashflow
- $348
Break-even live
Sensitivity live
| Price | -10% $416 | -5% $382 | +0% $348 | +5% $314 | +10% $280 |
|---|---|---|---|---|---|
| Rent | -10% $228 | -5% $288 | +0% $348 | +5% $408 | +10% $467 |
| Rate | -1.0pp $408 | -0.5pp $378 | base $348 | +0.5pp $317 | +1.0pp $285 |
UW: 25.0% down · 7.5% · 30yr · 1.5% tax · 5.0% vac · 8.0% maint · 8.0% mgmt
Financing live
Cash to close
- Down payment
- $29,975
- Closing costs
- $3,597
- Reserves months
- —
- Total cash needed
- —
Loan-product check · same deal, 3 products live
Conventional
25% down · 7.5% · 30yr
- Down + closing
- —
- Monthly P&I
- —
- Monthly cashflow
- —
- DSCR
- —
- Eligible?
- —
Personal DTI + credit; lowest rate.
DSCR
20% down · 8.5% · 30yr
- Down + closing
- —
- Monthly P&I
- —
- Monthly cashflow
- —
- DSCR
- —
- Eligible?
- —
No personal income docs; deal must DSCR.
Hard money
10% down · 12.0% · 12mo
- Down + closing
- —
- Monthly P&I
- —
- Monthly cashflow
- —
- DSCR
- —
- Eligible?
- —
Short-term bridge; refi at stabilization.
Rent comps 4 comps
| Address | Beds | Baths | Sqft | Rent | $/sqft | DOM | Units | Dist |
|---|---|---|---|---|---|---|---|---|
| 1409 Kelly St Streator, IL | 3.0 | 1.0 | 1280 | $1,750 | $1.37 | 9d | 1 | 0.37mi |
| 503 S Bloomington St Streator, IL | 3.0 | 1.0 | 1200 | $1,500 | $1.25 | 26d | 1 | 1.13mi |
| 514 Lundy St Streator, IL | 3.0 | 1.0 | 1174 | $1,700 | $1.45 | 5d | 1 | 1.21mi |
| 402 S Illinois St Streator, IL | 2.0 | 1.0 | 1116 | $1,550 | $1.39 | 23d | 1 | 1.27mi |
Listing history 13 events
-
2026-06-21statusdays on market $119,900 Contingent - Continue to Show 17 DOM
-
2026-06-19days on market $119,900 Active 15 DOM
-
2026-06-18days on market $119,900 Active 14 DOM
-
2026-06-17days on market $119,900 Active 13 DOM
-
2026-06-16days on market $119,900 Active 12 DOM
-
2026-06-15days on market $119,900 Active 11 DOM
-
2026-06-14days on market $119,900 Active 9 DOM
-
2026-06-12days on market $119,900 Active 8 DOM
-
2026-06-09days on market $119,900 Active 5 DOM
-
2026-06-08days on market $119,900 Active 4 DOM
-
2026-06-07days on market $119,900 Active 3 DOM
-
2026-06-05remarks 699-char remark
-
2026-06-05$119,900 Active 1 DOM
ⓘ Source: listings_history table (triggers on properties + properties_extension) + one-shot
backfill from property_details.listing_events for pre-trigger history.
Tax reassessment forecast IL · Partial reset (capped growth)
- Current annual tax
- $2,017 · $168/mo
- Projected year-2 tax
- $2,370 · $197/mo
- Expected delta
- +$352/yr (+$29/mo · 17.5%)
ⓘ Screening estimate from a state-policy table — verify with the county assessor before closing.
Climate risk First Street
- Flood 1/10 Low FEMA zone X (unshaded) · 0% chance over 30 yrs
- Wildfire 1/10 Low
- Heat 3/10 Moderate 7 d/yr ≥104°F today · 17 d/yr by 30 yrs out
- Wind 2/10 Low 100% chance of damaging wind over 30 yrs
- Air quality 2/10 Low 1 unhealthy d/yr today · 1 by 30 yrs out
Nearby sold comps map
Loading sold comps map…
Walkable amenities ~0.75 mi
Loading nearby amenities…
Taxation est. · year 1
- Rental income
- $18,147
- − Mortgage interest
- −$6,716
- − Property taxes
- −$2,017
- − Insurance
- −$600
- − Repairs & maintenance
- −$1,452
- − Management
- −$1,452
- − Depreciation
- −$3,488
- Taxable income
- $2,423
- Est. tax owed @ 24.0%
- −$581
- After-tax cash flow
- $3,593/yr
For passive investors: Depreciation is non-cash, so a rental often shows a tax loss while cash-flowing — sheltering income. Rental losses are passive: they offset passive income freely, and up to $25,000/yr can offset ordinary (W-2) income if you actively participate and your MAGI is under $100k (phasing out to $0 by $150k); unused losses carry forward. On sale, claimed depreciation is recaptured at up to 25%, and gains may owe capital-gains tax (a 1031 exchange can defer both). Figures are a year-1 estimate at your 24.0% rate — not tax advice; consult a CPA.
Schools (NCES district)
- District
- Streator Twp Hsd 40
- NCES district ID
- 1738100
- Math proficiency
- 11% ▼ -4.00%
- Reading proficiency
- 19% ▼ -1.00%
- Median HH income
- $43,002
- Composite
- 13.07/100
- National rank
- #9561
- State rank
- #513 of 620 in IL
Livability — Streator
- Score
- 63/100
- State rank
- #752
- US rank
- #15266
Category grades
Schools grade is shown separately in the Schools card above.
Census & demographics
- Census place
- Streator, IL
- County
- La Salle County · 41,676 people
- City population
- 17,963
- Metro
- Ottawa, IL
- Population (ZIP)
- 17,963
- Household income
- $59,060
- Rent vs Own
- Severe rent burden
- 450.0
Population outlook (LaSalle County) Hauer SSP2
- Today (2025)
- 107,080 people
- By 2030
- 104,196 · -2.7%
- By 2040
- 97,413 · -9.0%
- By 2050
- 90,294 · -15.7%
- By 2075
- 76,252 · -28.8%
- By 2100
- 61,339 · -42.7%
Race, ethnicity, and origin ACS 2023
- Neighborhood character
- Predominantly White (83%)
- Race & ethnicity
- White 83% Hispanic / Latino 11% Two or more races 4% Black 3%
- Hispanic origin (detail)
- Mexican 10%
- Common ancestry
- Romanian 3% Lithuanian 2% Slovak 2%
- Foreign-born
- 3% · Canada
- Languages at home
- 93% English-only · Spanish 6%
Political lean MEDSL · LaSalle
- 2024 margin
- R (+18.5) · D 40.1% · R 58.6% · Other 1.3%
- 2008→2024 swing
- -29.6pp toward R · 2008: 11.1pp · 2024: -18.5pp
- All cycles
- 2024: R+18.5 2020: R+14.3 2016: R+14.4 2012: R+0.4 2008: D+11.1
Not yet ingested
- Civics
- —
Market trends
- HPI YoY
- ▼ -105.28%
- Current HPI
- 233.5533
- Rent YoY
- —
- Metro
- Ottawa, IL
- State GDP YoY
- ▲ 1.59%
- F500 in state
- 60
Industry mix (Fortune 500 HQ in IL)
| Industry | F500 HQs | Revenue |
|---|---|---|
| Insurance | 4 | $201B |
|
||
| Consumer Goods | 4 | $87B |
|
||
| Industrial Machinery | 3 | $64B |
|
||
| Healthcare | 2 | $55B |
|
||
| Retail / Pharmacy | 1 | $148B |
|
||
| Agriculture / Food | 1 | $86B |
|
||
Price history
-17.3% since first listed14 events — show timeline
- 2026-06-04 Listed $119,900 MRED as Distributed by MLS Grid
- 2026-02-26 Sold (MLS) $97,001 MRED as Distributed by MLS Grid
- 2026-01-23 Contingent — MRED as Distributed by MLS Grid
- 2026-01-14 Price Changed $99,000 MRED as Distributed by MLS Grid
- 2025-12-31 Price Changed $105,000 MRED as Distributed by MLS Grid
- 2025-12-02 Price Changed $110,000 MRED as Distributed by MLS Grid
- 2025-10-31 Price Changed $115,000 MRED as Distributed by MLS Grid
- 2025-09-30 Price Changed $120,000 MRED as Distributed by MLS Grid
- 2025-09-10 Relisted — MRED as Distributed by MLS Grid
- 2025-09-03 Contingent — MRED as Distributed by MLS Grid
- 2025-08-27 Price Changed $125,000 MRED as Distributed by MLS Grid
- 2025-07-30 Price Changed $129,900 MRED as Distributed by MLS Grid
- 2025-06-24 Price Changed $137,000 MRED as Distributed by MLS Grid
- 2025-05-30 Listed $145,000 MRED as Distributed by MLS Grid
Property tax history
+9.4%/yrLatest (2024): $2,017 · +8.1% YoY. Source: county tax records.
Cash-flow waterfall
monthlySold comps — $/sqft
last 12 mo · ≤1 miLoading sold comps…