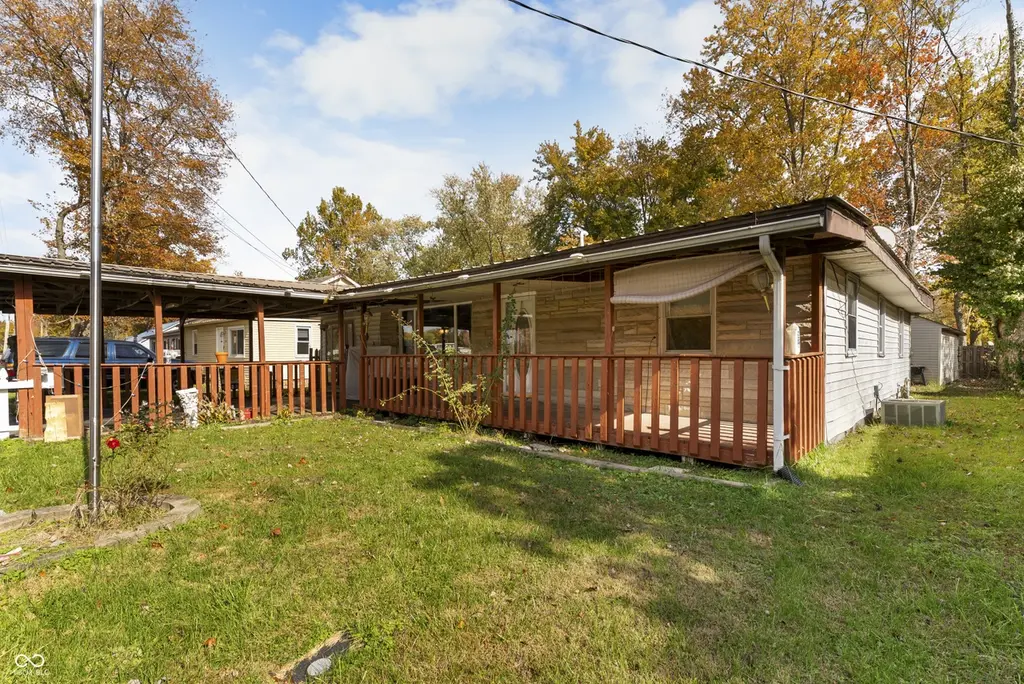
149 S 7th St · Austin, IN
Flood risk 1/10 · Minimal
- FEMA flood zone
- X (unshaded)
- Chance of flooding over 30 yrs
- 0.0%
- Est. flood insurance / yr
- $507 – $1,088
Fire risk 1/10 · Minimal
- Est. fire insurance / yr
- $717 – $1,331
Heat risk 4/10 · Minor
- Hot days now (above 105°F)
- 7 days/yr
- Hot days in 30 yrs
- 19 days/yr
Wind risk 2/10 · Minimal
- Chance of severe wind over 30 yrs
- 1.0%
Air-quality risk 2/10 · Minimal
- Unhealthy air days now
- 0 days/yr
- Unhealthy air days in 30 yrs
- 1 days/yr
Risk factors via First Street. Map © Google.
Why this score? — see what drove the C grade
The composite is a weighted blend of 9 inputs, each scored 0–100. Each bar is that input's sub-score; the figure is the points it added to the 100-point composite (weight × sub-score).
- Cash flow +25.2/30.0
- DSCR +8.3/10.0
- ARV discount +7.5/15.0
- 1% rule +6.6/10.0
- Livability +3.0/5.0
- Rent growth +2.5/5.0
- Condition / age +2.5/5.0
- Schools +1.7/10.0
- Appreciation +0.0/10.0
$80,000
🖨 Deal sheet (PDF) 📄 Offer letter ✓ Due diligence
Listing remarks
Investment Special!!! Welcome to 149 S 7th Street in Austin, Indiana. This home does need some repairs, but features fresh paint and new ceiling fans. The property includes three bedrooms, one and a half bathrooms, and a carport. The sellers are motivated, so don't hesitate to check this property out!
Key facts
- 7,405 sq ft lot
- Built 1962
- Listed 167 days
Property features AI
Finance
- Other: Property listed as a fixer
Exterior
- Parking: Carport
- Utilities: Public water; Municipal sewer; Electricity connected; Sewer connected; Water connected; Solid waste service available
- Home design: Single-family residence; One story; East-facing entry
- Construction: Vinyl siding with stone accents; Crawl space foundation
- Exterior features: Not in a subdivision
Interior
- Kitchen: Refrigerator
- Bedrooms: 3 bedrooms (all on the main level)
- Bathrooms: 1 full bath; 1 half bath
- Heating & cooling: Electric heating; Central air conditioning
- Interior features: Attic access
- Laundry & utility: Main-level laundry room
Neighborhood map
What this means for you Summary
Snapshot
- This is a 3-bed/1.5-bath single-family listed at $80k.
Deal economics
- At list price, monthly cash flow is $178 ($2k/yr) — positive.
- The deal already cash-flows at list — no discount required.
- Meets the 1% rule at list price ($926 rent vs $80k).
- Recommended offer: $70k (12.0% below list) — sets the bar for market timing.
- Cap rate 9.0% vs local median 4.2% in Austin — top-decile yield for the area; either an underpriced asset or a hidden risk that comps aren't pricing in. Stress-test before assuming the spread holds.
Location & tenants
- Location reads 60/100 on livability (#523 in IN) — a middle-class / working-renter tenant base. Strengths: crime A+, cost of living A+; Watch: health & safety D, amenities F, commute F.
- Scott County School District 1 (town): math 16% / reading 26% proficiency, ranked #274 of 301 in IN (top 91%) — low school quality limits family demand, transient renter base, plan for 1-2y turnover; 63% free/reduced lunch — lower-income household profile, screen leases tightly.
- Zoned schools: Austin Elementary School (math 23% / reading 20%, grade F, #803 of 994 statewide, top 81%, 612 students, 64% FRL); Austin Middle School (math 10% / reading 26%, grade F, #279 of 330 statewide, top 86%, 275 students, 56% FRL); Austin High School (math 12% / reading 47%, grade F, #308 of 369 statewide, top 84%, 432 students, 52% FRL).
- Market conditions: 56 active listings in the ZIP; 2 comparable units currently listed for rent nearby; 73 units permitted in Scott County in 2024 (0 in 5+ unit buildings).
Forward outlook
- Local home prices are declining (-3.0%/yr); year-one equity from $553 of loan paydown is wiped out by about $2k of value loss. Plan a longer hold.
- Scott County population projected at -23% by 2050 — secular population decline; favor cash flow + early exit over multi-decade hold.
Negotiation context
- It's been on market 167 days — a 12% lower offer ($70k) is reasonable based on typical stale-listing flexibility.
- 3 sale attempts; this cycle's ask has dropped $50k (38%) from the opening price — seller is motivated, your offer sets the floor, not the list.
Questions for the listing agent
- It's been on market 167 days. Have you received any prior offers? Is the seller open to a 12% concession, seller financing, or rate buy-down credit?
- Built in 1962 — when were the roof, HVAC, electrical panel, plumbing, and water heater last replaced?
- Why hasn't it sold? Are there any deal-killer items the seller is aware of (foundation, flood, title, zoning, code violations)?
- Is there a deadline driving the sale (1031 exchange, divorce, estate, relocation)? That informs how much negotiation room exists.
- Schools are F-rated, which usually means shorter tenancies and higher turnover. Who's the typical renter profile here, and what's been the actual vacancy rate?
- What's the average days-on-market for RENTAL listings here right now (not sales)? A rising rental-DOM trend means longer vacancies and softer asking-rent achievability than the comps imply.
- What's the recent tenant-quality profile in this submarket — average credit score on applications, eviction rate, late-payment / NSF rate, and stable-employment percentage? A property-management company in the area should have these aggregated.
- How much new for-sale + rental construction is in the pipeline within 1–3 miles? Heavy new supply typically softens prices + rents 12–24 months out; constrained supply supports both.
Investment metrics
- 1% rule
- 1.16% ✓
- Cap rate
- 8.97%
- Cash-on-cash
- 9.55%
- DSCR
- 1.43
- GRM
- 7.2
CMA / ARV
- ARV (on-the-fly)
- $187,128
- Comps found
- 10
Show comp detail 10 sales within ~0.75 mi
| Address | Dist | Beds/Ba | Sqft | Sold | Price | $/sf | Match |
|---|---|---|---|---|---|---|---|
| 304 S Lawnview Dr | 0.47mi | 3/1.0 | 1,638 (-1%) | 13mo | $179,900 | $110 | 64 |
| 377 S Second St | 0.36mi | 3/2.0 | 1,475 (-11%) | 2mo | $160,000 | $108 | 61 |
| 180 S 3rd St | 0.18mi | 3/1.0 | 1,539 (-7%) | 20mo | $177,250 | $115 | 61 |
| 188 W Cross St | 0.30mi | 4/2.0 (+1) | 1,680 (+1%) | 19mo | $189,900 | $113 | 60 |
| 136 S 5th St | 0.09mi | 2/1.5 (-1) | 1,521 (-8%) | 23mo | $160,000 | $105 | 58 |
| 333 S 1st St | 0.40mi | 2/1.0 (-1) | 1,848 (+12%) | 0mo | $155,000 | $84 | 55 |
| 255 Church St | 0.65mi | 3/2.0 | 1,483 (-10%) | 5mo | $167,000 | $113 | 46 |
| 321 Short St | 0.30mi | 4/2.0 (+1) | 1,440 (-13%) | 18mo | $180,000 | $125 | 43 |
| 232 E Main St | 0.75mi | 3/2.0 | 1,431 (-14%) | 4mo | $209,900 | $147 | 37 |
| 1102 W York Rd | 0.49mi | 3/2.0 | 1,416 (-14%) | 24mo | $70,000 | $49 | 31 |
Match score weights: distance 35% · size 25% · config 20% · recency 20%. Top-matched comps best support the ARV.
Projected returns pro-forma
-3.0% appreciation · 3.0% rent growth · sell at horizon
- IRR
- -1.9%
- Equity multiple
- 0.93×
- Total profit
- $-1,591
- Equity at exit
- $11,928
- IRR
- 7.8%
- Equity multiple
- 1.59×
- Total profit
- $13,297
- Equity at exit
- $6,917
Cash invested: $22,400 (down + closing). Projections, not guarantees.
Landlord ↔ Tenant lean methodology
- Overall (STATE)
- 90 Strongly Landlord-Friendly
- State Indiana
- 90 Strongly Landlord-Friendly · R+11
- County
- — inherits STATE
- City
- — inherits STATE
ZIP-level market 47102
- Home prices YoY
- -8.9%
- Active inventory
- 56
- Price-to-rent
- 7.2×
Monthly cashflow live
- Estimated rent
- $926 medium interval (Pro) →
- Mortgage (P&I)
- −$420
- Tax est. 1.5%
- −$100 /mo · $1,200/yr
- Insurance
- −$33
- HOA
- −$0
- Vacancy / Maint / Mgmt
- −$194
- Net cashflow
- $178
Break-even live
Sensitivity live
| Price | -10% $234 | -5% $206 | +0% $178 | +5% $151 | +10% $123 |
|---|---|---|---|---|---|
| Rent | -10% $105 | -5% $142 | +0% $178 | +5% $215 | +10% $251 |
| Rate | -1.0pp $219 | -0.5pp $199 | base $178 | +0.5pp $158 | +1.0pp $137 |
UW: 25.0% down · 7.5% · 30yr · 1.5% tax · 5.0% vac · 8.0% maint · 8.0% mgmt
Financing live
Cash to close
- Down payment
- $20,000
- Closing costs
- $2,400
- Reserves months
- —
- Total cash needed
- —
Loan-product check · same deal, 3 products live
Conventional
25% down · 7.5% · 30yr
- Down + closing
- —
- Monthly P&I
- —
- Monthly cashflow
- —
- DSCR
- —
- Eligible?
- —
Personal DTI + credit; lowest rate.
DSCR
20% down · 8.5% · 30yr
- Down + closing
- —
- Monthly P&I
- —
- Monthly cashflow
- —
- DSCR
- —
- Eligible?
- —
No personal income docs; deal must DSCR.
Hard money
10% down · 12.0% · 12mo
- Down + closing
- —
- Monthly P&I
- —
- Monthly cashflow
- —
- DSCR
- —
- Eligible?
- —
Short-term bridge; refi at stabilization.
Rent comps 2 comps
| Address | Beds | Baths | Sqft | Rent | $/sqft | DOM | Units | Dist |
|---|---|---|---|---|---|---|---|---|
| 527 W Cherry St Austin, IN | 2.0 | 1.0 | 1080 | $925 | $0.86 | 45d | 1 | 0.12mi |
| 20 Red Oak Way Austin, IN | 2.0 | 2.0 | 1080 | $929 | $0.86 | 45d | 1 | 0.72mi |
Listing history 9 events
-
2026-05-22status Active
-
2026-04-22status Pending
-
2026-03-09status Active
-
2026-03-09price $80,000
-
2026-03-04status Pending
-
2026-01-28price $99,000
-
2025-12-18price $110,000
-
2025-12-09price $120,000
-
2025-11-01$130,000 Active
ⓘ Source: listings_history table (triggers on properties + properties_extension) + one-shot
backfill from property_details.listing_events for pre-trigger history.
Climate risk First Street
- Flood 1/10 Low FEMA zone X (unshaded) · 0% chance over 30 yrs
- Wildfire 1/10 Low
- Heat 4/10 Moderate 7 d/yr ≥105°F today · 19 d/yr by 30 yrs out
- Wind 2/10 Low 100% chance of damaging wind over 30 yrs
- Air quality 2/10 Low 0 unhealthy d/yr today · 1 by 30 yrs out
Nearby sold comps map
Loading sold comps map…
Walkable amenities ~0.75 mi
Loading nearby amenities…
Taxation est. · year 1
- Rental income
- $11,107
- − Mortgage interest
- −$4,481
- − Property taxes
- −$1,200
- − Insurance
- −$400
- − Repairs & maintenance
- −$889
- − Management
- −$889
- − Depreciation
- −$2,327
- Taxable income
- $921
- Est. tax owed @ 24.0%
- −$221
- After-tax cash flow
- $1,919/yr
For passive investors: Depreciation is non-cash, so a rental often shows a tax loss while cash-flowing — sheltering income. Rental losses are passive: they offset passive income freely, and up to $25,000/yr can offset ordinary (W-2) income if you actively participate and your MAGI is under $100k (phasing out to $0 by $150k); unused losses carry forward. On sale, claimed depreciation is recaptured at up to 25%, and gains may owe capital-gains tax (a 1031 exchange can defer both). Figures are a year-1 estimate at your 24.0% rate — not tax advice; consult a CPA.
Schools (NCES district)
- District
- Scott County School District 1
- NCES district ID
- 1809990
- Math proficiency
- 16% ▼ -21.00%
- Reading proficiency
- 26% ▼ -10.00%
- Median HH income
- $36,972
- Composite
- 17.46/100
- National rank
- #9062
- State rank
- #274 of 301 in IN
Livability — Austin
- Score
- 60/100
- State rank
- #523
- US rank
- #18774
Category grades
Schools grade is shown separately in the Schools card above.
Census & demographics
- Census place
- Austin, IN
- City population
- 6,647
- Population (ZIP)
- 6,647
Population outlook (Scott County) Hauer SSP2
- Today (2025)
- 22,525 people
- By 2030
- 21,609 · -4.1%
- By 2040
- 19,536 · -13.3%
- By 2050
- 17,370 · -22.9%
- By 2075
- 12,862 · -42.9%
- By 2100
- 9,340 · -58.5%
Race, ethnicity, and origin ACS 2023
- Neighborhood character
- Predominantly White (96%)
- Race & ethnicity
- White 96% Hispanic / Latino 2% Two or more races 2%
- Common ancestry
- Slovak 2% Lithuanian 2% Italian 1%
- Foreign-born
- 1% · Canada
Political lean MEDSL · Scott
- 2024 margin
- Solid R (+51.5) · D 23.4% · R 74.9% · Other 1.6%
- 2008→2024 swing
- -49.5pp toward R · 2008: -2.0pp · 2024: -51.5pp
- All cycles
- 2024: R+51.5 2020: R+45.6 2016: R+37.9 2012: R+6.2 2008: R+2.0
Not yet ingested
- Civics
- —
Market trends
- HPI YoY
- ▼ -25.77%
- Current HPI
- 263.604
- Rent YoY
- —
- Metro
- —
- State GDP YoY
- ▲ 2.90%
- F500 in state
- 18
Industry mix (Fortune 500 HQ in IN)
| Industry | F500 HQs | Revenue |
|---|---|---|
| Industrial Machinery | 2 | $37B |
|
||
| Healthcare | 1 | $177B |
|
||
| Pharmaceuticals | 1 | $45B |
|
||
| Metals / Steel | 1 | $18B |
|
||
| Agriculture | 1 | $17B |
|
||
| Packaging | 1 | $12B |
|
||
Price history
-38.5% since first listed9 events — show timeline
- 2026-05-22 Relisted — MIBOR as Distributed by MLS Grid
- 2026-04-22 Pending — MIBOR as Distributed by MLS Grid
- 2026-03-09 Relisted — MIBOR as Distributed by MLS Grid
- 2026-03-09 Price Changed $80,000 MIBOR as Distributed by MLS Grid
- 2026-03-04 Pending — MIBOR as Distributed by MLS Grid
- 2026-01-28 Price Changed $99,000 MIBOR as Distributed by MLS Grid
- 2025-12-18 Price Changed $110,000 MIBOR as Distributed by MLS Grid
- 2025-12-09 Price Changed $120,000 MIBOR as Distributed by MLS Grid
- 2025-11-01 Listed $130,000 MIBOR as Distributed by MLS Grid
Property tax history
-8.1%/yrLatest (2019): $57 · -33.8% YoY. Source: county tax records.
Cash-flow waterfall
monthlySold comps — $/sqft
last 12 mo · ≤1 miLoading sold comps…