16005 N 32nd St #66 · Phoenix, AZ
Flood risk 1/10 · Minimal
- FEMA flood zone
- X (shaded)
- Chance of flooding over 30 yrs
- 0.0%
- Est. flood insurance / yr
- $507 – $1,088
Fire risk 1/10 · Minimal
- Est. fire insurance / yr
- $610 – $1,132
Heat risk 8/10 · Major
- Hot days now (above 111°F)
- 6 days/yr
- Hot days in 30 yrs
- 16 days/yr
Wind risk 1/10 · Minimal
- Chance of severe wind over 30 yrs
- —
Air-quality risk 3/10 · Minor
- Unhealthy air days now
- 2 days/yr
- Unhealthy air days in 30 yrs
- 3 days/yr
Risk factors via First Street. Map © Google.
Why this score? — see what drove the C- grade
The composite is a weighted blend of 9 inputs, each scored 0–100. Each bar is that input's sub-score; the figure is the points it added to the 100-point composite (weight × sub-score).
- Cash flow +15.0/30.0
- ARV discount +14.9/15.0
- 1% rule +5.0/10.0
- DSCR +5.0/10.0
- Schools +3.8/10.0
- Livability +3.8/5.0
- Condition / age +2.5/5.0
- Rent growth +2.1/5.0
- Appreciation +0.0/10.0
$22,000
🖨 Deal sheet 📄 Offer letter ✓ Due diligence
Listing remarks
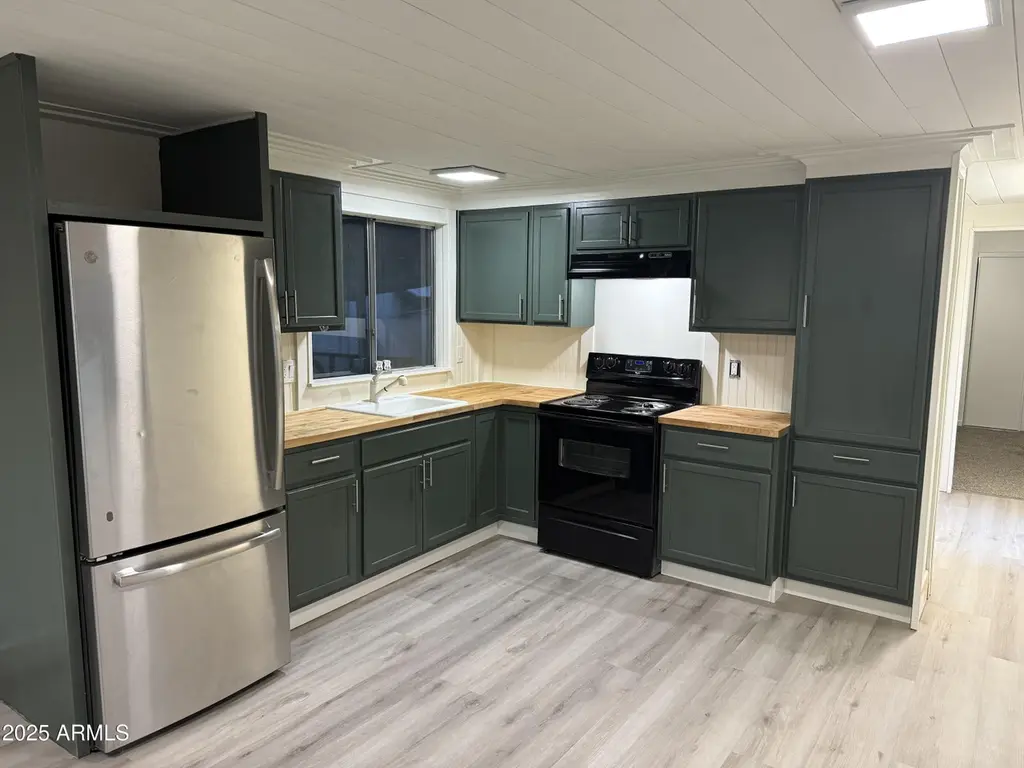
2000 down and we will carry the balance. Beautifully remodeled 1980 manufactured home in a quiet 55+ community on a leased lot. This move-in-ready home features a fully updated kitchen with new cabinets, butcher-block counters, fresh paint, and beadboard accents. New luxury vinyl flooring in the kitchen, utility room, and bath, plus new carpet in the living area and bedroom. Spacious layout with large windows, updated lighting, and clean, modern finishes. New HVAC system and tankless water heater provide efficiency and comfort. A great opportunity for low-maintenance living in a welcoming community. All electric!
Key facts
- New carpet
- Updated kitchen
- Updated lighting
Tags
Property features AI
Finance
- Other: Coin-op laundry (community amenity)
- Financial info: No association fees
- HOA & community: Land lease community with monthly land lease payment; Land lease: $1,100 per month; Community pool
Exterior
- Parking: 1 covered parking space; 1 open parking space; 1 carport space
- Utilities: Private well water; Sewer connected (private sewer)
- Home design: Manufactured/mobile home; Leasehold ownership
- Construction: Metal siding and wood frame construction; Metal roof
- Exterior features: Shed(s); Gravel/stone front and back; Private maintained road; Asphalt road surface
Interior
- Kitchen: Eat-in kitchen
- Bedrooms: 1 bedroom (possible)
- Flooring: Carpet; Vinyl
- Bathrooms: 1 full bathroom
- Heating & cooling: Mini split heating and cooling
- Interior features: Eat-in kitchen; Solar screens; Tankless hot water heater
- Laundry & utility: Washer/dryer hookup only; Coin-operated laundry available in community
Neighborhood map
What this means for you Summary
Snapshot
- This is a 1-bed/1.0-bath manufactured listed at $22k.
Deal economics
- At list price, monthly cash flow is $847 ($10k/yr) — positive.
- The deal already cash-flows at list — no discount required.
- Meets the 1% rule at list price ($1k rent vs $22k).
- Recommended offer: $22k (1.5% below list) — sets the bar for market timing.
- Cap rate 52.5% vs local median 3.3% in Phoenix — top-decile yield for the area; either an underpriced asset or a hidden risk that comps aren't pricing in. Stress-test before assuming the spread holds.
Location & tenants
- Location reads 75/100 on livability (#16 in AZ, #3,924 nationally) — a middle-class / working-renter tenant base. Strengths: amenities A+, commute A+, housing A+; Watch: health & safety C-, crime F.
- Paradise Valley Unified District (4241) (urban): math 39% / reading 46% proficiency, ranked #56 of 249 in AZ (top 22%) — families likely to look elsewhere, expect single-tenant / working-renter base with shorter leases.
- Market conditions: Rents soft (-1.5%/yr); 337 active listings in the ZIP; 40 comparable units currently listed for rent nearby; rentals at typical pace (median 18d on market — plan ~3-4 weeks tenant-placement turnaround); solid renter incomes; 36,011 units permitted in Maricopa County in 2024 (12,801 in 5+ unit buildings).
Forward outlook
- Local home prices are declining (-3.0%/yr); year-one equity from $152 of loan paydown is wiped out by about $660 of value loss. Plan a longer hold.
- Maricopa County population projected at +38% by 2050 — long-run rental-demand tailwind backs the buy-and-hold thesis.
- At projected returns (-3.0% appreciation + 0.0% rent growth), your $6k cash investment doubles in ~1 year — after that, you're playing with house money.
Negotiation context
- It's been on market 28 days — a 2% lower offer ($22k) is reasonable based on typical stale-listing flexibility.
- 2 sale attempts with the ask held roughly flat each time — persistent listings suggest the price (not the market) is what's stuck; bring a comps-based counter.
Risks & watch-outs
- Climate carrying-cost: extreme-heat days projected 6→16/yr by 2055 (HVAC capex compounding) — expect insurance premiums to compound above CPI over the hold.
Questions for the listing agent
- Is there a deadline driving the sale (1031 exchange, divorce, estate, relocation)? That informs how much negotiation room exists.
- Crime grade is F in this area — have there been break-ins, vandalism, or insurance claims at this property in the last 3 years? What carrier currently insures it and at what premium?
- What's the average days-on-market for RENTAL listings here right now (not sales)? A rising rental-DOM trend means longer vacancies and softer asking-rent achievability than the comps imply.
- What's the recent tenant-quality profile in this submarket — average credit score on applications, eviction rate, late-payment / NSF rate, and stable-employment percentage? A property-management company in the area should have these aggregated.
- How much new for-sale + rental construction is in the pipeline within 1–3 miles? Heavy new supply typically softens prices + rents 12–24 months out; constrained supply supports both.
Investment metrics
- 1% rule
- 5.75% ✓
- Cap rate
- 52.51%
- Cash-on-cash
- 165.07%
- DSCR
- 8.34
- GRM
- 1.4
CMA / ARV
- ARV (on-the-fly)
- $26,355
- Comps found
- 3
Show comp detail 3 sales within ~0.75 mi
| Address | Dist | Beds/Ba | Sqft | Sold | Price | $/sf | Match |
|---|---|---|---|---|---|---|---|
| 16207 N 34th Way | 0.21mi | 2/1.0 (+1) | 801 (+6%) | 6mo | $120,000 | $150 | 70 |
| 16005 N 32nd St #8 | 0.03mi | 2/1.0 (+1) | 712 (-5%) | 18mo | $25,000 | $35 | 70 |
| 16005 N 32nd St #121 | 0.06mi | 1/1.0 | 800 (+6%) | 22mo | $15,000 | $19 | 68 |
Match score weights: distance 35% · size 25% · config 20% · recency 20%. Top-matched comps best support the ARV.
Projected returns pro-forma
-3.0% appreciation · 0.0% rent growth · sell at horizon
- IRR
- —
- Equity multiple
- 8.58×
- Total profit
- $46,716
- Equity at exit
- $3,280
- IRR
- —
- Equity multiple
- 16.57×
- Total profit
- $95,923
- Equity at exit
- $1,902
Cash invested: $6,160 (down + closing). Projections, not guarantees.
Landlord ↔ Tenant lean methodology
- Overall (STATE)
- 87 Strongly Landlord-Friendly
- State Arizona
- 87 Strongly Landlord-Friendly · R+3
- County
- — inherits STATE
- City
- — inherits STATE
ZIP-level market 85032
- Rents YoY
- -1.5%
- Active inventory
- 337
- Price-to-rent
- 1.4×
Monthly cashflow live
- Estimated rent
- $1,265 high interval (Pro) →
- Mortgage (P&I)
- −$115
- Tax est. 1.5%
- −$28 /mo · $330/yr
- Insurance
- −$9
- HOA
- −$0
- Vacancy / Maint / Mgmt
- −$266
- Net cashflow
- $847
Break-even live
UW: 25.0% down · 7.5% · 30yr · 1.5% tax · 5.0% vac · 8.0% maint · 8.0% mgmt
Financing live
Cash to close
- Down payment
- $5,500
- Closing costs
- $660
- Reserves months
- —
- Total cash needed
- —
Loan-product check · same deal, 3 products live
Conventional
25% down · 7.5% · 30yr
- Down + closing
- —
- Monthly P&I
- —
- Monthly cashflow
- —
- DSCR
- —
- Eligible?
- —
Personal DTI + credit; lowest rate.
DSCR
20% down · 8.5% · 30yr
- Down + closing
- —
- Monthly P&I
- —
- Monthly cashflow
- —
- DSCR
- —
- Eligible?
- —
No personal income docs; deal must DSCR.
Hard money
10% down · 12.0% · 12mo
- Down + closing
- —
- Monthly P&I
- —
- Monthly cashflow
- —
- DSCR
- —
- Eligible?
- —
Short-term bridge; refi at stabilization.
Rent comps 40 comps
| Address | Beds | Baths | Sqft | Rent | $/sqft | DOM | Units | Dist |
|---|---|---|---|---|---|---|---|---|
| 16005 N 32nd St #148 Phoenix, AZ | 2.0 | 2.0 | 780 | $1,549 | $1.99 | 24d | 1 | 0.04mi |
| 15826 N 32nd St Phoenix, AZ | 2.0 | 1.0–2.0 | 611 | $1,180 | $1.93 | 7d | 25 | 0.21mi |
| 13440 N 44th St Unit 1 Phoenix, AZ | 1.0 | 1.0 | 783 | $1,441 | $1.84 | 7d | 1 | 0.34mi |
| 13440 N 44th St Unit 2 Phoenix, AZ | 2.0 | 2.0 | 1102 | $1,748 | $1.59 | 10d | 1 | 0.34mi |
| 15434 N 32nd St Phoenix, AZ | 1.0–2.0 | 1.0–2.0 | 835 | $1,015 | $1.22 | 1d | 8 | 0.34mi |
| 3027 E Grandview Rd Unit 3027-B Phoenix, AZ | 2.0 | 1.0 | 912 | $1,375 | $1.51 | 7d | 1 | 0.39mi |
| 16225 N 30th St #9 Phoenix, AZ | 2.0 | 1.5 | 968 | $1,350 | $1.39 | 24d | 1 | 0.39mi |
| 16402 N 31st St #119 Phoenix, AZ | 2.0 | 2.0 | 933 | $1,375 | $1.47 | 17d | 1 | 0.44mi |
| 16402 N 31st St #119 Phoenix, AZ | 2.0 | 2.0 | 933 | $1,375 | $1.47 | 3d | 1 | 0.44mi |
| 15801 N 29th St #1 Phoenix, AZ | 2.0 | 2.0 | 1108 | $1,650 | $1.49 | 21d | 1 | 0.44mi |
| 15601 N 30th St Unit 5 Phoenix, AZ | 2.0 | 2.0 | 950 | $1,375 | $1.45 | 14d | 1 | 0.45mi |
| 16645 N 31st St Phoenix, AZ | 2.0 | 1.0 | 483 | $1,297 | $2.68 | 1d | 6 | 0.52mi |
| 2846 E Kathleen Rd Phoenix, AZ | 2.0 | 2.0 | 1106 | $949 | $0.86 | 24d | 1 | 0.53mi |
| 2846 E Kathleen Rd Unit 103 Phoenix, AZ | 2.0 | 1.5 | 1106 | $949 | $0.86 | 24d | 1 | 0.53mi |
| 15605 N 29th St Unit 15605UNIT10-1 Phoenix, AZ | 2.0 | 1.0 | 850 | $899 | $1.06 | 24d | 1 | 0.54mi |
| 2931 E Beck Ln Apt 1 Phoenix, AZ | 2.0 | 2.0 | 852 | $1,175 | $1.38 | 5d | 1 | 0.54mi |
| 2950 E Greenway Rd Phoenix, AZ | 1.0–2.0 | 1.0 | 712 | $1,075 | $1.51 | 3d | 7 | 0.55mi |
| 2838 E Monte Cristo Ave Unit 102 Phoenix, AZ | 1.0 | 1.0 | 780 | $1,200 | $1.54 | 7d | 1 | 0.55mi |
| 2837 E Marconi Ave Unit 102 Phoenix, AZ | 1.0 | 1.0 | 700 | $950 | $1.36 | 24d | 1 | 0.55mi |
| 2837 E Marconi Ave Unit 203 Phoenix, AZ | 2.0 | 1.0 | 900 | $975 | $1.08 | 24d | 1 | 0.55mi |
| 2826 E Monte Cristo Ave Phoenix, AZ | 2.0 | 2.0 | 929 | $1,295 | $1.39 | 14d | 1 | 0.57mi |
| 2826 E Monte Cristo Ave Unit 203 Phoenix, AZ | 2.0 | 2.0 | 929 | $1,295 | $1.39 | 16d | 1 | 0.57mi |
| 2822 E Kathleen Rd Unit 203 Phoenix, AZ | 2.0 | 2.0 | 850 | $1,100 | $1.29 | 5d | 1 | 0.57mi |
| 2845 E Tracy Ln #4 Phoenix, AZ | 2.0 | 1.0 | 780 | $1,750 | $2.24 | 10d | 1 | 0.58mi |
| 2826 E Le Marche Ave Unit 102 Phoenix, AZ | 1.0 | 1.0 | 725 | $1,000 | $1.38 | 5d | 1 | 0.58mi |
| 15417 N 29th St Phoenix, AZ | 1.0–2.0 | 1.0 | 704 | $1,050 | $1.49 | 3d | 4 | 0.58mi |
| 2821 E Kathleen Rd Unit 101 Phoenix, AZ | 2.0 | 1.5 | 1106 | $900 | $0.81 | 24d | 1 | 0.59mi |
| 2821 E Kathleen Rd Phoenix, AZ | 2.0 | 2.0 | 1106 | $900 | $0.81 | 24d | 1 | 0.59mi |
| 2819 E Marconi Ave Unit 201 Phoenix, AZ | 2.0 | 2.0 | 900 | $950 | $1.06 | 24d | 1 | 0.61mi |
| 2814 E Kathleen Rd #102 Phoenix, AZ | 1.0 | 1.0 | 700 | $950 | $1.36 | 24d | 1 | 0.61mi |
| 2807 E Monte Cristo Ave Unit 102 Phoenix, AZ | 2.0 | 2.0 | 900 | $865 | $0.96 | 24d | 1 | 0.62mi |
| 2807 E Le Marche Ave Apt 203 Phoenix, AZ | 2.0 | 2.0 | 884 | $995 | $1.13 | 24d | 1 | 0.62mi |
| 2802 E Monte Cristo Ave Unit 102 Phoenix, AZ | 1.0 | 1.0 | 929 | $950 | $1.02 | 24d | 1 | 0.63mi |
| 2848 E Greenway Rd Phoenix, AZ | 2.0 | 1.0 | 750 | $1,350 | $1.80 | 24d | 1 | 0.64mi |
| 3420 E Bell Rd Phoenix, AZ | 2.0 | 1.0–2.0 | 863 | $1,854 | $2.15 | 3d | 20 | 0.66mi |
| 16815 N 29th St Phoenix, AZ | 2.0 | 1.0 | 850 | $1,050 | $1.23 | 16d | 3 | 0.67mi |
| 16815 N 29th St Phoenix, AZ | 2.0 | 1.0 | 850 | $1,199 | $1.41 | 24d | 1 | 0.67mi |
| 16815 N 29th St Apt 146 Phoenix, AZ | 2.0 | 1.0 | 850 | $999 | $1.18 | 24d | 1 | 0.70mi |
| 15651 N 27th St Phoenix, AZ | 1.0–2.0 | 1.0–2.0 | 878 | $950 | $1.08 | 24d | 1 | 0.72mi |
| 16816 N 29th St Apt 202 Phoenix, AZ | 2.0 | 2.0 | 800 | $1,100 | $1.38 | 7d | 1 | 0.74mi |
Listing history 26 events
-
2026-06-18days on market $22,000 Active 28 DOM
-
2026-06-17days on market $22,000 Active 27 DOM
-
2026-06-16days on market $22,000 Active 26 DOM
-
2026-06-15days on market $22,000 Active 25 DOM
-
2026-06-13days on market $22,000 Active 23 DOM
-
2026-06-13days on market $22,000 Active 22 DOM
-
2026-06-09days on market $22,000 Active 19 DOM
-
2026-06-08days on market $22,000 Active 18 DOM
-
2026-06-07days on market $22,000 Active 17 DOM
-
2026-06-04days on market $22,000 Active 14 DOM
-
2026-06-03days on market $22,000 Active 13 DOM
-
2026-06-02days on market $22,000 Active 12 DOM
-
2026-06-01days on market $22,000 Active 11 DOM
-
2026-05-31days on market $22,000 Active 10 DOM
-
2026-05-21$22,000 Active
-
2026-05-01historical
-
2026-04-17price $19,000
-
2026-03-20price $22,500
-
2026-03-17price $24,500
-
2026-02-27price $28,900
-
2026-02-13price $34,900
-
2026-02-05price $39,000
-
2026-01-21price $42,500
-
2026-01-04price $45,000
-
2025-12-29price $42,500
-
2025-11-24$45,000 Active
ⓘ Source: listings_history table (triggers on properties + properties_extension) + one-shot
backfill from property_details.listing_events for pre-trigger history.
Climate risk First Street
- Flood 1/10 Low FEMA zone X (shaded) · 0% chance over 30 yrs
- Wildfire 1/10 Low
- Heat 8/10 Severe 6 d/yr ≥111°F today · 16 d/yr by 30 yrs out
- Wind 1/10 Low
- Air quality 3/10 Moderate 2 unhealthy d/yr today · 3 by 30 yrs out
Nearby sold comps map
Loading sold comps map…
Walkable amenities ~0.75 mi
Loading nearby amenities…
Taxation est. · year 1
- Rental income
- $15,181
- − Mortgage interest
- −$1,232
- − Property taxes
- −$330
- − Insurance
- −$110
- − Repairs & maintenance
- −$1,214
- − Management
- −$1,214
- − Depreciation
- −$640
- Taxable income
- $10,440
- Est. tax owed @ 24.0%
- −$2,505
- After-tax cash flow
- $7,663/yr
For passive investors: Depreciation is non-cash, so a rental often shows a tax loss while cash-flowing — sheltering income. Rental losses are passive: they offset passive income freely, and up to $25,000/yr can offset ordinary (W-2) income if you actively participate and your MAGI is under $100k (phasing out to $0 by $150k); unused losses carry forward. On sale, claimed depreciation is recaptured at up to 25%, and gains may owe capital-gains tax (a 1031 exchange can defer both). Figures are a year-1 estimate at your 24.0% rate — not tax advice; consult a CPA.
Schools (NCES district)
- District
- Paradise Valley Unified District (4241)
- NCES district ID
- 0405930
- Math proficiency
- 39% ▼ -11.00%
- Reading proficiency
- 46% ▼ -7.00%
- Median HH income
- $64,106
- Composite
- 37.89/100
- National rank
- #4316
- State rank
- #56 of 249 in AZ
Livability — Phoenix
- Score
- 75/100
- State rank
- #16
- US rank
- #3924
Category grades
Schools grade is shown separately in the Schools card above.
Census & demographics
- Census place
- Phoenix, AZ
- County
- Maricopa County · 4,537,380 people
- City population
- 1,500,198
- Metro
- Phoenix-Mesa-Chandler, AZ
- Population (ZIP)
- 70,839
- Household income
- $78,643
- Rent vs Own
- Severe rent burden
- 2887.0
Population outlook (Maricopa County) Hauer SSP2
- Today (2025)
- 4,979,203 people
- By 2030
- 5,378,229 · +8.0%
- By 2040
- 6,156,598 · +23.6%
- By 2050
- 6,872,376 · +38.0%
- By 2075
- 8,401,270 · +68.7%
- By 2100
- 9,247,439 · +85.7%
Race, ethnicity, and origin ACS 2023
- Neighborhood character
- Diverse neighborhood (Simpson 0.57)
- Race & ethnicity
- White 59% Hispanic / Latino 29% Two or more races 17% Asian 4% Black 3% Native American 2%
- Hispanic origin (detail)
- Mexican 25%
- Common ancestry
- Romanian 2% Slovak 2% Portuguese 2%
- Foreign-born
- 18% · Canada, China
- Languages at home
- 71% English-only · Spanish 21% Russian/Polish/Slavic 2% Other Indo-European 1%
Political lean MEDSL · Maricopa
- 2024 margin
- Toss-up / Even · D 47.7% · R 51.2% · Other 1.1%
- 2008→2024 swing
- +7.1pp toward D · 2008: -10.6pp · 2024: -3.5pp
- All cycles
- 2024: R+3.5 2020: D+2.2 2016: R+3.5 2012: R+12.0 2008: R+10.6
Not yet ingested
- Civics
- —
Market trends
- HPI YoY
- ▼ -488.65%
- Current HPI
- 339.4181
- Rent YoY
- ▼ -1.46%
- Metro
- Phoenix-Mesa-Chandler, AZ
- State GDP YoY
- ▲ 4.54%
- F500 in state
- 20
Industry mix (Fortune 500 HQ in AZ)
| Industry | F500 HQs | Revenue |
|---|---|---|
| Technology | 2 | $13B |
|
||
| Mining / Metals | 1 | $23B |
|
||
| Environmental Services | 1 | $16B |
|
||
| Metals / Steel | 1 | $14B |
|
||
| Technology Distribution | 1 | $9B |
|
||
| Homebuilding | 1 | $8B |
|
||
Price history
-51.1% since first listed12 events — show timeline
- 2026-05-21 Listed $22,000 ARMLS
- 2026-05-01 Listing Removed — ARMLS
- 2026-04-17 Price Changed $19,000 ARMLS
- 2026-03-20 Price Changed $22,500 ARMLS
- 2026-03-17 Price Changed $24,500 ARMLS
- 2026-02-27 Price Changed $28,900 ARMLS
- 2026-02-13 Price Changed $34,900 ARMLS
- 2026-02-05 Price Changed $39,000 ARMLS
- 2026-01-21 Price Changed $42,500 ARMLS
- 2026-01-04 Price Changed $45,000 ARMLS
- 2025-12-29 Price Changed $42,500 ARMLS
- 2025-11-24 Listed $45,000 ARMLS
Cash-flow waterfall
monthlySold comps — $/sqft
last 12 mo · ≤1 miLoading sold comps…