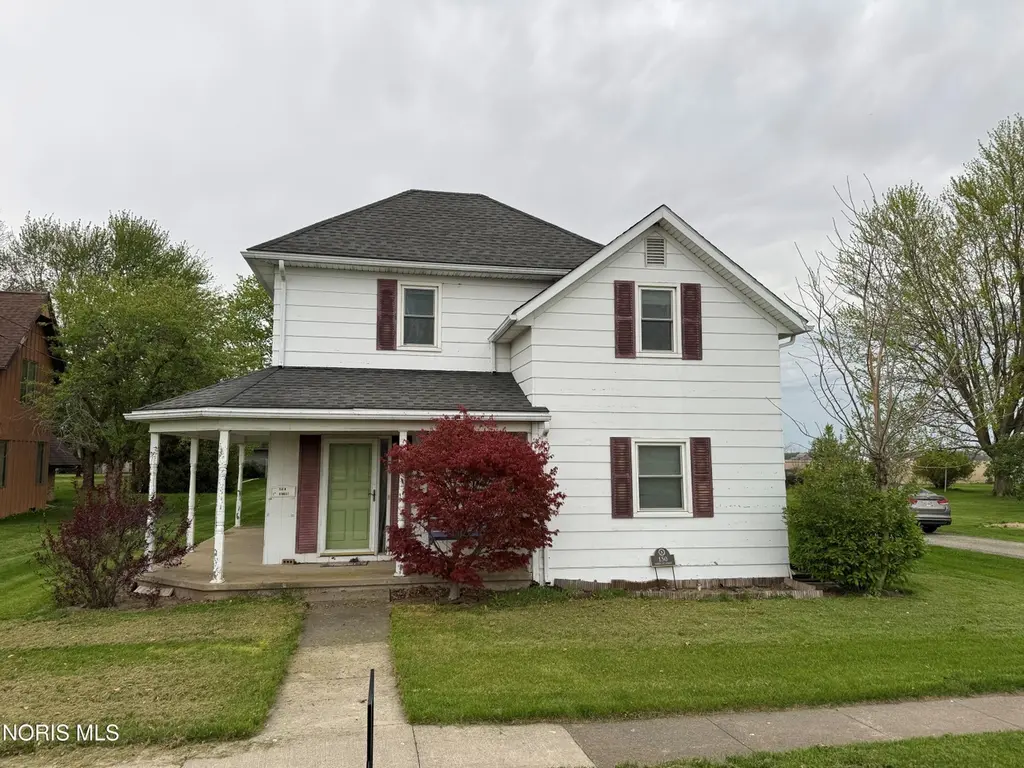
150 N 1st St · Hamler, OH
Flood risk 1/10 · Minimal
- FEMA flood zone
- X
- Chance of flooding over 30 yrs
- 0.0%
- Est. flood insurance / yr
- $507 – $1,088
Fire risk 1/10 · Minimal
- Est. fire insurance / yr
- $713 – $1,323
Heat risk 3/10 · Minor
- Hot days now (above 99°F)
- 7 days/yr
- Hot days in 30 yrs
- 17 days/yr
Wind risk 2/10 · Minimal
- Chance of severe wind over 30 yrs
- —
Air-quality risk 2/10 · Minimal
- Unhealthy air days now
- 1 days/yr
- Unhealthy air days in 30 yrs
- 2 days/yr
Risk factors via First Street. Map © Google.
Why this score? — see what drove the C+ grade
The composite is a weighted blend of 9 inputs, each scored 0–100. Each bar is that input's sub-score; the figure is the points it added to the 100-point composite (weight × sub-score).
- Cash flow +18.0/30.0
- ARV discount +15.0/15.0
- Appreciation +7.4/10.0
- Schools +6.0/10.0
- DSCR +5.6/10.0
- 1% rule +3.8/10.0
- Livability +3.2/5.0
- Rent growth +2.5/5.0
- Condition / age +2.5/5.0
$125,000
🖨 Deal sheet 📄 Offer letter ✓ Due diligence
Listing remarks
Small town living right here! This home has 3 bedrooms but there is a den that could be used as a fourth. Spacious eat-in kitchen with 8x5 walk-in pantry. Updated walk-in shower in main floor bathroom. Upstairs there is a primary bath. Walk-in closets in both upstairs bedrooms. Attached garage with additional storage and cabinets. * * Kitchen cabinet doors that are missing in the photos are there. Property being sold "AS IS" as sellers have never occupied the property however they are unsure as to whether the microwave works.
Key facts
- Attached garage
- Walk-in closets
- Den
Tags
Property features AI
Exterior
- Parking: Attached garage with automatic door opener and storage; Off-street paved driveway; Total parking for 6 vehicles; Garage approximately 2.5 spaces
- Utilities: Electricity connected (100 amp service, circuit breakers); Natural gas connected; Public water; Public sewer (sanitary sewer); Internet available
- Home design: Single-family house; One and one half levels (2 stories total); Not attached to other structures; No common walls
- Construction: Aluminum siding; Asphalt shingle roof; Crawl space foundation; Built as residential single family
- Exterior features: Front porch; Rear patio; Level lot; Pond on property; Highway road frontage; Asphalt/paved road
Interior
- Kitchen: Electric oven and electric range; Electric range connection; Microwave; Dishwasher; Garbage disposal; Refrigerator; Pantry; Eat-in kitchen
- Bedrooms: Primary bedroom (Upper) with ceiling fan; Bedroom 2 (Main); Bedroom 3 (Upper)
- Flooring: Carpet; Vinyl
- Bathrooms: 2 full bathrooms; Accessible full bath
- Heating & cooling: Natural gas boiler heating; Ceiling fans; Wall-mounted cooling units
- Interior features: Eat-in kitchen; Pantry; Ceiling fans throughout; Primary bathroom; Window treatments
- Laundry & utility: Washer and dryer included; Washer hookup; Gas dryer hookup; Main-level laundry; Utility room (Main)
Neighborhood map
What this means for you Summary
Snapshot
- This is a 3-bed/2.0-bath single-family listed at $125k.
Deal economics
- At list price, monthly cash flow is $107 ($1k/yr) — positive.
- The deal already cash-flows at list — no discount required.
- To meet the 1% rule (rent ≥ 1% of price), the offer needs to be $110k (11.7% below list).
- Recommended offer: $110k (11.7% below list) — sets the bar for 1% rule.
Location & tenants
- Location reads 64/100 on livability (#763 in OH) — a middle-class / working-renter tenant base. Strengths: cost of living A+, housing A+; Watch: crime C-, amenities F, commute F.
- Patrick Henry Local (rural): math 69% / reading 72% proficiency, ranked #148 of 656 in OH (top 23%) — strong family-tenant draw, lease renewals of 3-5y typical.
- Zoned schools: Patrick Henry Elementary School (math 87% / reading 77%, grade A+, #116 of 1,584 statewide, top 9%, 324 students, 0% FRL); Patrick Henry Middle School (math 68% / reading 71%, grade A, #143 of 654 statewide, top 23%, 275 students, 0% FRL); Patrick Henry High School (math 52% / reading 64%, grade C, #269 of 781 statewide, top 34%, 252 students, 99% FRL) — zoned schools at 33% FRL track the district average.
- Market conditions: 2 active listings in the ZIP; 18 units permitted in Henry County in 2024 (0 in 5+ unit buildings).
Forward outlook
- In year one you build about $7k of equity ($864 loan paydown + $6k appreciation (4.8% local appreciation)).
- Henry County population projected at -14% by 2050 — secular population decline; favor cash flow + early exit over multi-decade hold.
- At projected returns (4.8% appreciation + 3.0% rent growth), your $35k cash investment doubles in ~4 years — after that, you're playing with house money.
- By year 6, paydown + projected appreciation supports a ~$37k cash-out refi (75% LTV) — recoverable capital for the next deal without selling this one.
Negotiation context
- It's been on market 41 days — a 3% lower offer ($121k) is reasonable based on typical stale-listing flexibility.
- Current owner paid $85k; 47% above their basis — modest negotiation headroom, anchor on the comps not their cost.
Risks & watch-outs
- Watch-outs: built in 1900 — expect roof / HVAC / electrical / plumbing capex.
Questions for the listing agent
- It's been on market 41 days. Have you received any prior offers? Is the seller open to a 12% concession, seller financing, or rate buy-down credit?
- Built in 1900 — when were the roof, HVAC, electrical panel, plumbing, and water heater last replaced?
- Is there a deadline driving the sale (1031 exchange, divorce, estate, relocation)? That informs how much negotiation room exists.
- Schools are B-rated — typically a magnet for longer-tenancy family renters. What's the average tenant stay here, and is there a school-zone premium baked into asking?
- What's the average days-on-market for RENTAL listings here right now (not sales)? A rising rental-DOM trend means longer vacancies and softer asking-rent achievability than the comps imply.
- What's the recent tenant-quality profile in this submarket — average credit score on applications, eviction rate, late-payment / NSF rate, and stable-employment percentage? A property-management company in the area should have these aggregated.
- How much new for-sale + rental construction is in the pipeline within 1–3 miles? Heavy new supply typically softens prices + rents 12–24 months out; constrained supply supports both.
Investment metrics
- 1% rule
- 0.88% ✗
- Cap rate
- 7.32%
- Cash-on-cash
- 3.67%
- DSCR
- 1.16
- GRM
- 9.4
CMA / ARV
- ARV (on-the-fly)
- $174,216
- Comps found
- 4
Show comp detail 4 sales within ~0.75 mi
| Address | Dist | Beds/Ba | Sqft | Sold | Price | $/sf | Match |
|---|---|---|---|---|---|---|---|
| 150 N 1st St | 0.00mi | 3/2.0 | 1,708 (0%) | 0mo | $130,000 | $76 | 100 |
| 435 S First St | 0.34mi | 3/2.0 | 1,756 (+3%) | 23mo | $179,900 | $102 | 60 |
| 210 E Hubbard St | 0.52mi | 4/2.5 (+1) | 1,612 (-6%) | 7mo | $225,000 | $140 | 54 |
| 340 S 1st St | 0.28mi | 3/1.5 | 1,536 (-10%) | 22mo | $134,500 | $88 | 50 |
Match score weights: distance 35% · size 25% · config 20% · recency 20%. Top-matched comps best support the ARV.
Projected returns pro-forma
4.77% appreciation · 3.0% rent growth · sell at horizon
- IRR
- 15.4%
- Equity multiple
- 1.97×
- Total profit
- $33,980
- Equity at exit
- $69,124
- IRR
- 16.0%
- Equity multiple
- 3.79×
- Total profit
- $97,543
- Equity at exit
- $117,907
Cash invested: $35,000 (down + closing). Projections, not guarantees.
Landlord ↔ Tenant lean methodology
- Overall (STATE)
- 73 Landlord-Friendly
- State Ohio
- 73 Landlord-Friendly · R+6
- County
- — inherits STATE
- City
- — inherits STATE
ZIP-level market 43524
- Home prices YoY
- 2.7%
- Active inventory
- 2
- Price-to-rent
- 9.4×
Monthly cashflow live
- Estimated rent
- $1,104 medium interval (Pro) →
- Mortgage (P&I)
- −$656
- Tax from tax record
- −$57 /mo · $688/yr
- Insurance
- −$52
- HOA
- −$0
- Vacancy / Maint / Mgmt
- −$232
- Net cashflow
- $107
Break-even live
UW: 25.0% down · 7.5% · 30yr · 1.5% tax · 5.0% vac · 8.0% maint · 8.0% mgmt
Financing live
Cash to close
- Down payment
- $31,250
- Closing costs
- $3,750
- Reserves months
- —
- Total cash needed
- —
Loan-product check · same deal, 3 products live
Conventional
25% down · 7.5% · 30yr
- Down + closing
- —
- Monthly P&I
- —
- Monthly cashflow
- —
- DSCR
- —
- Eligible?
- —
Personal DTI + credit; lowest rate.
DSCR
20% down · 8.5% · 30yr
- Down + closing
- —
- Monthly P&I
- —
- Monthly cashflow
- —
- DSCR
- —
- Eligible?
- —
No personal income docs; deal must DSCR.
Hard money
10% down · 12.0% · 12mo
- Down + closing
- —
- Monthly P&I
- —
- Monthly cashflow
- —
- DSCR
- —
- Eligible?
- —
Short-term bridge; refi at stabilization.
Listing history 8 events
-
2026-06-03status $125,000 Pending 41 DOM
-
2026-06-02days on market $125,000 Contingent 41 DOM
-
2026-06-01days on market $125,000 Contingent 40 DOM
-
2026-05-31days on market $125,000 Contingent 39 DOM
-
2026-04-27historical Contingent
-
2026-04-21$125,000 Active
-
2013-01-17soldstatus $85,000
-
2000-02-09soldstatus $78,500
ⓘ Source: listings_history table (triggers on properties + properties_extension) + one-shot
backfill from property_details.listing_events for pre-trigger history.
Tax reassessment forecast OH · Partial reset (capped growth)
- Current annual tax
- $688 · $57/mo
- Projected year-2 tax
- $1,319 · $110/mo
- Expected delta
- +$631/yr (+$53/mo · 91.6%)
ⓘ Screening estimate from a state-policy table — verify with the county assessor before closing.
Climate risk First Street
- Flood 1/10 Low FEMA zone X · 0% chance over 30 yrs
- Wildfire 1/10 Low
- Heat 3/10 Moderate 7 d/yr ≥99°F today · 17 d/yr by 30 yrs out
- Wind 2/10 Low
- Air quality 2/10 Low 1 unhealthy d/yr today · 2 by 30 yrs out
Nearby sold comps map
Loading sold comps map…
Walkable amenities ~0.75 mi
Loading nearby amenities…
Taxation est. · year 1
- Rental income
- $13,247
- − Mortgage interest
- −$7,002
- − Property taxes
- −$688
- − Insurance
- −$625
- − Repairs & maintenance
- −$1,060
- − Management
- −$1,060
- − Depreciation
- −$3,636
- Taxable loss
- −$824
- Est. tax savings @ 24.0%
- +$198
- After-tax cash flow
- $1,483/yr
For passive investors: Depreciation is non-cash, so a rental often shows a tax loss while cash-flowing — sheltering income. Rental losses are passive: they offset passive income freely, and up to $25,000/yr can offset ordinary (W-2) income if you actively participate and your MAGI is under $100k (phasing out to $0 by $150k); unused losses carry forward. On sale, claimed depreciation is recaptured at up to 25%, and gains may owe capital-gains tax (a 1031 exchange can defer both). Figures are a year-1 estimate at your 24.0% rate — not tax advice; consult a CPA.
Schools (NCES district)
- District
- Patrick Henry Local
- NCES district ID
- 3904759
- Math proficiency
- 69% ▼ -7.00%
- Reading proficiency
- 72% ▼ -5.00%
- Median HH income
- $50,401
- Composite
- 59.81/100
- National rank
- #897
- State rank
- #148 of 656 in OH
Livability — Hamler
- Score
- 64/100
- State rank
- #763
- US rank
- #13768
Category grades
Schools grade is shown separately in the Schools card above.
Census & demographics
- Census place
- Hamler, OH
- County
- Henry · 27,211 people
- City population
- 1,012
- Population (ZIP)
- 1,012
- Household income
- $62,188
- Rent vs Own
Population outlook (Henry County) Hauer SSP2
- Today (2025)
- 27,204 people
- By 2030
- 26,657 · -2.0%
- By 2040
- 25,149 · -7.6%
- By 2050
- 23,361 · -14.1%
- By 2075
- 20,409 · -25.0%
- By 2100
- 18,199 · -33.1%
Race, ethnicity, and origin ACS 2023
- Neighborhood character
- Predominantly White (85%)
- Race & ethnicity
- White 85% Hispanic / Latino 12% Two or more races 7%
- Hispanic origin (detail)
- Mexican 10% Puerto Rican 1%
- Common ancestry
- Slovak 4% English 2% Romanian 2%
- Foreign-born
- 0% · Canada
- Languages at home
- 94% English-only · Spanish 3% German/W. Germanic 3%
Political lean MEDSL · Henry
- 2024 margin
- Solid R (+46.7) · D 26.2% · R 72.9%
- 2008→2024 swing
- -33.8pp toward R · 2008: -12.9pp · 2024: -46.7pp
- All cycles
- 2024: R+46.7 2020: R+43.5 2016: R+39.8 2012: R+18.6 2008: R+12.9
Not yet ingested
- Civics
- —
Market trends
- HPI YoY
- ▲ 4.77%
- Current HPI
- 183.7761
- Rent YoY
- —
- Metro
- —
- State GDP YoY
- ▲ 1.98%
- F500 in state
- 48
Industry mix (Fortune 500 HQ in OH)
| Industry | F500 HQs | Revenue |
|---|---|---|
| Insurance | 3 | $145B |
|
||
| Industrial Machinery | 3 | $49B |
|
||
| Financial Services | 3 | $24B |
|
||
| Consumer Goods | 2 | $93B |
|
||
| Aerospace / Defense | 2 | $47B |
|
||
| Utilities | 2 | $33B |
|
||
Price history
+59.2% since first listed4 events — show timeline
- 2026-04-27 Contingent — NORIS
- 2026-04-21 Listed $125,000 NORIS
- 2013-01-17 Sold (Public Records) $85,000 Public Records
- 2000-02-09 Sold (Public Records) $78,500 Public Records
Property tax history
-6.8%/yrLatest (2025): $688 · -5.8% YoY. Source: county tax records.
Cash-flow waterfall
monthlySold comps — $/sqft
last 12 mo · ≤1 miLoading sold comps…