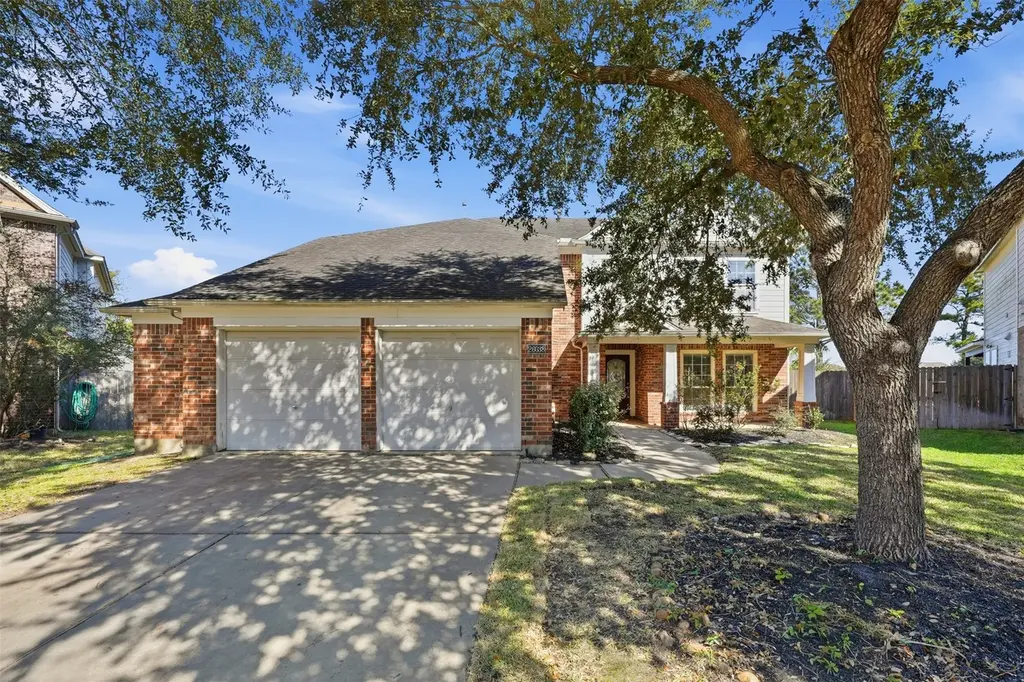
26038 Palmdale Estate Dr · Houston, TX
Flood risk 1/10 · Minimal
- FEMA flood zone
- X (unshaded)
- Chance of flooding over 30 yrs
- 0.0%
- Est. flood insurance / yr
- $507 – $1,088
Fire risk 3/10 · Minor
- Est. fire insurance / yr
- $1,222 – $2,270
Heat risk 9/10 · Severe
- Hot days now (above 111°F)
- 7 days/yr
- Hot days in 30 yrs
- 23 days/yr
Wind risk 9/10 · Severe
- Chance of severe wind over 30 yrs
- 99.0%
Air-quality risk 2/10 · Minimal
- Unhealthy air days now
- 1 days/yr
- Unhealthy air days in 30 yrs
- 1 days/yr
Risk factors via First Street. Map © Google.
Why this score? — see what drove the D- grade
The composite is a weighted blend of 9 inputs, each scored 0–100. Each bar is that input's sub-score; the figure is the points it added to the 100-point composite (weight × sub-score).
- ARV discount +15.0/15.0
- Cash flow +6.3/30.0
- Schools +4.6/10.0
- Livability +3.7/5.0
- 1% rule +2.9/10.0
- Condition / age +2.5/5.0
- Rent growth +2.1/5.0
- DSCR +0.6/10.0
- Appreciation +0.0/10.0
$339,000
🖨 Deal sheet 📄 Offer letter ✓ Due diligence
Listing remarks MLS
This home features 4 large bedrooms 2.5 baths with a split and open living floor plan. This highly functional home sits on a cul de sac lot with no back yard neighbors and boast a highly functional 2.5 car garage, with full sprinkler system and covered back yard patio. The kitchen is large and has custom wood cabinets and beautiful granite counter tops with up graded lighting throughout. Wood laminate floors throughout the first floor. Large 16x12 game room, high ceilings.
Key facts
- Custom wood cabinets
- Granite counter tops
- Cul de sac lot
Tags
Neighborhood map
What this means for you Summary
Snapshot
- This is a 4-bed/3.0-bath single-family listed at $339k.
Deal economics
- At list price, monthly cash flow is $-596 ($-7k/yr) — negative.
- To cash-flow at today's rent, offer at most $234k (31.0% below list).
- To meet the 1% rule (rent ≥ 1% of price), the offer needs to be $269k (20.8% below list).
- Recommended offer: $234k (31.0% below list) — sets the bar for cash-flow.
- Cap rate 4.2% vs local median 3.2% in Houston — top-decile yield for the area; either an underpriced asset or a hidden risk that comps aren't pricing in. Stress-test before assuming the spread holds.
Location & tenants
- Location reads 74/100 on livability (#184 in TX, #4,771 nationally) — a middle-class / working-renter tenant base. Strengths: amenities A+, cost of living A+, housing A+; Watch: schools D, crime F.
- Lamar CISD (suburban): math 50% / reading 53% proficiency, ranked #116 of 826 in TX (top 14%) — acceptable for families but not a draw, mixed tenant base, ~2y average lease.
- Market conditions: Rents soft (-1.6%/yr); 1222 active listings in the ZIP; 9 comparable units currently listed for rent nearby; rentals lingering (median 44d on market — plan ~5-8 weeks vacancy on turnover, expect pricing pressure); 67% of comp listings sitting > 30 days — soft ceiling on asking rent; high-income renter base; 12,093 units permitted in Fort Bend County in 2024 (815 in 5+ unit buildings).
Forward outlook
- Local home prices are declining (-3.0%/yr); year-one equity from $2k of loan paydown is wiped out by about $10k of value loss. Plan a longer hold.
- Fort Bend County population projected at +75% by 2050 — long-run rental-demand tailwind backs the buy-and-hold thesis.
Negotiation context
- It's been on market 31 days — a 3% lower offer ($329k) is reasonable based on typical stale-listing flexibility.
- 9 sale attempts since 9y ago; this cycle's ask is 13737% above the opening price — seller raised mid-cycle; expect resistance to lowballs.
Risks & watch-outs
- Watch-outs: property tax is 2.5% of price.
- Climate carrying-cost: severe wind risk, 99% chance of damaging wind over 30y; extreme-heat days projected 7→23/yr by 2055 (HVAC capex compounding) — expect insurance premiums to compound above CPI over the hold.
Questions for the listing agent
- What do current leases actually rent for vs. the listed asking? Can we see a recent rent roll and the last 12 months of T-12 income?
- It's been on market 31 days. Have you received any prior offers? Is the seller open to a 31% concession, seller financing, or rate buy-down credit?
- Property tax is high relative to price — has the assessment been appealed recently, and will the sale trigger a re-assessment?
- What does the HOA fee cover, when was the last increase, and are there any pending special assessments or reserve-fund shortfalls?
- Is there a deadline driving the sale (1031 exchange, divorce, estate, relocation)? That informs how much negotiation room exists.
- Schools are D-rated, which usually means shorter tenancies and higher turnover. Who's the typical renter profile here, and what's been the actual vacancy rate?
- Crime grade is F in this area — have there been break-ins, vandalism, or insurance claims at this property in the last 3 years? What carrier currently insures it and at what premium?
- The area grade is low — what's the realistic commute time and amenity access for the typical tenant pool here? Any planned neighborhood developments (good or bad) we should know about?
- What's the average days-on-market for RENTAL listings here right now (not sales)? A rising rental-DOM trend means longer vacancies and softer asking-rent achievability than the comps imply.
- What's the recent tenant-quality profile in this submarket — average credit score on applications, eviction rate, late-payment / NSF rate, and stable-employment percentage? A property-management company in the area should have these aggregated.
- How much new for-sale + rental construction is in the pipeline within 1–3 miles? Heavy new supply typically softens prices + rents 12–24 months out; constrained supply supports both.
Investment metrics
- 1% rule
- 0.79% ✗
- Cap rate
- 4.18%
- Cash-on-cash
- -7.53%
- DSCR
- 0.66
- GRM
- 10.5
CMA / ARV
- ARV (median comp)
- $548,333
- List price
- $339,000
- Delta
- -38.18%
- Verdict
- UNDERPRICED
- Comps
- 20 within 1.0 mi
Show comp detail 12 sales within ~0.75 mi
| Address | Dist | Beds/Ba | Sqft | Sold | Price | $/sf | Match |
|---|---|---|---|---|---|---|---|
| 11023 Anilu Dr | 0.06mi | 4/2.5 | 2,578 (-1%) | 1mo | $349,000 | $135 | 93 |
| 26019 Pagemill | 0.10mi | 3/2.0 (-1) | 2,315 (-11%) | 1mo | $362,500 | $157 | 67 |
| 11510 Lantana Reach Dr | 0.61mi | 4/2.5 | 2,757 (+6%) | 0mo | $379,000 | $137 | 59 |
| 26419 Polaris Rise Ln | 0.57mi | 4/3.0 | 2,373 (-9%) | 1mo | $415,000 | $175 | 58 |
| 25826 Riverside Creek Dr | 0.29mi | 3/2.0 (-1) | 2,231 (-14%) | 0mo | $379,000 | $170 | 54 |
| 26303 Polaris Rise Ln | 0.53mi | 3/3.0 (-1) | 2,336 (-10%) | 1mo | $409,000 | $175 | 53 |
| 26218 Caper Meadow Ln | 0.67mi | 4/3.5 | 2,800 (+8%) | 1mo | $490,000 | $175 | 53 |
| 6603 Lavender Bend Ln | 0.59mi | 4/2.5 | 2,885 (+11%) | 0mo | $450,000 | $156 | 52 |
| 26235 Serenity Oaks Dr | 0.48mi | 4/2.0 | 2,238 (-14%) | 1mo | $397,500 | $178 | 50 |
| 10311 Melida Dawn Way | 0.73mi | 4/3.0 | 2,263 (-13%) | 2mo | $409,990 | $181 | 43 |
| 26822 Chandrila Vista Ct | 0.74mi | 3/2.5 (-1) | 2,330 (-10%) | 2mo | $399,900 | $172 | 40 |
| 25414 Hamden Valley Dr | 0.73mi | 3/2.5 (-1) | 2,882 (+11%) | 1mo | $420,000 | $146 | 40 |
Match score weights: distance 35% · size 25% · config 20% · recency 20%. Top-matched comps best support the ARV.
Projected returns pro-forma
-3.0% appreciation · 0.0% rent growth · sell at horizon
- IRR
- -33.4%
- Equity multiple
- -0.06×
- Total profit
- $-100,480
- Equity at exit
- $50,546
- IRR
- -68.5%
- Equity multiple
- -0.75×
- Total profit
- $-165,675
- Equity at exit
- $29,311
Cash invested: $94,920 (down + closing). Projections, not guarantees.
Landlord ↔ Tenant lean methodology
- Overall (STATE)
- 87 Strongly Landlord-Friendly
- State Texas
- 87 Strongly Landlord-Friendly · R+5
- County
- — inherits STATE
- City
- — inherits STATE
ZIP-level market 77406
- Home prices YoY
- -26.2%
- Rents YoY
- -1.6%
- Active inventory
- 1222
- Price-to-rent
- 10.5×
Monthly cashflow live
- Estimated rent
- $2,685 high interval (Pro) →
- Mortgage (P&I)
- −$1,778
- Tax from tax record
- −$717 /mo · $8,608/yr
- Insurance
- −$141
- HOA
- −$81
- Vacancy / Maint / Mgmt
- −$564
- Net cashflow
- $-596
Break-even live
UW: 25.0% down · 7.5% · 30yr · 1.5% tax · 5.0% vac · 8.0% maint · 8.0% mgmt
Financing live
Cash to close
- Down payment
- $84,750
- Closing costs
- $10,170
- Reserves months
- —
- Total cash needed
- —
Loan-product check · same deal, 3 products live
Conventional
25% down · 7.5% · 30yr
- Down + closing
- —
- Monthly P&I
- —
- Monthly cashflow
- —
- DSCR
- —
- Eligible?
- —
Personal DTI + credit; lowest rate.
DSCR
20% down · 8.5% · 30yr
- Down + closing
- —
- Monthly P&I
- —
- Monthly cashflow
- —
- DSCR
- —
- Eligible?
- —
No personal income docs; deal must DSCR.
Hard money
10% down · 12.0% · 12mo
- Down + closing
- —
- Monthly P&I
- —
- Monthly cashflow
- —
- DSCR
- —
- Eligible?
- —
Short-term bridge; refi at stabilization.
Rent comps 9 comps
| Address | Beds | Baths | Sqft | Rent | $/sqft | DOM | Units | Dist |
|---|---|---|---|---|---|---|---|---|
| 25810 Palmdale Estate Dr Richmond, TX | 4.0 | 2.0 | 2008 | $2,350 | $1.17 | 43d | 1 | 0.22mi |
| 26122 Serenity Oaks Dr Richmond, TX | 4.0 | 3.0 | 2438 | $2,386 | $0.98 | 5d | 1 | 0.49mi |
| 26407 Polaris Rise Ln Richmond, TX | 4.0 | 3.5 | 3260 | $3,750 | $1.15 | 43d | 1 | 0.57mi |
| 10503 Shinning Dawn Way Richmond, TX | 4.0 | 3.5 | 2523 | $3,399 | $1.35 | 43d | 1 | 0.69mi |
| 26439 Richwood Oaks Dr Katy, TX | 3.0 | 2.0 | 1756 | $2,050 | $1.17 | 43d | 1 | 1.05mi |
| 6015 Starbrook Creek Dr Katy, TX | 4.0 | 2.5 | 2181 | $2,410 | $1.10 | 43d | 1 | 1.15mi |
| 24715 Gracefield Haven Ln Richmond, TX | 4.0 | 3.5 | 3337 | $3,425 | $1.03 | 22d | 1 | 1.32mi |
| 6411 Tea Tree Dr Katy, TX | 4.0 | 2.5 | 2168 | $6,900 | $3.18 | 43d | 1 | 1.35mi |
| 6106 Carver Pines Dr Katy, TX | 4.0 | 2.0 | 2557 | $2,479 | $0.97 | 5d | 1 | 1.45mi |
HOA detail
- Monthly dues
- $81 · $972/yr
Listing history 37 events
-
2026-06-18days on market $339,000 Active 31 DOM
-
2026-06-17days on market $339,000 Active 30 DOM
-
2026-06-16days on market $339,000 Active 29 DOM
-
2026-06-15days on market $339,000 Active 28 DOM
-
2026-06-13days on market $339,000 Active 26 DOM
-
2026-06-09days on market $339,000 Active 22 DOM
-
2026-06-08days on market $339,000 Active 21 DOM
-
2026-06-07days on market $339,000 Active 20 DOM
-
2026-06-04days on market $339,000 Active 17 DOM
-
2026-06-03days on market $339,000 Active 16 DOM
-
2026-06-02days on market $339,000 Active 15 DOM
-
2026-06-01days on market $339,000 Active 14 DOM
-
2026-05-31days on market $339,000 Active 13 DOM
-
2026-05-19$2,450
-
2026-05-18historical $2,450
Show marketing remark (477 chars)
This home features 4 large bedrooms 2.5 baths with a split and open living floor plan. This highly functional home sits on a cul de sac lot with no back yard neighbors and boast a highly functional 2.5 car garage, with full sprinkler system and covered back yard patio. The kitchen is large and has custom wood cabinets and beautiful granite counter tops with up graded lighting throughout. Wood laminate floors throughout the first floor. Large 16x12 game room, high ceilings.
-
2026-05-18historical
Show marketing remark (477 chars)
This home features 4 large bedrooms 2.5 baths with a split and open living floor plan. This highly functional home sits on a cul de sac lot with no back yard neighbors and boast a highly functional 2.5 car garage, with full sprinkler system and covered back yard patio. The kitchen is large and has custom wood cabinets and beautiful granite counter tops with up graded lighting throughout. Wood laminate floors throughout the first floor. Large 16x12 game room, high ceilings.
-
2026-05-18$339,000 Active 477-char remark
Show marketing remark (477 chars)
This home features 4 large bedrooms 2.5 baths with a split and open living floor plan. This highly functional home sits on a cul de sac lot with no back yard neighbors and boast a highly functional 2.5 car garage, with full sprinkler system and covered back yard patio. The kitchen is large and has custom wood cabinets and beautiful granite counter tops with up graded lighting throughout. Wood laminate floors throughout the first floor. Large 16x12 game room, high ceilings.
-
2026-03-30status Active
-
2026-03-26historical
-
2026-03-05price $2,450
-
2026-03-05price $339,000
-
2026-02-03$2,500
-
2026-02-02$349,000 Active
-
2019-10-18soldstatus
-
2019-10-15soldstatus Sold
-
2019-09-24status Pending
-
2019-09-18status Option Pending
-
2019-08-18price $239,000
-
2019-08-16historical
-
2019-08-16$245,000 Active
-
2019-07-23$249,900 Active
-
2019-07-23historical
-
2019-06-07$249,900 Active
-
2017-09-11soldstatus Sold
-
2017-09-11soldstatus
-
2017-08-24status Pending
-
2017-08-12$242,500 Active
ⓘ Source: listings_history table (triggers on properties + properties_extension) + one-shot
backfill from property_details.listing_events for pre-trigger history.
Tax reassessment forecast TX · Resets to sale price
- Current annual tax
- $8,608 · $717/mo
- Projected year-2 tax
- $8,608 · $717/mo
- Expected delta
- $0/yr ($0/mo · 0.0%)
ⓘ Screening estimate from a state-policy table — verify with the county assessor before closing.
Climate risk First Street
- Flood 1/10 Low FEMA zone X (unshaded) · 0% chance over 30 yrs
- Wildfire 3/10 Moderate
- Heat 9/10 Extreme 7 d/yr ≥111°F today · 23 d/yr by 30 yrs out
- Wind 9/10 Extreme 99% chance of damaging wind over 30 yrs
- Air quality 2/10 Low 1 unhealthy d/yr today · 1 by 30 yrs out
Nearby sold comps map
Loading sold comps map…
Walkable amenities ~0.75 mi
Loading nearby amenities…
Taxation est. · year 1
- Rental income
- $32,225
- − Mortgage interest
- −$18,989
- − Property taxes
- −$8,608
- − Insurance
- −$1,695
- − Repairs & maintenance
- −$2,578
- − Management
- −$2,578
- − HOA
- −$972
- − Depreciation
- −$9,862
- Taxable loss
- −$13,057
- Est. tax savings @ 24.0%
- +$3,134
- After-tax cash flow
- $-4,016/yr
For passive investors: Depreciation is non-cash, so a rental often shows a tax loss while cash-flowing — sheltering income. Rental losses are passive: they offset passive income freely, and up to $25,000/yr can offset ordinary (W-2) income if you actively participate and your MAGI is under $100k (phasing out to $0 by $150k); unused losses carry forward. On sale, claimed depreciation is recaptured at up to 25%, and gains may owe capital-gains tax (a 1031 exchange can defer both). Figures are a year-1 estimate at your 24.0% rate — not tax advice; consult a CPA.
Schools (NCES district)
- District
- Lamar CISD
- NCES district ID
- 4826580
- Math proficiency
- 50% ▼ -12.00%
- Reading proficiency
- 53% ▼ -4.00%
- Median HH income
- $75,213
- Composite
- 46.43/100
- National rank
- #2452
- State rank
- #116 of 826 in TX
Livability — Houston
- Score
- 74/100
- State rank
- #184
- US rank
- #4771
Category grades
Schools grade is shown separately in the Schools card above.
Census & demographics
- County
- Fort Bend County · 836,777 people
- City population
- 3,226,434
- Metro
- Houston-The Woodlands-Sugar Land, TX
- Population (ZIP)
- 69,918
- Household income
- $141,869
- Rent vs Own
- Severe rent burden
- 575.0
Population outlook (Fort Bend County) Hauer SSP2
- Today (2025)
- 1,004,526 people
- By 2030
- 1,153,104 · +14.8%
- By 2040
- 1,453,718 · +44.7%
- By 2050
- 1,753,781 · +74.6%
- By 2075
- 2,455,772 · +144.5%
- By 2100
- 2,930,528 · +191.7%
Race, ethnicity, and origin ACS 2023
- Neighborhood character
- Highly diverse neighborhood (Simpson 0.72)
- Race & ethnicity
- White 43% Hispanic / Latino 26% Two or more races 15% Black 14% Asian 12%
- Hispanic origin (detail)
- Mexican 18% Puerto Rican 1%
- Common ancestry
- Lithuanian 2% Romanian 1% Iranian 1%
- Foreign-born
- 17% · Canada, Vietnam, China
- Languages at home
- 73% English-only · Spanish 14% Other Indo-European 3% Vietnamese 2%
Political lean MEDSL · Fort Bend
- 2024 margin
- Toss-up / Even · D 49.5% · R 47.9% · Other 2.6%
- 2008→2024 swing
- +4.0pp toward D · 2008: -2.4pp · 2024: 1.6pp
- All cycles
- 2024: D+1.6 2020: D+10.6 2016: D+6.6 2012: R+6.8 2008: R+2.4
Not yet ingested
- Civics
- —
Market trends
- HPI YoY
- ▼ -79.18%
- Current HPI
- 222.9525
- Rent YoY
- ▼ -1.61%
- Metro
- Houston-The Woodlands-Sugar Land, TX
- State GDP YoY
- ▲ 3.95%
- F500 in state
- 110
Industry mix (Fortune 500 HQ in TX)
| Industry | F500 HQs | Revenue |
|---|---|---|
| Energy | 16 | $1,198B |
|
||
| Technology | 5 | $198B |
|
||
| Engineering / Construction | 4 | $72B |
|
||
| Energy Services | 3 | $60B |
|
||
| Utilities | 3 | $41B |
|
||
| Healthcare | 2 | $330B |
|
||
Price history
-99.0% since first listed24 events — show timeline
- 2026-05-19 Listed for Rent $2,450 HARMLS
- 2026-05-18 Rental Removed $2,450 HARMLS
- 2026-05-18 Listed $339,000 HARMLS
- 2026-05-18 Listing Removed — HARMLS
- 2026-03-30 Relisted — HARMLS
- 2026-03-26 Listing Removed — HARMLS
- 2026-03-05 Price Changed $2,450 HARMLS
- 2026-03-05 Price Changed $339,000 HARMLS
- 2026-02-03 Listed for Rent $2,500 HARMLS
- 2026-02-02 Listed $349,000 HARMLS
- 2019-10-18 Sold (Public Records) — Public Records
- 2019-10-15 Sold (MLS) — HARMLS
- 2019-09-24 Pending — HARMLS
- 2019-09-18 Pending — HARMLS
- 2019-08-18 Price Changed $239,000 HARMLS
- 2019-08-16 Listed $245,000 HARMLS
- 2019-08-16 Listing Removed — HARMLS
- 2019-07-23 Listing Removed — HARMLS
- 2019-07-23 Listed $249,900 HARMLS
- 2019-06-07 Listed $249,900 HARMLS
- 2017-09-11 Sold (Public Records) — Public Records
- 2017-09-11 Sold (MLS) — HARMLS
- 2017-08-24 Pending — HARMLS
- 2017-08-12 Listed $242,500 HARMLS
Property tax history
+2.4%/yrLatest (2025): $8,608 · -1.3% YoY. Source: county tax records.
Cash-flow waterfall
monthlySold comps — $/sqft
last 12 mo · ≤1 miLoading sold comps…