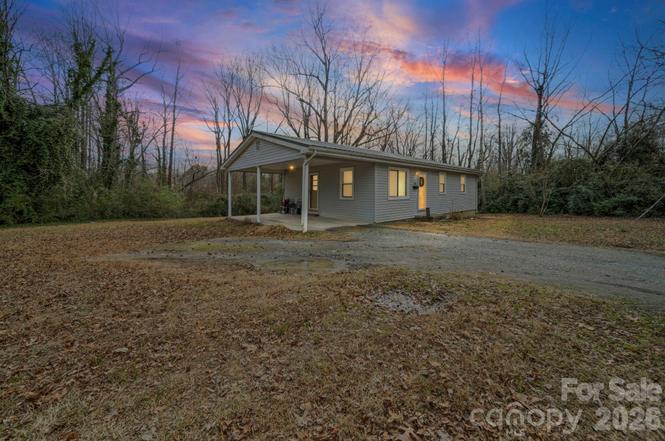
525 Stanley St · Troy, NC
Flood risk 1/10 · Minimal
- FEMA flood zone
- X (unshaded)
- Chance of flooding over 30 yrs
- 0.0%
- Est. flood insurance / yr
- $507 – $1,088
Fire risk 3/10 · Minor
- Est. fire insurance / yr
- $906 – $1,684
Heat risk 6/10 · Moderate
- Hot days now (above 107°F)
- 7 days/yr
- Hot days in 30 yrs
- 16 days/yr
Wind risk 6/10 · Moderate
- Chance of severe wind over 30 yrs
- 27.0%
Air-quality risk 2/10 · Minimal
- Unhealthy air days now
- 0 days/yr
- Unhealthy air days in 30 yrs
- 1 days/yr
Risk factors via First Street. Map © Google.
Why this score? — see what drove the B- grade
The composite is a weighted blend of 9 inputs, each scored 0–100. Each bar is that input's sub-score; the figure is the points it added to the 100-point composite (weight × sub-score).
- Cash flow +20.8/30.0
- ARV discount +15.0/15.0
- Appreciation +10.0/10.0
- DSCR +6.6/10.0
- 1% rule +4.2/10.0
- Livability +3.4/5.0
- Schools +2.6/10.0
- Rent growth +2.5/5.0
- Condition / age +2.5/5.0
$125,000
🖨 Deal sheet 📄 Offer letter ✓ Due diligence
Listing remarks
Back on the Market! Located at 525 Stanley St in Troy, NC, this 3-bedroom, 1-bath home offers a solid opportunity for investors or buyers looking to add their personal touch. The property will need some TLC but has great potential to be transformed into a charming primary residence, rental, or flip. Conveniently situated near local shopping, dining, and downtown Troy amenities. Whether you’re searching for your next project or an affordable entry into homeownership, this property is worth a look. ?? BACK ON THE MARKET – NO FAULT OF THE SELLER ?? ?? 525 Stanley St, Troy The previous buyer had to walk away for personal reasons—which means YOU just got a second shot at a
Key facts
- Dining
- Local shopping
- 7,840 sq ft lot
Tags
Property features AI
Finance
- HOA & community: No HOA
Exterior
- Parking: Driveway; Attached garage (1 garage space, main level)
- Utilities: City water; Public sewer
- Home design: Single-family residence; One-story (main level); Site-built
- Construction: Aluminum, vinyl, and wood exterior materials; Aluminum roof; Crawl space foundation
- Exterior features: Shed(s); Dirt and gravel road access; Road is publicly maintained
Interior
- Kitchen: Electric range; Refrigerator
- Bedrooms: 3 bedrooms on the main level
- Bathrooms: 1 full bathroom on the main level
- Heating & cooling: Central heating; Central air conditioning
- Interior features: 3 total rooms; Electric range; Refrigerator
- Laundry & utility: No laundry features listed
Neighborhood map
What this means for you Summary
Snapshot
- This is a 2-bed/1.0-bath single-family listed at $125k.
Deal economics
- At list price, monthly cash flow is $172 ($2k/yr) — positive.
- The deal already cash-flows at list — no discount required.
- To meet the 1% rule (rent ≥ 1% of price), the offer needs to be $115k (8.3% below list).
- Recommended offer: $115k (8.3% below list) — sets the bar for 1% rule.
Location & tenants
- Location reads 68/100 on livability (#181 in NC) — a middle-class / working-renter tenant base. Strengths: cost of living A+, housing A+, health & safety A+; Watch: amenities F, commute F, employment F.
- Montgomery County Schools (rural): math 29% / reading 34% proficiency, ranked #143 of 178 in NC (top 80%) — families likely to look elsewhere, expect single-tenant / working-renter base with shorter leases; 66% free/reduced lunch — lower-income household profile, screen leases tightly.
- Zoned schools: Troy Elementary (287 students, 76% FRL); Montgomery Central High (math 42% / reading 39%, grade F, #387 of 535 statewide, top 73%, 893 students, 73% FRL).
- Market conditions: 48 active listings in the ZIP; 138 units permitted in Montgomery County in 2024 (0 in 5+ unit buildings).
Forward outlook
- In year one you build about $13k of equity ($864 loan paydown + $12k appreciation (10.0% local appreciation)).
- Montgomery County population projected at -17% by 2050 — secular population decline; favor cash flow + early exit over multi-decade hold.
- At projected returns (10.0% appreciation + 3.0% rent growth), your $35k cash investment doubles in ~3 years — after that, you're playing with house money.
- By year 3, paydown + projected appreciation supports a ~$34k cash-out refi (75% LTV) — recoverable capital for the next deal without selling this one.
Negotiation context
- It's been on market 76 days — a 6% lower offer ($118k) is reasonable based on typical stale-listing flexibility.
- 2 sale attempts with the ask held roughly flat each time — persistent listings suggest the price (not the market) is what's stuck; bring a comps-based counter.
Risks & watch-outs
- Climate carrying-cost: major wind risk, 27% chance of damaging wind over 30y; extreme-heat days projected 7→16/yr by 2055 (HVAC capex compounding) — expect insurance premiums to compound above CPI over the hold.
Questions for the listing agent
- It's been on market 76 days. Have you received any prior offers? Is the seller open to a 8% concession, seller financing, or rate buy-down credit?
- Built in 1969 — when were the roof, HVAC, electrical panel, plumbing, and water heater last replaced?
- Why hasn't it sold? Are there any deal-killer items the seller is aware of (foundation, flood, title, zoning, code violations)?
- Is there a deadline driving the sale (1031 exchange, divorce, estate, relocation)? That informs how much negotiation room exists.
- Schools are D-rated, which usually means shorter tenancies and higher turnover. Who's the typical renter profile here, and what's been the actual vacancy rate?
- What's the average days-on-market for RENTAL listings here right now (not sales)? A rising rental-DOM trend means longer vacancies and softer asking-rent achievability than the comps imply.
- What's the recent tenant-quality profile in this submarket — average credit score on applications, eviction rate, late-payment / NSF rate, and stable-employment percentage? A property-management company in the area should have these aggregated.
- How much new for-sale + rental construction is in the pipeline within 1–3 miles? Heavy new supply typically softens prices + rents 12–24 months out; constrained supply supports both.
Investment metrics
- 1% rule
- 0.92% ✗
- Cap rate
- 7.95%
- Cash-on-cash
- 5.90%
- DSCR
- 1.26
- GRM
- 9.1
CMA / ARV
- ARV (on-the-fly)
- $164,160
- Comps found
- 6
Show comp detail 6 sales within ~0.75 mi
| Address | Dist | Beds/Ba | Sqft | Sold | Price | $/sf | Match |
|---|---|---|---|---|---|---|---|
| 203 Barnhill St | 0.35mi | 3/1.0 (+1) | 960 (0%) | 7mo | $80,000 | $83 | 73 |
| 522 Perry St | 0.20mi | 3/2.0 (+1) | 1,043 (+9%) | 12mo | $178,500 | $171 | 57 |
| 155 Faduma St | 0.30mi | 3/1.0 (+1) | 931 (-3%) | 24mo | $69,600 | $75 | 56 |
| 417 S Pearl St | 0.29mi | 3/1.0 (+1) | 1,015 (+6%) | 21mo | $174,000 | $171 | 54 |
| 205 W Roswell St | 0.70mi | 3/2.0 (+1) | 1,067 (+11%) | 6mo | $225,000 | $211 | 34 |
| 306 W Roswell St | 0.73mi | 3/2.0 (+1) | 1,102 (+15%) | 3mo | $192,000 | $174 | 30 |
Match score weights: distance 35% · size 25% · config 20% · recency 20%. Top-matched comps best support the ARV.
Projected returns pro-forma
10.0% appreciation · 3.0% rent growth · sell at horizon
- IRR
- 28.5%
- Equity multiple
- 3.26×
- Total profit
- $78,981
- Equity at exit
- $112,610
- IRR
- 24.8%
- Equity multiple
- 7.40×
- Total profit
- $223,837
- Equity at exit
- $242,848
Cash invested: $35,000 (down + closing). Projections, not guarantees.
Landlord ↔ Tenant lean methodology
- Overall (STATE)
- 85 Strongly Landlord-Friendly
- State North Carolina
- 85 Strongly Landlord-Friendly · R+3
- County
- — inherits STATE
- City
- — inherits STATE
ZIP-level market 27371
- Home prices YoY
- 13.6%
- Active inventory
- 48
- Price-to-rent
- 9.1×
Monthly cashflow live
- Estimated rent
- $1,146 medium interval (Pro) →
- Mortgage (P&I)
- −$656
- Tax from tax record
- −$26 /mo · $307/yr
- Insurance
- −$52
- HOA
- −$0
- Vacancy / Maint / Mgmt
- −$241
- Net cashflow
- $172
Break-even live
UW: 25.0% down · 7.5% · 30yr · 1.5% tax · 5.0% vac · 8.0% maint · 8.0% mgmt
Financing live
Cash to close
- Down payment
- $31,250
- Closing costs
- $3,750
- Reserves months
- —
- Total cash needed
- —
Loan-product check · same deal, 3 products live
Conventional
25% down · 7.5% · 30yr
- Down + closing
- —
- Monthly P&I
- —
- Monthly cashflow
- —
- DSCR
- —
- Eligible?
- —
Personal DTI + credit; lowest rate.
DSCR
20% down · 8.5% · 30yr
- Down + closing
- —
- Monthly P&I
- —
- Monthly cashflow
- —
- DSCR
- —
- Eligible?
- —
No personal income docs; deal must DSCR.
Hard money
10% down · 12.0% · 12mo
- Down + closing
- —
- Monthly P&I
- —
- Monthly cashflow
- —
- DSCR
- —
- Eligible?
- —
Short-term bridge; refi at stabilization.
Listing history 4 events
-
2026-05-14status Pending
-
2026-05-05status Active
-
2026-04-07status Pending
-
2026-01-30$125,000 Active
ⓘ Source: listings_history table (triggers on properties + properties_extension) + one-shot
backfill from property_details.listing_events for pre-trigger history.
Tax reassessment forecast NC · Resets to sale price
- Current annual tax
- $307 · $26/mo
- Projected year-2 tax
- $1,025 · $85/mo
- Expected delta
- +$718/yr (+$60/mo · 234.4%)
ⓘ Screening estimate from a state-policy table — verify with the county assessor before closing.
Climate risk First Street
- Flood 1/10 Low FEMA zone X (unshaded) · 0% chance over 30 yrs
- Wildfire 3/10 Moderate
- Heat 6/10 Major 7 d/yr ≥107°F today · 16 d/yr by 30 yrs out
- Wind 6/10 Major 27% chance of damaging wind over 30 yrs
- Air quality 2/10 Low 0 unhealthy d/yr today · 1 by 30 yrs out
Nearby sold comps map
Loading sold comps map…
Walkable amenities ~0.75 mi
Loading nearby amenities…
Taxation est. · year 1
- Rental income
- $13,752
- − Mortgage interest
- −$7,002
- − Property taxes
- −$307
- − Insurance
- −$625
- − Repairs & maintenance
- −$1,100
- − Management
- −$1,100
- − Depreciation
- −$3,636
- Taxable loss
- −$19
- Est. tax savings @ 24.0%
- +$4
- After-tax cash flow
- $2,070/yr
For passive investors: Depreciation is non-cash, so a rental often shows a tax loss while cash-flowing — sheltering income. Rental losses are passive: they offset passive income freely, and up to $25,000/yr can offset ordinary (W-2) income if you actively participate and your MAGI is under $100k (phasing out to $0 by $150k); unused losses carry forward. On sale, claimed depreciation is recaptured at up to 25%, and gains may owe capital-gains tax (a 1031 exchange can defer both). Figures are a year-1 estimate at your 24.0% rate — not tax advice; consult a CPA.
Schools (NCES district)
- District
- Montgomery County Schools
- NCES district ID
- 3703060
- Math proficiency
- 29% ▼ -6.00%
- Reading proficiency
- 34% ▼ -2.00%
- Median HH income
- $34,706
- Composite
- 25.97/100
- National rank
- #7328
- State rank
- #143 of 178 in NC
Livability — Troy
- Score
- 68/100
- State rank
- #181
- US rank
- #9235
Category grades
Schools grade is shown separately in the Schools card above.
Census & demographics
- Census place
- Troy, NC
- Population (ZIP)
- 7,842
Population outlook (Montgomery County) Hauer SSP2
- Today (2025)
- 26,533 people
- By 2030
- 25,724 · -3.0%
- By 2040
- 23,842 · -10.1%
- By 2050
- 22,077 · -16.8%
- By 2075
- 18,754 · -29.3%
- By 2100
- 15,537 · -41.4%
Race, ethnicity, and origin ACS 2023
- Neighborhood character
- Predominantly White (76%)
- Race & ethnicity
- White 76% Black 14% Hispanic / Latino 7% Two or more races 5%
- Hispanic origin (detail)
- Mexican 4%
- Common ancestry
- Serbian 2% Italian 2% Slovak 2%
- Foreign-born
- 5% · Canada
- Languages at home
- 90% English-only · Spanish 7% French/Haitian/Cajun 1% Chinese 1%
Political lean MEDSL · Montgomery
- 2024 margin
- Solid R (+37.8) · D 30.8% · R 68.6%
- 2008→2024 swing
- -26.9pp toward R · 2008: -11.0pp · 2024: -37.8pp
- All cycles
- 2024: R+37.8 2020: R+31.8 2016: R+25.9 2012: R+15.2 2008: R+11.0
Not yet ingested
- Civics
- —
Market trends
- HPI YoY
- ▲ 39.24%
- Current HPI
- 328.2084
- Rent YoY
- —
- Metro
- —
- State GDP YoY
- ▲ 3.28%
- F500 in state
- 26
Industry mix (Fortune 500 HQ in NC)
| Industry | F500 HQs | Revenue |
|---|---|---|
| Financial Services | 2 | $213B |
|
||
| Retail | 2 | $95B |
|
||
| Industrial Conglomerate | 1 | $38B |
|
||
| Metals / Steel | 1 | $35B |
|
||
| Utilities | 1 | $30B |
|
||
| Industrial Machinery | 1 | $19B |
|
||
Price history
4 events — show timeline
- 2026-05-14 Pending — CANOPYMLS as Distributed by MLS Grid
- 2026-05-05 Relisted — CANOPYMLS as Distributed by MLS Grid
- 2026-04-07 Pending — CANOPYMLS as Distributed by MLS Grid
- 2026-01-30 Listed $125,000 CANOPYMLS as Distributed by MLS Grid
Property tax history
-0.1%/yrLatest (2025): $307 · +0.0% YoY. Source: county tax records.
Cash-flow waterfall
monthlySold comps — $/sqft
last 12 mo · ≤1 miLoading sold comps…