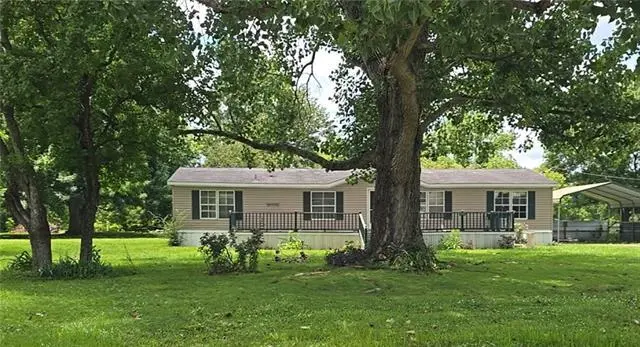
272 Eagle St · Minorca, LA
Flood risk 1/10 · Minimal
- FEMA flood zone
- X (shaded)
- Chance of flooding over 30 yrs
- 0.0%
- Est. flood insurance / yr
- $507 – $1,088
Fire risk 1/10 · Minimal
- Est. fire insurance / yr
- $1,269 – $2,357
Heat risk 8/10 · Major
- Hot days now (above 108°F)
- 7 days/yr
- Hot days in 30 yrs
- 19 days/yr
Wind risk 8/10 · Major
- Chance of severe wind over 30 yrs
- 93.0%
Air-quality risk 1/10 · Minimal
- Unhealthy air days now
- 0 days/yr
- Unhealthy air days in 30 yrs
- 0 days/yr
Risk factors via First Street. Map © Google.
Why this score? — see what drove the C- grade
The composite is a weighted blend of 9 inputs, each scored 0–100. Each bar is that input's sub-score; the figure is the points it added to the 100-point composite (weight × sub-score).
- Cash flow +15.0/30.0
- Appreciation +8.5/10.0
- ARV discount +7.5/15.0
- 1% rule +5.0/10.0
- DSCR +5.0/10.0
- Livability +3.1/5.0
- Rent growth +2.5/5.0
- Condition / age +2.5/5.0
- Schools +1.8/10.0
$24,900
🖨 Deal sheet 📄 Offer letter ✓ Due diligence
Listing remarks
This home sets on 1.06 ac lot a great country setting close to town. Large 3 bedroom 2 bath home with large deck on front, 2 carport detached, storage shed in back. Bring your tools home does need repairs. Due to condition no financing is available. At this list price you can remove the old home and bring in your new home.
Key facts
- 1.06 acre lot
- Garage
- Built 1999
Property features AI
Exterior
- Parking: Carport; Detached parking
- Utilities: Electric service: Entergy
- Home design: Manufactured home
- Construction: Vinyl siding construction; Composition roof
- Exterior features: Vinyl siding; Composition roof; Workshop on the property; No fencing indicated; Acreage
Interior
- Bedrooms: Three bedrooms (listed as Bedroom 1, Bedroom 2, Bedroom 3)
- Bathrooms: Two full bathrooms
- Heating & cooling: Central heating; Central air conditioning; Wood-burning fireplace
- Interior features: Living room; Kitchen; Bedroom 1; Bedroom 2; Bedroom 3
Neighborhood map
What this means for you Summary
Snapshot
- This is a 3-bed/2.0-bath manufactured listed at $25k.
Deal economics
- At list price, monthly cash flow is $763 ($9k/yr) — positive.
- The deal already cash-flows at list — no discount required.
- Meets the 1% rule at list price ($1k rent vs $25k).
Location & tenants
- Location reads 62/100 on livability (#221 in LA) — a middle-class / working-renter tenant base. Strengths: cost of living A+, housing A+, crime B+; Watch: health & safety C-, schools F, amenities F.
- Concordia Parish (town): math 19% / reading 27% proficiency, ranked #65 of 98 in LA (top 66%) — low school quality limits family demand, transient renter base, plan for 1-2y turnover; 74% free/reduced lunch — lower-income household profile, screen leases tightly.
- Market conditions: 40 active listings in the ZIP; 27 units permitted in Concordia Parish in 2024 (0 in 5+ unit buildings).
Forward outlook
- In year one you build about $2k of equity ($172 loan paydown + $2k appreciation (7.0% local appreciation)).
- Concordia County population projected at -20% by 2050 — secular population decline; favor cash flow + early exit over multi-decade hold.
- At projected returns (7.0% appreciation + 3.0% rent growth), your $7k cash investment doubles in ~1 year — after that, you're playing with house money.
Negotiation context
- Only 13 days on market — expect competitive offers; lowballing is unlikely to land.
Risks & watch-outs
- Watch-outs: property tax is 2.5% of price.
- Climate carrying-cost: severe wind risk, 93% chance of damaging wind over 30y; extreme-heat days projected 7→19/yr by 2055 (HVAC capex compounding) — expect insurance premiums to compound above CPI over the hold.
Questions for the listing agent
- Property tax is high relative to price — has the assessment been appealed recently, and will the sale trigger a re-assessment?
- Is there a deadline driving the sale (1031 exchange, divorce, estate, relocation)? That informs how much negotiation room exists.
- Schools are F-rated, which usually means shorter tenancies and higher turnover. Who's the typical renter profile here, and what's been the actual vacancy rate?
- What's the average days-on-market for RENTAL listings here right now (not sales)? A rising rental-DOM trend means longer vacancies and softer asking-rent achievability than the comps imply.
- What's the recent tenant-quality profile in this submarket — average credit score on applications, eviction rate, late-payment / NSF rate, and stable-employment percentage? A property-management company in the area should have these aggregated.
- How much new for-sale + rental construction is in the pipeline within 1–3 miles? Heavy new supply typically softens prices + rents 12–24 months out; constrained supply supports both.
Investment metrics
- 1% rule
- 4.86% ✓
- Cap rate
- 43.04%
- Cash-on-cash
- 131.24%
- DSCR
- 6.84
- GRM
- 1.7
CMA / ARV
No comps found within radius.
Projected returns pro-forma
6.97% appreciation · 3.0% rent growth · sell at horizon
- IRR
- —
- Equity multiple
- 9.21×
- Total profit
- $57,250
- Equity at exit
- $17,211
- IRR
- —
- Equity multiple
- 19.67×
- Total profit
- $130,135
- Equity at exit
- $32,654
Cash invested: $6,972 (down + closing). Projections, not guarantees.
Landlord ↔ Tenant lean methodology
- Overall (STATE)
- 90 Strongly Landlord-Friendly
- State Louisiana
- 90 Strongly Landlord-Friendly · R+12
- County
- — inherits STATE
- City
- — inherits STATE
ZIP-level market 71373
- Home prices YoY
- 6.3%
- Active inventory
- 40
- Price-to-rent
- 1.7×
Monthly cashflow live
- Estimated rent
- $1,210 medium interval (Pro) →
- Mortgage (P&I)
- −$131
- Tax from tax record
- −$52 /mo · $627/yr
- Insurance
- −$10
- HOA
- −$0
- Vacancy / Maint / Mgmt
- −$254
- Net cashflow
- $763
Break-even live
UW: 25.0% down · 7.5% · 30yr · 1.5% tax · 5.0% vac · 8.0% maint · 8.0% mgmt
Financing live
Cash to close
- Down payment
- $6,225
- Closing costs
- $747
- Reserves months
- —
- Total cash needed
- —
Loan-product check · same deal, 3 products live
Conventional
25% down · 7.5% · 30yr
- Down + closing
- —
- Monthly P&I
- —
- Monthly cashflow
- —
- DSCR
- —
- Eligible?
- —
Personal DTI + credit; lowest rate.
DSCR
20% down · 8.5% · 30yr
- Down + closing
- —
- Monthly P&I
- —
- Monthly cashflow
- —
- DSCR
- —
- Eligible?
- —
No personal income docs; deal must DSCR.
Hard money
10% down · 12.0% · 12mo
- Down + closing
- —
- Monthly P&I
- —
- Monthly cashflow
- —
- DSCR
- —
- Eligible?
- —
Short-term bridge; refi at stabilization.
Listing history 11 events
-
2026-06-18status $24,900 Pending 13 DOM
-
2026-06-17days on market $24,900 Active 13 DOM
-
2026-06-16days on market $24,900 Active 12 DOM
-
2026-06-15days on market $24,900 Active 11 DOM
-
2026-06-13days on market $24,900 Active 9 DOM
-
2026-06-12days on market $24,900 Active 8 DOM
-
2026-06-09days on market $24,900 Active 5 DOM
-
2026-06-08days on market $24,900 Active 4 DOM
-
2026-06-07days on market $24,900 Active 3 DOM
-
2026-06-07remarks 324-char remark
-
2026-06-07$24,900 Active 2 DOM
ⓘ Source: listings_history table (triggers on properties + properties_extension) + one-shot
backfill from property_details.listing_events for pre-trigger history.
Tax reassessment forecast LA · Resets to sale price
- Current annual tax
- $627 · $52/mo
- Projected year-2 tax
- $627 · $52/mo
- Expected delta
- $0/yr ($0/mo · 0.0%)
ⓘ Screening estimate from a state-policy table — verify with the county assessor before closing.
Climate risk First Street
- Flood 1/10 Low FEMA zone X (shaded) · 0% chance over 30 yrs
- Wildfire 1/10 Low
- Heat 8/10 Severe 7 d/yr ≥108°F today · 19 d/yr by 30 yrs out
- Wind 8/10 Severe 93% chance of damaging wind over 30 yrs
- Air quality 1/10 Low 0 unhealthy d/yr today · 0 by 30 yrs out
Nearby sold comps map
Loading sold comps map…
Walkable amenities ~0.75 mi
Loading nearby amenities…
Taxation est. · year 1
- Rental income
- $14,517
- − Mortgage interest
- −$1,395
- − Property taxes
- −$627
- − Insurance
- −$124
- − Repairs & maintenance
- −$1,161
- − Management
- −$1,161
- − Depreciation
- −$724
- Taxable income
- $9,324
- Est. tax owed @ 24.0%
- −$2,238
- After-tax cash flow
- $6,912/yr
For passive investors: Depreciation is non-cash, so a rental often shows a tax loss while cash-flowing — sheltering income. Rental losses are passive: they offset passive income freely, and up to $25,000/yr can offset ordinary (W-2) income if you actively participate and your MAGI is under $100k (phasing out to $0 by $150k); unused losses carry forward. On sale, claimed depreciation is recaptured at up to 25%, and gains may owe capital-gains tax (a 1031 exchange can defer both). Figures are a year-1 estimate at your 24.0% rate — not tax advice; consult a CPA.
Schools (NCES district)
- District
- Concordia Parish
- NCES district ID
- 2200480
- Math proficiency
- 19% ▼ -39.00%
- Reading proficiency
- 27% ▼ -34.00%
- Median HH income
- $29,931
- Composite
- 18.45/100
- National rank
- #8929
- State rank
- #65 of 98 in LA
Livability — Minorca
- Score
- 62/100
- State rank
- #221
- US rank
- #16991
Category grades
Schools grade is shown separately in the Schools card above.
Census & demographics
- Census place
- Minorca, LA
- Population (ZIP)
- 5,754
Population outlook (Concordia County) Hauer SSP2
- Today (2025)
- 18,933 people
- By 2030
- 18,157 · -4.1%
- By 2040
- 16,559 · -12.5%
- By 2050
- 15,067 · -20.4%
- By 2075
- 11,770 · -37.8%
- By 2100
- 8,541 · -54.9%
Race, ethnicity, and origin ACS 2023
- Neighborhood character
- Predominantly White (74%)
- Race & ethnicity
- White 74% Black 24% Hispanic / Latino 1%
- Common ancestry
- Lithuanian 2% Slovak 1%
- Foreign-born
- 1% · Canada
- Languages at home
- 98% English-only · Spanish 1% French/Haitian/Cajun 1%
Political lean MEDSL · Concordia
- 2024 margin
- Strong R (+29.4) · D 34.8% · R 64.1% · Other 1.1%
- 2008→2024 swing
- -9.4pp toward R · 2008: -20.0pp · 2024: -29.4pp
- All cycles
- 2024: R+29.4 2020: R+26.9 2016: R+24.8 2012: R+17.2 2008: R+20.0
Not yet ingested
- Civics
- —
Market trends
- HPI YoY
- ▲ 6.97%
- Current HPI
- 117.3895
- Rent YoY
- —
- Metro
- —
- State GDP YoY
- ▲ 3.29%
- F500 in state
- 10
Industry mix (Fortune 500 HQ in LA)
| Industry | F500 HQs | Revenue |
|---|---|---|
| Telecommunications | 2 | $23B |
|
||
| Utilities | 1 | $12B |
|
||
| Wholesale / Distribution | 1 | $5B |
|
||
| Advertising | 1 | $2B |
|
||
Price history
1 event — show timeline
- 2026-06-04 Listed $24,900 AcadianaMLS
Property tax history
+0.2%/yrLatest (2025): $627 · +0.5% YoY. Source: county tax records.
Cash-flow waterfall
monthlySold comps — $/sqft
last 12 mo · ≤1 miLoading sold comps…