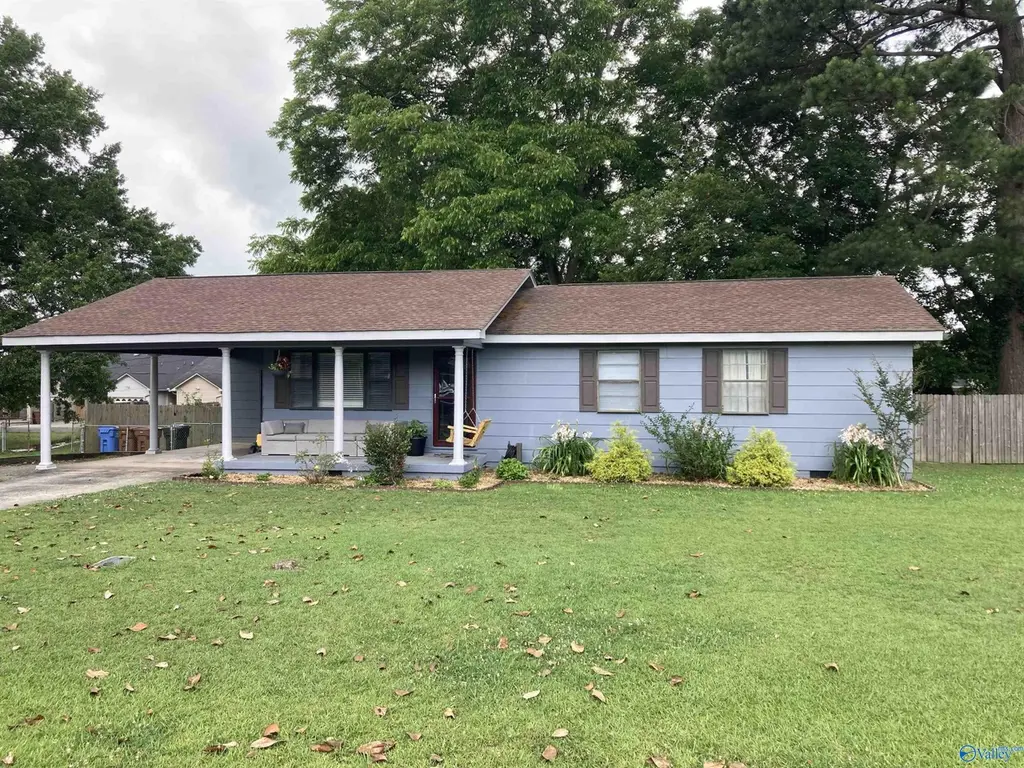
1311 SW Elizabeth Dr SW · Hartselle, AL
Flood risk 1/10 · Minimal
- FEMA flood zone
- X (unshaded)
- Chance of flooding over 30 yrs
- 0.0%
- Est. flood insurance / yr
- $507 – $1,088
Fire risk 4/10 · Minor
- Est. fire insurance / yr
- $916 – $1,700
Heat risk 6/10 · Moderate
- Hot days now (above 105°F)
- 7 days/yr
- Hot days in 30 yrs
- 21 days/yr
Wind risk 5/10 · Moderate
- Chance of severe wind over 30 yrs
- 26.0%
Air-quality risk 2/10 · Minimal
- Unhealthy air days now
- 1 days/yr
- Unhealthy air days in 30 yrs
- 1 days/yr
Risk factors via First Street. Map © Google.
Why this score? — see what drove the D grade
The composite is a weighted blend of 9 inputs, each scored 0–100. Each bar is that input's sub-score; the figure is the points it added to the 100-point composite (weight × sub-score).
- Cash flow +15.3/30.0
- ARV discount +8.4/15.0
- DSCR +4.7/10.0
- Schools +4.5/10.0
- Livability +3.6/5.0
- 1% rule +2.9/10.0
- Rent growth +2.5/5.0
- Condition / age +2.5/5.0
- Appreciation +0.0/10.0
$182,000
🖨 Deal sheet (PDF) 📄 Offer letter ✓ Due diligence
Listing remarks MLS
MOVE-IN READY HOME W/ UPDATES!!! 1311 Elizabeth Dr is now ready for a new owner. Covered front porch and covered carport allows easy unloading out of the weather. Hardwood flooring through most of home. New flooring in Kitchen and baths too! Fresh Paint in most rooms! Large kitchen w/ space for a large Dining Room Table as well! All Bedrooms are very Spacious. Fenced in Back Yard w/ landscaping all around. Great Location inside Hartselle City Schools!!!
Key facts
- Fenced back yard
- Spacious dining room
- 0.34 acre lot
Tags
Property features AI
Finance
- Other: Directions: On Hwy 31 South Hartselle, turn right on Nanceford Road, right on Mitweed St, right on Elizabeth; house on left.
- HOA & community: No homeowners association; Subdivision: Crestline Heights
Exterior
- Parking: Attached carport
- Utilities: Public water; Public sewer
- Home design: Single-family residence; One story; Built in 1966; Living area about 1,148 square feet
- Construction: No new construction
- Exterior features: Treed lot; Concrete driveway
Interior
- Kitchen: Range; Dishwasher drawer
- Bathrooms: One full bathroom; One half bathroom
- Heating & cooling: Central heating (gas); Central electric cooling
- Interior features: Five total rooms; Crawl space basement
- Laundry & utility: Gas water heater
Neighborhood map
What this means for you Summary
Snapshot
- This is a 3-bed/1.0-bath single-family listed at $182k.
Deal economics
- At list price, monthly cash flow is $66 ($786/yr) — positive.
- The deal already cash-flows at list — no discount required.
- To meet the 1% rule (rent ≥ 1% of price), the offer needs to be $143k (21.4% below list).
- Recommended offer: $143k (21.4% below list) — sets the bar for 1% rule.
- Cap rate 6.7% vs local median 4.0% in Hartselle — top-decile yield for the area; either an underpriced asset or a hidden risk that comps aren't pricing in. Stress-test before assuming the spread holds.
Location & tenants
- Location reads 72/100 on livability (#32 in AL) — a middle-class / working-renter tenant base. Strengths: cost of living A+, housing A+, health & safety A+; Watch: amenities F, commute F.
- Hartselle City (other): math 41% / reading 64% proficiency, ranked #10 of 129 in AL (top 8%) — acceptable for families but not a draw, mixed tenant base, ~2y average lease.
- Zoned schools: Crestline Elementary School (math 32% / reading 57%, grade F, #171 of 627 statewide, top 31%, 550 students, 49% FRL); Hartselle Junior High School (math 33% / reading 63%, grade C-, #29 of 257 statewide, top 12%, 527 students, 38% FRL); Hartselle High School (math 44% / reading 48%, grade D-, #18 of 305 statewide, top 6%, 1,031 students, 34% FRL) — zoned schools average 40% FRL vs 25% district-wide (16 pts higher); higher-poverty schools than district average — tighter screening recommended.
- Market conditions: 193 active listings in the ZIP; 2 comparable units currently listed for rent nearby; 231 units permitted in Morgan County in 2024 (0 in 5+ unit buildings).
Forward outlook
- Local home prices are declining (-3.0%/yr); year-one equity from $1k of loan paydown is wiped out by about $5k of value loss. Plan a longer hold.
- Morgan County population projected at -11% by 2050 — secular population decline; favor cash flow + early exit over multi-decade hold.
Negotiation context
- Only 8 days on market — expect competitive offers; lowballing is unlikely to land.
- 2 sale attempts since 11y ago with the ask held roughly flat each time — persistent listings suggest the price (not the market) is what's stuck; bring a comps-based counter.
- Current owner paid $79k; list at $182k implies a 130% gain — meaningful room to come down on a strong offer.
Risks & watch-outs
- Climate carrying-cost: moderate wind risk, 26% chance of damaging wind over 30y; extreme-heat days projected 7→21/yr by 2055 (HVAC capex compounding) — expect insurance premiums to compound above CPI over the hold.
Questions for the listing agent
- Built in 1966 — when were the roof, HVAC, electrical panel, plumbing, and water heater last replaced?
- Is there a deadline driving the sale (1031 exchange, divorce, estate, relocation)? That informs how much negotiation room exists.
- The area grade is low — what's the realistic commute time and amenity access for the typical tenant pool here? Any planned neighborhood developments (good or bad) we should know about?
- What's the average days-on-market for RENTAL listings here right now (not sales)? A rising rental-DOM trend means longer vacancies and softer asking-rent achievability than the comps imply.
- What's the recent tenant-quality profile in this submarket — average credit score on applications, eviction rate, late-payment / NSF rate, and stable-employment percentage? A property-management company in the area should have these aggregated.
- How much new for-sale + rental construction is in the pipeline within 1–3 miles? Heavy new supply typically softens prices + rents 12–24 months out; constrained supply supports both.
Investment metrics
- 1% rule
- 0.79% ✗
- Cap rate
- 6.73%
- Cash-on-cash
- 1.54%
- DSCR
- 1.07
- GRM
- 10.6
CMA / ARV
- ARV (on-the-fly)
- $185,900
- Comps found
- 12
Show comp detail 12 sales within ~0.75 mi
| Address | Dist | Beds/Ba | Sqft | Sold | Price | $/sf | Match |
|---|---|---|---|---|---|---|---|
| 1211 Gemini Cir | 0.18mi | 3/1.0 | 1,100 (0%) | 3mo | $190,000 | $173 | 89 |
| 812 Mitwede St SW | 0.18mi | 3/1.5 | 1,178 (+7%) | 9mo | $158,000 | $134 | 70 |
| 811 Sunshine St SW | 0.15mi | 3/2.0 | 1,200 (+9%) | 6mo | $205,000 | $171 | 69 |
| 758 Morris St SW | 0.33mi | 3/1.0 | 1,050 (-4%) | 12mo | $155,000 | $148 | 67 |
| 915 SW Pattillo St | 0.52mi | 3/1.0 | 1,050 (-4%) | 5mo | $190,000 | $181 | 64 |
| 1613 Vest St SW | 0.35mi | 3/2.0 | 1,131 (+3%) | 13mo | $200,000 | $177 | 64 |
| 742 Williams St SW | 0.56mi | 3/2.0 | 1,127 (+2%) | 3mo | $160,000 | $142 | 63 |
| 1004 Crestline Pl | 0.20mi | 3/2.0 | 1,206 (+10%) | 12mo | $139,900 | $116 | 61 |
| 500 Nelson St SW | 0.62mi | 2/1.0 (-1) | 1,056 (-4%) | 2mo | $178,000 | $169 | 58 |
| 756 SW Morris St SW | 0.34mi | 3/1.0 | 1,248 (+14%) | 5mo | $159,900 | $128 | 57 |
| 823 Nance Ford Rd | 0.19mi | 3/2.0 | 1,252 (+14%) | 9mo | $199,000 | $159 | 57 |
| 717 SW Larkwood Cir SW | 0.39mi | 3/2.0 | 1,248 (+14%) | 4mo | $230,000 | $184 | 52 |
Match score weights: distance 35% · size 25% · config 20% · recency 20%. Top-matched comps best support the ARV.
Projected returns pro-forma
-3.0% appreciation · 3.0% rent growth · sell at horizon
- IRR
- -13.9%
- Equity multiple
- 0.50×
- Total profit
- $-25,415
- Equity at exit
- $27,137
- IRR
- -5.2%
- Equity multiple
- 0.66×
- Total profit
- $-17,153
- Equity at exit
- $15,736
Cash invested: $50,960 (down + closing). Projections, not guarantees.
Landlord ↔ Tenant lean methodology
- Overall (STATE)
- 90 Strongly Landlord-Friendly
- State Alabama
- 90 Strongly Landlord-Friendly · R+15
- County
- — inherits STATE
- City
- — inherits STATE
ZIP-level market 35640
- Home prices YoY
- -13.6%
- Active inventory
- 193
- Price-to-rent
- 10.6×
Monthly cashflow live
- Estimated rent
- $1,430 medium interval (Pro) →
- Mortgage (P&I)
- −$954
- Tax from tax record
- −$34 /mo · $406/yr
- Insurance
- −$76
- HOA
- −$0
- Vacancy / Maint / Mgmt
- −$300
- Net cashflow
- $66
Break-even live
Sensitivity live
| Price | -10% $169 | -5% $117 | +0% $66 | +5% $14 | +10% $-37 |
|---|---|---|---|---|---|
| Rent | -10% $-47 | -5% $9 | +0% $66 | +5% $122 | +10% $178 |
| Rate | -1.0pp $157 | -0.5pp $112 | base $66 | +0.5pp $18 | +1.0pp $-30 |
UW: 25.0% down · 7.5% · 30yr · 1.5% tax · 5.0% vac · 8.0% maint · 8.0% mgmt
Financing live
Cash to close
- Down payment
- $45,500
- Closing costs
- $5,460
- Reserves months
- —
- Total cash needed
- —
Loan-product check · same deal, 3 products live
Conventional
25% down · 7.5% · 30yr
- Down + closing
- —
- Monthly P&I
- —
- Monthly cashflow
- —
- DSCR
- —
- Eligible?
- —
Personal DTI + credit; lowest rate.
DSCR
20% down · 8.5% · 30yr
- Down + closing
- —
- Monthly P&I
- —
- Monthly cashflow
- —
- DSCR
- —
- Eligible?
- —
No personal income docs; deal must DSCR.
Hard money
10% down · 12.0% · 12mo
- Down + closing
- —
- Monthly P&I
- —
- Monthly cashflow
- —
- DSCR
- —
- Eligible?
- —
Short-term bridge; refi at stabilization.
Rent comps 2 comps
| Address | Beds | Baths | Sqft | Rent | $/sqft | DOM | Units | Dist |
|---|---|---|---|---|---|---|---|---|
| 726 Larkwood Cir SW Hartselle, AL | 3.0 | 2.0 | 1257 | $1,400 | $1.11 | 45d | 1 | 0.30mi |
| 500 Crestline Dr SW Hartselle, AL | 3.0 | 2.0 | 1420 | $1,500 | $1.06 | 16d | 1 | 0.62mi |
Listing history 8 events
-
2026-06-09days on market $182,000 Active 8 DOM
-
2026-06-08days on market $182,000 Active 7 DOM
-
2026-06-07days on market $182,000 Active 6 DOM
-
2026-06-07days on market $182,000 Active 5 DOM
-
2026-06-04days on market $182,000 Active 2 DOM
-
2026-06-02remarks 589-char remark
-
2026-06-01remarks 567-char remark
-
2026-06-01$182,000 Active 1 DOM
ⓘ Source: listings_history table (triggers on properties + properties_extension) + one-shot
backfill from property_details.listing_events for pre-trigger history.
Tax reassessment forecast AL · Resets to sale price
- Current annual tax
- $406 · $34/mo
- Projected year-2 tax
- $746 · $62/mo
- Expected delta
- +$340/yr (+$28/mo · 83.9%)
ⓘ Screening estimate from a state-policy table — verify with the county assessor before closing.
Climate risk First Street
- Flood 1/10 Low FEMA zone X (unshaded) · 0% chance over 30 yrs
- Wildfire 4/10 Moderate
- Heat 6/10 Major 7 d/yr ≥105°F today · 21 d/yr by 30 yrs out
- Wind 5/10 Major 26% chance of damaging wind over 30 yrs
- Air quality 2/10 Low 1 unhealthy d/yr today · 1 by 30 yrs out
Nearby sold comps map
Loading sold comps map…
Walkable amenities ~0.75 mi
Loading nearby amenities…
Taxation est. · year 1
- Rental income
- $17,159
- − Mortgage interest
- −$10,195
- − Property taxes
- −$406
- − Insurance
- −$910
- − Repairs & maintenance
- −$1,373
- − Management
- −$1,373
- − Depreciation
- −$5,295
- Taxable loss
- −$2,392
- Est. tax savings @ 24.0%
- +$574
- After-tax cash flow
- $1,360/yr
For passive investors: Depreciation is non-cash, so a rental often shows a tax loss while cash-flowing — sheltering income. Rental losses are passive: they offset passive income freely, and up to $25,000/yr can offset ordinary (W-2) income if you actively participate and your MAGI is under $100k (phasing out to $0 by $150k); unused losses carry forward. On sale, claimed depreciation is recaptured at up to 25%, and gains may owe capital-gains tax (a 1031 exchange can defer both). Figures are a year-1 estimate at your 24.0% rate — not tax advice; consult a CPA.
Schools (NCES district)
- District
- Hartselle City
- NCES district ID
- 0101730
- Math proficiency
- 41% ▼ -25.00%
- Reading proficiency
- 64% ▼ -1.00%
- Median HH income
- $51,169
- Composite
- 44.88/100
- National rank
- #2717
- State rank
- #10 of 129 in AL
Livability — Hartselle
- Score
- 72/100
- State rank
- #32
- US rank
- #6515
Category grades
Schools grade is shown separately in the Schools card above.
Census & demographics
- Census place
- Hartselle, AL
- City population
- 26,976
- Population (ZIP)
- 26,976
Population outlook (Morgan County) Hauer SSP2
- Today (2025)
- 118,775 people
- By 2030
- 116,979 · -1.5%
- By 2040
- 111,800 · -5.9%
- By 2050
- 105,181 · -11.4%
- By 2075
- 87,736 · -26.1%
- By 2100
- 67,624 · -43.1%
Race, ethnicity, and origin ACS 2023
- Neighborhood character
- Predominantly White (89%)
- Race & ethnicity
- White 89% Black 5% Two or more races 4% Hispanic / Latino 2%
- Common ancestry
- Slovak 3% Italian 2% Lithuanian 1%
- Foreign-born
- 1% · Canada
- Languages at home
- 98% English-only · Spanish 2%
Political lean MEDSL · Morgan
- 2024 margin
- Solid R (+52.6) · D 23.2% · R 75.8%
- 2008→2024 swing
- -8.8pp toward R · 2008: -43.8pp · 2024: -52.6pp
- All cycles
- 2024: R+52.6 2020: R+49.2 2016: R+52.4 2012: R+44.5 2008: R+43.8
Not yet ingested
- Civics
- —
Market trends
- HPI YoY
- ▼ -38.12%
- Current HPI
- 242.5778
- Rent YoY
- —
- Metro
- —
- State GDP YoY
- ▲ 2.94%
- F500 in state
- 4
Industry mix (Fortune 500 HQ in AL)
| Industry | F500 HQs | Revenue |
|---|---|---|
| Financial Services | 1 | $8B |
|
||
| Healthcare | 1 | $5B |
|
||
Price history
+219.3% since first listed5 events — show timeline
- 2026-06-01 Listed $182,000 VMLS
- 2016-09-13 Sold (Public Records) $78,970 Public Records
- 2016-09-09 Sold (MLS) $78,900 VMLS
- 2015-08-19 Listed $79,000 VMLS
- 2002-06-14 Sold (Public Records) $57,000 Public Records
Property tax history
+5.5%/yrLatest (2025): $406 · +13.3% YoY. Source: county tax records.
Cash-flow waterfall
monthlySold comps — $/sqft
last 12 mo · ≤1 miLoading sold comps…