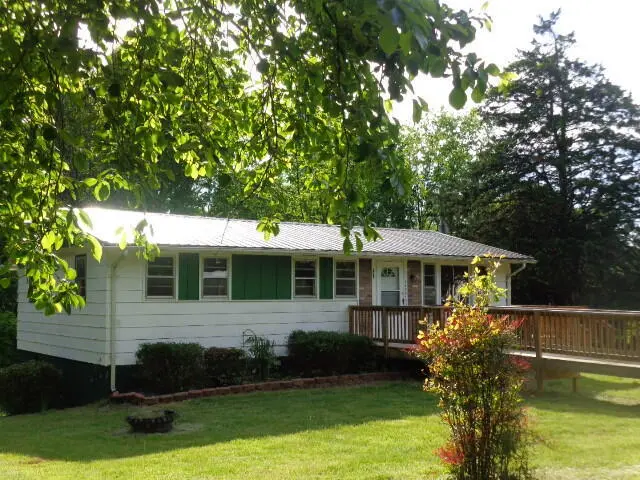
497 The Pines Ln · Arrington, VA
Flood risk 1/10 · Minimal
- FEMA flood zone
- X (unshaded)
- Chance of flooding over 30 yrs
- 0.0%
- Est. flood insurance / yr
- $473 – $860
Fire risk 3/10 · Minor
- Est. fire insurance / yr
- $666 – $1,236
Heat risk 5/10 · Moderate
- Hot days now (above 104°F)
- 7 days/yr
- Hot days in 30 yrs
- 17 days/yr
Wind risk 2/10 · Minimal
- Chance of severe wind over 30 yrs
- 2.0%
Air-quality risk 1/10 · Minimal
- Unhealthy air days now
- 0 days/yr
- Unhealthy air days in 30 yrs
- 0 days/yr
Risk factors via First Street. Map © Google.
Why this score? — see what drove the C- grade
The composite is a weighted blend of 9 inputs, each scored 0–100. Each bar is that input's sub-score; the figure is the points it added to the 100-point composite (weight × sub-score).
- Cash flow +15.5/30.0
- ARV discount +7.5/15.0
- Appreciation +6.0/10.0
- DSCR +4.8/10.0
- Schools +4.4/10.0
- 1% rule +4.3/10.0
- Livability +3.5/5.0
- Rent growth +2.5/5.0
- Condition / age +2.5/5.0
$149,800
🖨 Deal sheet 📄 Offer letter ✓ Due diligence
Listing remarks
Ranch on Full Basement. Three Bedrooms and One Full Bath on Main Level. The Full Unfinished Basement with Interior and Exterior Access Offers Expansion Possibilities. Sitting on Just Under an Acre, 0.99 Acre Lot Size. RT 29 Access Conveniently Just ½ mile away.
Key facts
- Unfinished basement
- Full basement
- Acre lot size
Tags
Property features AI
Exterior
- Utilities: Private well water
- Home design: Single-family residential; Residential zoning
- Construction: Masonite siding; Metal roof
- Exterior features: Deck; Private maintained gravel road access
Interior
- Flooring: Vinyl flooring
- Bathrooms: 1 full bathroom
- Heating & cooling: Baseboard electric heating; Ceiling fan(s)
- Interior features: Electric water heater; Full unfinished walk-out basement
Neighborhood map
What this means for you Summary
Snapshot
- This is a 3-bed/1.0-bath single-family listed at $150k.
Deal economics
- At list price, monthly cash flow is $60 ($722/yr) — positive.
- The deal already cash-flows at list — no discount required.
- To meet the 1% rule (rent ≥ 1% of price), the offer needs to be $139k (7.4% below list).
- Recommended offer: $139k (7.4% below list) — sets the bar for 1% rule.
Location & tenants
- Location reads 70/100 on livability (#221 in VA) — a middle-class / working-renter tenant base. Strengths: employment A+, cost of living A+, housing B+; Watch: health & safety C-, amenities F, commute F.
- Nelson County Public School District (rural): math 42% / reading 62% proficiency, ranked #92 of 131 in VA (top 70%) — acceptable for families but not a draw, mixed tenant base, ~2y average lease.
- Zoned schools: Tye River Elementary (math 27% / reading 52%, grade F, #900 of 1,108 statewide, top 83%, 355 students, 79% FRL); Nelson Middle (math 44% / reading 66%, grade B-, #189 of 342 statewide, top 56%, 340 students, 78% FRL); Nelson County High (math 57% / reading 82%, grade B, #159 of 319 statewide, top 53%, 517 students, 70% FRL) — zoned schools average 76% FRL vs 44% district-wide (31 pts higher); higher-poverty schools than district average — tighter screening recommended.
- Market conditions: 12 active listings in the ZIP; 66 units permitted in Nelson County in 2024 (0 in 5+ unit buildings).
Forward outlook
- In year one you build about $4k of equity ($1k loan paydown + $3k appreciation (1.9% local appreciation)).
- Nelson County population projected at -19% by 2050 — secular population decline; favor cash flow + early exit over multi-decade hold.
- At projected returns (1.9% appreciation + 3.0% rent growth), your $42k cash investment doubles in ~7 years — after that, you're playing with house money.
- By year 9, paydown + projected appreciation supports a ~$34k cash-out refi (75% LTV) — recoverable capital for the next deal without selling this one.
Negotiation context
- It's been on market 26 days — a 2% lower offer ($148k) is reasonable based on typical stale-listing flexibility.
Risks & watch-outs
- Climate carrying-cost: extreme-heat days projected 7→17/yr by 2055 (HVAC capex compounding) — expect insurance premiums to compound above CPI over the hold.
Questions for the listing agent
- Built in 1971 — when were the roof, HVAC, electrical panel, plumbing, and water heater last replaced?
- Is there a deadline driving the sale (1031 exchange, divorce, estate, relocation)? That informs how much negotiation room exists.
- Schools are B-rated — typically a magnet for longer-tenancy family renters. What's the average tenant stay here, and is there a school-zone premium baked into asking?
- What's the average days-on-market for RENTAL listings here right now (not sales)? A rising rental-DOM trend means longer vacancies and softer asking-rent achievability than the comps imply.
- What's the recent tenant-quality profile in this submarket — average credit score on applications, eviction rate, late-payment / NSF rate, and stable-employment percentage? A property-management company in the area should have these aggregated.
- How much new for-sale + rental construction is in the pipeline within 1–3 miles? Heavy new supply typically softens prices + rents 12–24 months out; constrained supply supports both.
Investment metrics
- 1% rule
- 0.93% ✗
- Cap rate
- 6.77%
- Cash-on-cash
- 1.72%
- DSCR
- 1.08
- GRM
- 9.0
CMA / ARV
No comps found within radius.
Projected returns pro-forma
1.93% appreciation · 3.0% rent growth · sell at horizon
- IRR
- 6.0%
- Equity multiple
- 1.32×
- Total profit
- $13,564
- Equity at exit
- $58,490
- IRR
- 9.5%
- Equity multiple
- 2.28×
- Total profit
- $53,807
- Equity at exit
- $83,771
Cash invested: $41,944 (down + closing). Projections, not guarantees.
Landlord ↔ Tenant lean methodology
- Overall (STATE)
- 55 Moderately Landlord-Leaning
- State Virginia
- 55 Moderately Landlord-Leaning · D+2
- County
- — inherits STATE
- City
- — inherits STATE
ZIP-level market 22922
- Home prices YoY
- 0.6%
- Active inventory
- 12
- Price-to-rent
- 9.0×
Monthly cashflow live
- Estimated rent
- $1,387 medium interval (Pro) →
- Mortgage (P&I)
- −$786
- Tax est. 1.5%
- −$187 /mo · $2,247/yr
- Insurance
- −$62
- HOA
- −$0
- Vacancy / Maint / Mgmt
- −$291
- Net cashflow
- $60
Break-even live
UW: 25.0% down · 7.5% · 30yr · 1.5% tax · 5.0% vac · 8.0% maint · 8.0% mgmt
Financing live
Cash to close
- Down payment
- $37,450
- Closing costs
- $4,494
- Reserves months
- —
- Total cash needed
- —
Loan-product check · same deal, 3 products live
Conventional
25% down · 7.5% · 30yr
- Down + closing
- —
- Monthly P&I
- —
- Monthly cashflow
- —
- DSCR
- —
- Eligible?
- —
Personal DTI + credit; lowest rate.
DSCR
20% down · 8.5% · 30yr
- Down + closing
- —
- Monthly P&I
- —
- Monthly cashflow
- —
- DSCR
- —
- Eligible?
- —
No personal income docs; deal must DSCR.
Hard money
10% down · 12.0% · 12mo
- Down + closing
- —
- Monthly P&I
- —
- Monthly cashflow
- —
- DSCR
- —
- Eligible?
- —
Short-term bridge; refi at stabilization.
Listing history 16 events
-
2026-06-18days on market $149,800 Active 26 DOM
-
2026-06-17days on market $149,800 Active 25 DOM
-
2026-06-16days on market $149,800 Active 24 DOM
-
2026-06-15days on market $149,800 Active 23 DOM
-
2026-06-15days on market $149,800 Active 22 DOM
-
2026-06-13days on market $149,800 Active 21 DOM
-
2026-06-12days on market $149,800 Active 20 DOM
-
2026-06-09days on market $149,800 Active 17 DOM
-
2026-06-08days on market $149,800 Active 16 DOM
-
2026-06-08days on market $149,800 Active 15 DOM
-
2026-06-07days on market $149,800 Active 14 DOM
-
2026-06-03days on market $149,800 Active 11 DOM
-
2026-06-02days on market $149,800 Active 10 DOM
-
2026-06-01days on market $149,800 Active 9 DOM
-
2026-05-31days on market $149,800 Active 8 DOM
-
2026-05-22$149,900 Active
ⓘ Source: listings_history table (triggers on properties + properties_extension) + one-shot
backfill from property_details.listing_events for pre-trigger history.
Climate risk First Street
- Flood 1/10 Low FEMA zone X (unshaded) · 0% chance over 30 yrs
- Wildfire 3/10 Moderate
- Heat 5/10 Major 7 d/yr ≥104°F today · 17 d/yr by 30 yrs out
- Wind 2/10 Low 2% chance of damaging wind over 30 yrs
- Air quality 1/10 Low 0 unhealthy d/yr today · 0 by 30 yrs out
Nearby sold comps map
Loading sold comps map…
Walkable amenities ~0.75 mi
Loading nearby amenities…
Taxation est. · year 1
- Rental income
- $16,639
- − Mortgage interest
- −$8,391
- − Property taxes
- −$2,247
- − Insurance
- −$749
- − Repairs & maintenance
- −$1,331
- − Management
- −$1,331
- − Depreciation
- −$4,358
- Taxable loss
- −$1,768
- Est. tax savings @ 24.0%
- +$424
- After-tax cash flow
- $1,146/yr
For passive investors: Depreciation is non-cash, so a rental often shows a tax loss while cash-flowing — sheltering income. Rental losses are passive: they offset passive income freely, and up to $25,000/yr can offset ordinary (W-2) income if you actively participate and your MAGI is under $100k (phasing out to $0 by $150k); unused losses carry forward. On sale, claimed depreciation is recaptured at up to 25%, and gains may owe capital-gains tax (a 1031 exchange can defer both). Figures are a year-1 estimate at your 24.0% rate — not tax advice; consult a CPA.
Schools (NCES district)
- District
- Nelson County Public School District
- NCES district ID
- 5102580
- Math proficiency
- 42% ▼ -45.00%
- Reading proficiency
- 62% ▼ -14.00%
- Median HH income
- $50,092
- Composite
- 44.37/100
- National rank
- #2818
- State rank
- #92 of 131 in VA
Livability — Arrington
- Score
- 70/100
- State rank
- #221
- US rank
- #7329
Category grades
Schools grade is shown separately in the Schools card above.
Census & demographics
- Population (ZIP)
- 2,255
Population outlook (Nelson County) Hauer SSP2
- Today (2025)
- 14,115 people
- By 2030
- 13,563 · -3.9%
- By 2040
- 12,384 · -12.3%
- By 2050
- 11,481 · -18.7%
- By 2075
- 10,103 · -28.4%
- By 2100
- 8,788 · -37.7%
Race, ethnicity, and origin ACS 2023
- Neighborhood character
- Predominantly White (67%)
- Race & ethnicity
- White 67% Black 20% Asian 10% Two or more races 3%
- Common ancestry
- Subsaharan African 3% Slovak 2% Serbian 2%
- Foreign-born
- 14% · China, Canada
- Languages at home
- 88% English-only · Chinese 11% French/Haitian/Cajun 1%
Political lean MEDSL · Nelson
- 2024 margin
- Lean R (+7.5) · D 45.8% · R 53.3%
- 2008→2024 swing
- -16.7pp toward R · 2008: 9.2pp · 2024: -7.5pp
- All cycles
- 2024: R+7.5 2020: R+5.2 2016: R+5.7 2012: D+2.8 2008: D+9.2
Not yet ingested
- Civics
- —
Market trends
- HPI YoY
- ▲ 1.93%
- Current HPI
- 346.6396
- Rent YoY
- —
- Metro
- —
- State GDP YoY
- ▲ 2.40%
- F500 in state
- 50
Industry mix (Fortune 500 HQ in VA)
| Industry | F500 HQs | Revenue |
|---|---|---|
| Aerospace / Defense | 4 | $236B |
|
||
| Technology / Defense | 3 | $32B |
|
||
| Financial Services | 2 | $176B |
|
||
| Utilities | 2 | $27B |
|
||
| Insurance | 2 | $25B |
|
||
| Technology | 2 | $15B |
|
||
Price history
1 event — show timeline
- 2026-05-22 Listed $149,900 RHR
Property tax history
-21.9%/yrLatest (2019): $168 · -70.9% YoY. Source: county tax records.
Cash-flow waterfall
monthlySold comps — $/sqft
last 12 mo · ≤1 miLoading sold comps…