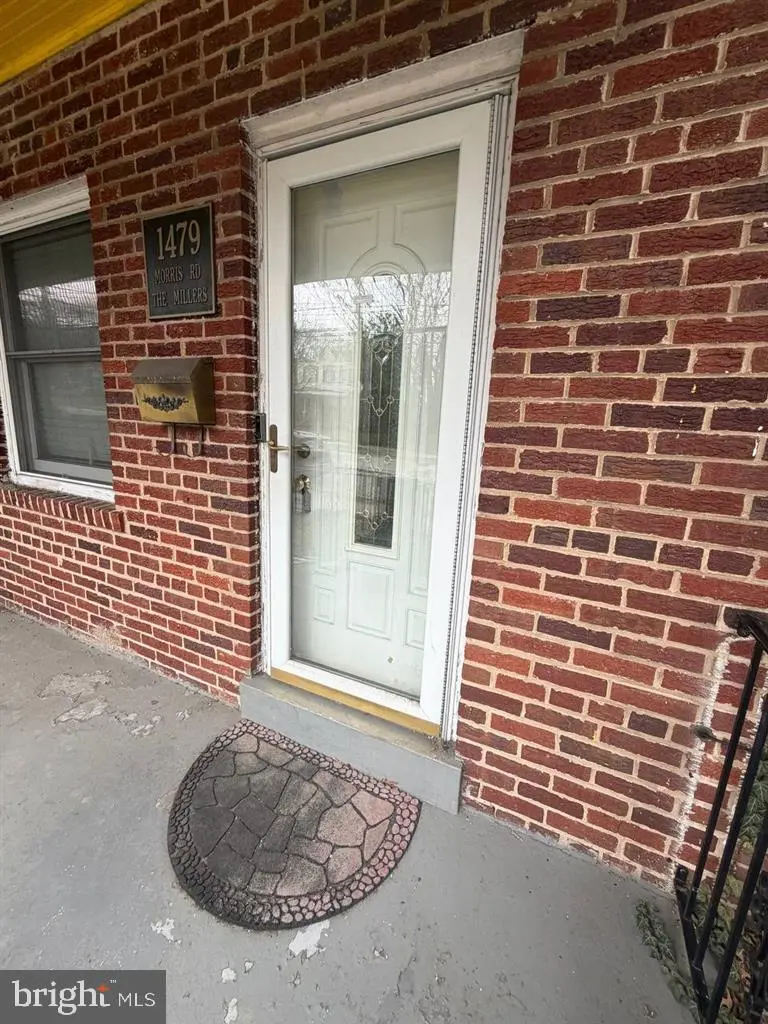
1479 Morris Rd SE · Washington, DC
Flood risk 1/10 · Minimal
- FEMA flood zone
- X (unshaded)
- Chance of flooding over 30 yrs
- 0.0%
- Est. flood insurance / yr
- $473 – $860
Fire risk 1/10 · Minimal
- Est. fire insurance / yr
- $631 – $1,173
Heat risk 7/10 · Major
- Hot days now (above 104°F)
- 7 days/yr
- Hot days in 30 yrs
- 15 days/yr
Wind risk 4/10 · Minor
- Chance of severe wind over 30 yrs
- 17.0%
Air-quality risk 4/10 · Minor
- Unhealthy air days now
- 4 days/yr
- Unhealthy air days in 30 yrs
- 5 days/yr
Risk factors via First Street. Map © Google.
Why this score? — see what drove the C- grade
The composite is a weighted blend of 9 inputs, each scored 0–100. Each bar is that input's sub-score; the figure is the points it added to the 100-point composite (weight × sub-score).
- Cash flow +23.9/30.0
- DSCR +7.7/10.0
- 1% rule +5.4/10.0
- Livability +3.7/5.0
- Schools +3.6/10.0
- Rent growth +3.5/5.0
- Condition / age +2.5/5.0
- ARV discount +2.0/15.0
- Appreciation +0.0/10.0
$184,900
🖨 Deal sheet 📄 Offer letter ✓ Due diligence
Listing remarks
2-bedroom, 2-bath brick townhome in Barry Farm. Built in 1939, this two-level home offers approximately 800 sq ft above grade plus a 400 sq ft basement with additional bath and flex space. Main level features living, dining, and kitchen. Upper level includes two bedrooms and one full bath. Public water and sewer. Gas forced air heating and central A/C. Property sold as-is. Excellent opportunity for investor or owner-occupant looking to add value in SE Washington, DC.
Key facts
- 1,600 sq ft lot
- Built 1939
- Listed 6 days
Neighborhood map
What this means for you Summary
Snapshot
- This is a 2-bed/2.0-bath townhouse listed at $185k.
Deal economics
- At list price, monthly cash flow is $359 ($4k/yr) — positive.
- The deal already cash-flows at list — no discount required.
- Meets the 1% rule at list price ($2k rent vs $185k).
- Cap rate 8.6% vs local median 2.5% in Washington — top-decile yield for the area; either an underpriced asset or a hidden risk that comps aren't pricing in. Stress-test before assuming the spread holds.
Location & tenants
- Location reads 73/100 on livability (#1 in DC) — a middle-class / working-renter tenant base. Strengths: amenities A+, commute A+, employment A+; Watch: crime F, cost of living F.
- District Of Columbia Public Schools (urban): math 33% / reading 40% proficiency, ranked #8 of 32 in DC (top 25%) — families likely to look elsewhere, expect single-tenant / working-renter base with shorter leases; 65% free/reduced lunch — lower-income household profile, screen leases tightly.
- Zoned schools: Moten Es (223 students, 0% FRL); Kramer Ms (203 students, 0% FRL); Anacostia Hs (287 students, 0% FRL) — zoned schools average 0% FRL vs 65% district-wide (65 pts lower); this property's tenant base skews higher-income than the district average.
- Market conditions: Rents rising (+3.9%/yr); 296 active listings in the ZIP; 40 comparable units currently listed for rent nearby; rentals at typical pace (median 25d on market — plan ~3-4 weeks tenant-placement turnaround); 1,737 units permitted in District of Columbia in 2024 (1,506 in 5+ unit buildings).
- This rent runs 43% of the median local income ($54k/yr) — at the standard rent-burdened threshold; future hikes will face affordability resistance.
Forward outlook
- Local home prices are declining (-3.0%/yr); year-one equity from $1k of loan paydown is wiped out by about $6k of value loss. Plan a longer hold.
- District of Columbia County population projected at +50% by 2050 — long-run rental-demand tailwind backs the buy-and-hold thesis.
Negotiation context
- Only 6 days on market — expect competitive offers; lowballing is unlikely to land.
Risks & watch-outs
- Watch-outs: built in 1939 — expect roof / HVAC / electrical / plumbing capex.
- Climate carrying-cost: extreme-heat days projected 7→15/yr by 2055 (HVAC capex compounding) — expect insurance premiums to compound above CPI over the hold.
Questions for the listing agent
- Built in 1939 — when were the roof, HVAC, electrical panel, plumbing, and water heater last replaced?
- Is there a deadline driving the sale (1031 exchange, divorce, estate, relocation)? That informs how much negotiation room exists.
- Crime grade is F in this area — have there been break-ins, vandalism, or insurance claims at this property in the last 3 years? What carrier currently insures it and at what premium?
- What's the average days-on-market for RENTAL listings here right now (not sales)? A rising rental-DOM trend means longer vacancies and softer asking-rent achievability than the comps imply.
- What's the recent tenant-quality profile in this submarket — average credit score on applications, eviction rate, late-payment / NSF rate, and stable-employment percentage? A property-management company in the area should have these aggregated.
- How much new for-sale + rental construction is in the pipeline within 1–3 miles? Heavy new supply typically softens prices + rents 12–24 months out; constrained supply supports both.
Investment metrics
- 1% rule
- 1.04% ✓
- Cap rate
- 8.62%
- Cash-on-cash
- 8.33%
- DSCR
- 1.37
- GRM
- 8.0
CMA / ARV
- ARV (on-the-fly)
- $164,800
- Comps found
- 12
Show comp detail 12 sales within ~0.75 mi
| Address | Dist | Beds/Ba | Sqft | Sold | Price | $/sf | Match |
|---|---|---|---|---|---|---|---|
| 1415 Bangor St SE | 0.12mi | 2/2.0 | 864 (+8%) | 1mo | $275,000 | $318 | 80 |
| 1701 Gainesville St SE #101 | 0.44mi | 2/1.0 | 838 (+5%) | 8mo | $185,000 | $221 | 61 |
| 2617 Douglass Pl SE #202 | 0.18mi | 2/2.0 | 901 (+13%) | 16mo | $275,000 | $305 | 58 |
| 2636 Wade Rd SE #2 | 0.58mi | 2/1.0 | 751 (-6%) | 6mo | $55,000 | $73 | 54 |
| 2656 Bowen Rd SE #101 | 0.33mi | 1/1.0 (-1) | 834 (+4%) | 18mo | $100,000 | $120 | 54 |
| 1707 Gainesville St SE #302 | 0.45mi | 2/1.0 | 838 (+5%) | 17mo | $180,000 | $215 | 53 |
| 2608 Wade Rd SE #202 | 0.55mi | 1/1.0 (-1) | 715 (-11%) | 0mo | $135,000 | $189 | 47 |
| 1469 Ridge Pl SE | 0.71mi | 2/1.0 | 884 (+10%) | 2mo | $157,000 | $178 | 44 |
| 2636 Wade Rd SE #23 | 0.58mi | 2/1.0 | 744 (-7%) | 18mo | $113,000 | $152 | 43 |
| 2900 Pomeroy Rd SE #203 | 0.57mi | 2/1.0 | 700 (-12%) | 9mo | $144,250 | $206 | 41 |
| 2608 Wade Rd SE #103 | 0.55mi | 2/1.0 | 887 (+11%) | 19mo | $153,700 | $173 | 37 |
| 1960 Fendall St SE | 0.58mi | 3/2.5 (+1) | 894 (+12%) | 12mo | $410,000 | $459 | 36 |
Match score weights: distance 35% · size 25% · config 20% · recency 20%. Top-matched comps best support the ARV.
Projected returns pro-forma
-3.0% appreciation · 3.86% rent growth · sell at horizon
- IRR
- -2.8%
- Equity multiple
- 0.89×
- Total profit
- $-5,454
- Equity at exit
- $27,569
- IRR
- 7.8%
- Equity multiple
- 1.61×
- Total profit
- $31,502
- Equity at exit
- $15,987
Cash invested: $51,772 (down + closing). Projections, not guarantees.
Landlord ↔ Tenant lean methodology
- Overall (CITY)
- 0 Strongly Tenant-Friendly
- State District of Columbia
- 12 Strongly Tenant-Friendly · D+43
- County
- — inherits STATE
- City Washington
- 0 Strongly Tenant-Friendly · D+43
ZIP-level market 20020
- Rents YoY
- 3.9%
- Active inventory
- 296
- Price-to-rent
- 8.0×
Monthly cashflow live
- Estimated rent
- $1,914 high interval (Pro) →
- Mortgage (P&I)
- −$970
- Tax from tax record
- −$106 /mo · $1,277/yr
- Insurance
- −$77
- HOA
- −$0
- Vacancy / Maint / Mgmt
- −$402
- Net cashflow
- $359
Break-even live
UW: 25.0% down · 7.5% · 30yr · 1.5% tax · 5.0% vac · 8.0% maint · 8.0% mgmt
Financing live
Cash to close
- Down payment
- $46,225
- Closing costs
- $5,547
- Reserves months
- —
- Total cash needed
- —
Loan-product check · same deal, 3 products live
Conventional
25% down · 7.5% · 30yr
- Down + closing
- —
- Monthly P&I
- —
- Monthly cashflow
- —
- DSCR
- —
- Eligible?
- —
Personal DTI + credit; lowest rate.
DSCR
20% down · 8.5% · 30yr
- Down + closing
- —
- Monthly P&I
- —
- Monthly cashflow
- —
- DSCR
- —
- Eligible?
- —
No personal income docs; deal must DSCR.
Hard money
10% down · 12.0% · 12mo
- Down + closing
- —
- Monthly P&I
- —
- Monthly cashflow
- —
- DSCR
- —
- Eligible?
- —
Short-term bridge; refi at stabilization.
Rent comps 40 comps
| Address | Beds | Baths | Sqft | Rent | $/sqft | DOM | Units | Dist |
|---|---|---|---|---|---|---|---|---|
| 1507 Erie St SE Washington, DC | 1.0 | 1.0 | 1000 | $2,800 | $2.80 | 24d | 1 | 0.15mi |
| 1619 Butler St SE Unit 3 Washington, DC | 2.0 | 1.0 | 700 | $1,700 | $2.43 | 24d | 1 | 0.18mi |
| 1425-1429 Cedar St SE Washington, DC | 1.0 | 1.0 | 644 | $1,419 | $2.20 | 2d | 5 | 0.19mi |
| 2629 Douglass Rd SE Washington, DC | 2.0–3.0 | 1.0–1.5 | 888 | $1,450 | $1.63 | 1d | 13 | 0.23mi |
| 1300 Dexter Ter SE Washington, DC | 2.0 | 1.5 | 1100 | $2,600 | $2.36 | 24d | 1 | 0.30mi |
| 2341 Green St SE Washington, DC | 2.0 | 1.0 | 741 | $1,225 | $1.65 | 24d | 1 | 0.30mi |
| 1302 Morris Rd SE Washington, DC | 3.0 | 1.0 | 750 | $2,400 | $3.20 | 24d | 1 | 0.32mi |
| 2609 Douglass Rd SE #402 Washington, DC | 2.0 | 2.0 | 990 | $2,200 | $2.22 | 24d | 1 | 0.33mi |
| 1300 Morris Rd SE Washington, DC | 2.0 | 1.0 | 650 | $1,499 | $2.31 | 24d | 1 | 0.33mi |
| 2228 Martin Luther King Jr Ave SE Washington, DC | 1.0 | 1.0 | 606 | $1,790 | $2.95 | 3d | 5 | 0.39mi |
| 1526 V St SE Unit 2 Washington, DC | 2.0 | 1.0 | 800 | $1,700 | $2.12 | 24d | 1 | 0.43mi |
| 1516 Marion Barry Ave SE Unit 301 Washington, DC | 3.0 | 2.0 | 1100 | $1,795 | $1.63 | 7d | 1 | 0.54mi |
| 1600 Marion Barry Ave SE Unit Basement -B01 Washington, DC | 1.0 | 1.0 | 550 | $1,550 | $2.82 | 24d | 1 | 0.56mi |
| 1847 Marion Barry Ave SE Washington, DC | 1.0–2.0 | 1.0 | 725 | $1,525 | $2.10 | 24d | 1 | 0.60mi |
| 1907 Good Hope Ct SE #7 Washington, DC | 1.0 | 1.0 | 578 | $1,500 | $2.60 | 24d | 1 | 0.61mi |
| 1907 Good Hope Ct SE #309 Washington, DC | 2.0 | 1.0 | 670 | $1,595 | $2.38 | 24d | 1 | 0.61mi |
| 1953 19th Pl SE Apt 301 Washington, DC | 3.0 | 1.0 | 980 | $5,301 | $5.41 | 24d | 1 | 0.61mi |
| 1907 Marion Barry Ave SE Washington, DC | 2.0 | 1.0 | 900 | $1,495 | $1.66 | 24d | 1 | 0.61mi |
| 1953 19th Pl SE Apt 104 Washington, DC | 3.0 | 1.0 | 980 | $2,800 | $2.86 | 5d | 1 | 0.61mi |
| 1721 T St SE Washington, DC | 1.0–2.0 | 1.0 | 785 | $1,980 | $2.52 | 22d | 6 | 0.64mi |
| 1737 T St SE Washington, DC | 2.0 | 1.0 | 800 | $2,500 | $3.12 | 4d | 1 | 0.66mi |
| 1721 Minnesota Ave SE Washington, DC | 3.0 | 1.0 | 680 | $1,450 | $2.13 | 24d | 1 | 0.74mi |
| 2300 Good Hope Rd SE Washington, DC | 2.0 | 1.0–2.0 | 1020 | $1,913 | $1.88 | 24d | 6 | 0.75mi |
| 1642 16th St SE #3 Washington, DC | 2.0 | 1.0 | 870 | $2,000 | $2.30 | 20d | 1 | 0.76mi |
| 1720 R St SE Washington, DC | 3.0 | 1.0 | 750 | $2,500 | $3.33 | 24d | 1 | 0.81mi |
| 1622 17th St SE Unit 2001 Washington, DC | 2.0 | 1.0 | 535 | $1,850 | $3.46 | 24d | 1 | 0.81mi |
| 1609 17th St SE #202 Washington, DC | 2.0 | 1.0 | 718 | $1,950 | $2.72 | 15d | 1 | 0.83mi |
| 1609 17th St SE #202 Washington, DC | 2.0 | 1.0 | 718 | $1,950 | $2.72 | 24d | 1 | 0.83mi |
| 1621 17th Pl SE Apt 3 Washington, DC | 1.0 | 1.0 | 720 | $1,300 | $1.81 | 24d | 1 | 0.83mi |
| 1601 17th St SE Washington, DC | 1.0 | 1.0 | 720 | $1,650 | $2.29 | 24d | 1 | 0.84mi |
| 650 Howard Rd SE Washington, DC | 3.0 | 1.0–2.0 | 852 | $3,559 | $4.17 | 2d | 53 | 0.85mi |
| 3275 15th Pl SE #101 Washington, DC | 3.0 | 1.0 | 984 | $2,250 | $2.29 | 24d | 1 | 0.85mi |
| 2607 Naylor Rd SE Washington, DC | 1.0 | 1.0 | 665 | $1,275 | $1.92 | 7d | 4 | 0.85mi |
| 2439 25th St SE Washington, DC | 1.0 | 1.0 | 679 | $1,293 | $1.90 | 16d | 1 | 0.85mi |
| 1618 18th St SE Unit 1 Washington, DC | 2.0 | 1.0 | 800 | $1,850 | $2.31 | 24d | 1 | 0.86mi |
| 3281 15th Pl SE Washington, DC | 3.0 | 1.0 | 1012 | $1,750 | $1.73 | 7d | 1 | 0.86mi |
| 2936 Knox Pl SE Washington, DC | 1.0 | 1.0 | 800 | $1,750 | $2.19 | 4d | 1 | 0.88mi |
| 2495 Alabama Ave SE Unit 302 Washington, DC | 3.0 | 1.0 | 825 | $2,600 | $3.15 | 22d | 1 | 0.90mi |
| 2000 Ridgecrest Ct SE Washington, DC | 2.0–3.0 | 1.0 | 900 | $1,750 | $1.94 | 1d | 6 | 0.90mi |
| 2000 Ridgecrest Ct SE Washington, DC | 3.0 | 1.0 | 850 | $1,486 | $1.75 | 1d | 1 | 0.90mi |
Listing history 2 events
-
2026-03-23status Pending
-
2026-03-17$184,900 Active
ⓘ Source: listings_history table (triggers on properties + properties_extension) + one-shot
backfill from property_details.listing_events for pre-trigger history.
Tax reassessment forecast DC · Partial reset (capped growth)
- Current annual tax
- $1,277 · $106/mo
- Projected year-2 tax
- $1,277 · $106/mo
- Expected delta
- $0/yr ($0/mo · 0.0%)
ⓘ Screening estimate from a state-policy table — verify with the county assessor before closing.
Climate risk First Street
- Flood 1/10 Low FEMA zone X (unshaded) · 0% chance over 30 yrs
- Wildfire 1/10 Low
- Heat 7/10 Severe 7 d/yr ≥104°F today · 15 d/yr by 30 yrs out
- Wind 4/10 Moderate 17% chance of damaging wind over 30 yrs
- Air quality 4/10 Moderate 4 unhealthy d/yr today · 5 by 30 yrs out
Nearby sold comps map
Loading sold comps map…
Walkable amenities ~0.75 mi
Loading nearby amenities…
Taxation est. · year 1
- Rental income
- $22,974
- − Mortgage interest
- −$10,357
- − Property taxes
- −$1,277
- − Insurance
- −$924
- − Repairs & maintenance
- −$1,838
- − Management
- −$1,838
- − Depreciation
- −$5,379
- Taxable income
- $1,360
- Est. tax owed @ 24.0%
- −$326
- After-tax cash flow
- $3,985/yr
For passive investors: Depreciation is non-cash, so a rental often shows a tax loss while cash-flowing — sheltering income. Rental losses are passive: they offset passive income freely, and up to $25,000/yr can offset ordinary (W-2) income if you actively participate and your MAGI is under $100k (phasing out to $0 by $150k); unused losses carry forward. On sale, claimed depreciation is recaptured at up to 25%, and gains may owe capital-gains tax (a 1031 exchange can defer both). Figures are a year-1 estimate at your 24.0% rate — not tax advice; consult a CPA.
Schools (NCES district)
- District
- District Of Columbia Public Schools
- NCES district ID
- 1100030
- Math proficiency
- 33% ▲ 3.00%
- Reading proficiency
- 40% ▲ 5.00%
- Median HH income
- $67,671
- Composite
- 35.84/100
- National rank
- #9606
- State rank
- #8 of 32 in DC
Livability — Washington
- Score
- 73/100
- State rank
- #1
- US rank
- #5327
Category grades
Schools grade is shown separately in the Schools card above.
Census & demographics
- Census place
- Washington, DC
- County
- District of Columbia · 671,873 people
- City population
- 671,873
- Metro
- Washington-Arlington-Alexandria, DC-VA-MD-WV
- Population (ZIP)
- 53,005
- Household income
- $54,032
- Rent vs Own
- Severe rent burden
- 5148.0
Population outlook (District of Columbia County) Hauer SSP2
- Today (2025)
- 821,926 people
- By 2030
- 899,517 · +9.4%
- By 2040
- 1,061,162 · +29.1%
- By 2050
- 1,231,493 · +49.8%
- By 2075
- 1,603,312 · +95.1%
- By 2100
- 1,847,141 · +124.7%
Race, ethnicity, and origin ACS 2023
- Neighborhood character
- Predominantly Black (90%)
- Race & ethnicity
- Black 90% Two or more races 3% Hispanic / Latino 3% White 3%
- Common ancestry
- Lithuanian 1%
- Foreign-born
- 3% · Canada
- Languages at home
- 95% English-only · Spanish 2% French/Haitian/Cajun 1%
Political lean MEDSL · District of Columbia
- 2024 margin
- Solid D (+86.1) · D 91.2% · R 5.1% · Other 3.8%
- 2008→2024 swing
- +0.1pp no change · 2008: 85.9pp · 2024: 86.1pp
- All cycles
- 2024: D+86.1 2020: D+86.8 2016: D+88.7 2012: D+84.2 2008: D+85.9
Not yet ingested
- Civics
- —
Market trends
- HPI YoY
- ▼ -415.44%
- Current HPI
- 306.5068
- Rent YoY
- ▲ 3.86%
- Metro
- Washington-Arlington-Alexandria, DC-VA-MD-WV
- State GDP YoY
- ▲ 1.33%
- F500 in state
- 6
Industry mix (Fortune 500 HQ in DC)
| Industry | F500 HQs | Revenue |
|---|---|---|
| Financial Services | 1 | $153B |
|
||
| Life Sciences / Industrials | 1 | $25B |
|
||
| Industrial Machinery | 1 | $8B |
|
||
Price history
2 events — show timeline
- 2026-03-23 Pending — BRIGHT MLS
- 2026-03-17 Listed $184,900 BRIGHT MLS
Property tax history
+7.4%/yrLatest (2025): $1,277 · +8.0% YoY. Source: county tax records.
Cash-flow waterfall
monthlySold comps — $/sqft
last 12 mo · ≤1 miLoading sold comps…