 Multi-family
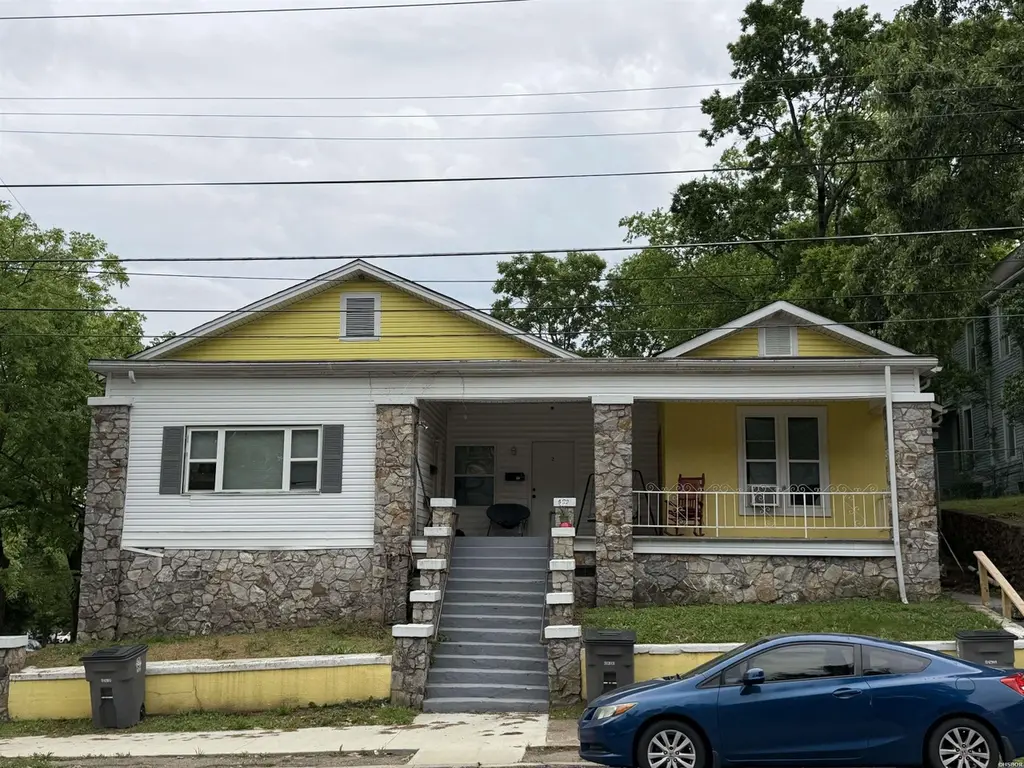
432 Spring St · Hot Springs, AR
Flood risk 5/10 · Moderate
- FEMA flood zone
- X (unshaded)
- Chance of flooding over 30 yrs
- 0.24%
- Est. flood insurance / yr
- $507 – $1,088
Fire risk 4/10 · Minor
- Est. fire insurance / yr
- $1,499 – $2,785
Heat risk 6/10 · Moderate
- Hot days now (above 111°F)
- 8 days/yr
- Hot days in 30 yrs
- 21 days/yr
Wind risk 4/10 · Minor
- Chance of severe wind over 30 yrs
- 9.0%
Air-quality risk 1/10 · Minimal
- Unhealthy air days now
- 0 days/yr
- Unhealthy air days in 30 yrs
- 0 days/yr
Risk factors via First Street. Map © Google.
Why this score? — see what drove the C grade
The composite is a weighted blend of 9 inputs, each scored 0–100. Each bar is that input's sub-score; the figure is the points it added to the 100-point composite (weight × sub-score).
- Cash flow +24.9/30.0
- DSCR +8.1/10.0
- ARV discount +7.5/15.0
- 1% rule +6.4/10.0
- Livability +3.2/5.0
- Condition / age +2.8/5.0
- Rent growth +2.5/5.0
- Schools +2.0/10.0
- Appreciation +0.0/10.0
$268,500
🖨 Deal sheet 📄 Offer letter ✓ Due diligence
Multi-family units
County records classify this as Multi-Family (5+ Unit). Listing-text estimate: 1 unit. estimate disagrees with records
5+ unit building — per-unit beds/baths from public records are typically unavailable; the breakdown below (if shown) is an estimate from the listing text.
Listing remarks
Tri-Plex in great downtown location near the natural Hot Springs, trail heads, convention center and everything downtown. Metered separately except water. The tri-plex has had many updates including a fire sprinkler system throughout and 3 mini-split air systems. 2 bedroom/ 1 bath units = 2 - 1 bedroom/1 bath units = 1 Yearly: Income $38,100 Taxes $1202 estimated Insurance $12,000 estimated Water/Sewer/Trash $2400 * estimates are likely high
Key facts
- Natural hot springs
- Built 1920
- Listed 24 days
Tags
Property features AI
Finance
- Financial info: Annual property tax approximately $1,202
Exterior
- Home design: Residential income property configured as a triplex
- Exterior features: Located centrally near Spring Street
Neighborhood map
What this means for you Summary
Snapshot
- This is a multifamily listed at $268k. Condition is rated average.
Deal economics
- At list price, monthly cash flow is $573 ($7k/yr) — positive.
- The deal already cash-flows at list — no discount required.
- Meets the 1% rule at list price ($3k rent vs $268k).
- Recommended offer: $264k (1.5% below list) — sets the bar for market timing.
- Cap rate 8.9% vs local median 2.8% in Hot Springs — top-decile yield for the area; either an underpriced asset or a hidden risk that comps aren't pricing in. Stress-test before assuming the spread holds.
Location & tenants
- Location reads 65/100 on livability (#140 in AR) — a middle-class / working-renter tenant base. Strengths: cost of living A+, housing A+, health & safety A-; Watch: schools D, crime F, amenities F.
- Hot Springs School District (urban): math 24% / reading 25% proficiency, ranked #195 of 238 in AR (top 82%) — low school quality limits family demand, transient renter base, plan for 1-2y turnover; 72% free/reduced lunch — lower-income household profile, screen leases tightly.
- Market conditions: 363 active listings in the ZIP; 17 comparable units currently listed for rent nearby; rentals lingering (median 44d on market — plan ~5-8 weeks vacancy on turnover, expect pricing pressure); 88% of comp listings sitting > 30 days — soft ceiling on asking rent; 117 units permitted in Garland County in 2024 (24 in 5+ unit buildings).
- At $3,074/mo this rent would consume 69% of the median local household income ($54k/yr) (locally 961% of renters already pay >50% of income on rent) — very limited rent-growth headroom before tenants either downsize or default.
Forward outlook
- Local home prices are declining (-3.0%/yr); year-one equity from $2k of loan paydown is wiped out by about $8k of value loss. Plan a longer hold.
- Garland County population projected at +7% by 2050 — modest demand growth; plan on rents tracking national, not racing it.
Negotiation context
- It's been on market 25 days — a 2% lower offer ($264k) is reasonable based on typical stale-listing flexibility.
Risks & watch-outs
- Watch-outs: built in 1920 — expect roof / HVAC / electrical / plumbing capex.
- Climate carrying-cost: moderate flood risk; extreme-heat days projected 8→21/yr by 2055 (HVAC capex compounding) — expect insurance premiums to compound above CPI over the hold.
Questions for the listing agent
- Built in 1920 — when were the roof, HVAC, electrical panel, plumbing, and water heater last replaced?
- Is there a deadline driving the sale (1031 exchange, divorce, estate, relocation)? That informs how much negotiation room exists.
- Schools are D-rated, which usually means shorter tenancies and higher turnover. Who's the typical renter profile here, and what's been the actual vacancy rate?
- Crime grade is F in this area — have there been break-ins, vandalism, or insurance claims at this property in the last 3 years? What carrier currently insures it and at what premium?
- What's the average days-on-market for RENTAL listings here right now (not sales)? A rising rental-DOM trend means longer vacancies and softer asking-rent achievability than the comps imply.
- What's the recent tenant-quality profile in this submarket — average credit score on applications, eviction rate, late-payment / NSF rate, and stable-employment percentage? A property-management company in the area should have these aggregated.
- How much new apartment / multifamily construction is in the pipeline within 1–3 miles? Heavy new supply (>2% of stock underway) typically softens rents 12–24 months out; light construction supports rent growth.
Investment metrics
- 1% rule
- 1.14% ✓
- Cap rate
- 8.85%
- Cash-on-cash
- 9.14%
- DSCR
- 1.41
- GRM
- 7.3
CMA / ARV
No comps found within radius.
Show comp detail 7 sales within ~0.75 mi
| Address | Dist | Beds/Ba | Sqft | Sold | Price | $/sf | Match |
|---|---|---|---|---|---|---|---|
| 119 Oak St | 0.43mi | 42/38.0 | 50,438 | 20mo | $2,300,000 | $46 | 51 |
| 111 Pratt | 0.50mi | 9/— | 2,948 | 20mo | $212,500 | $72 | 47 |
| 110 Pratt | 0.50mi | 17/— | 7,214 | 20mo | $314,250 | $44 | 47 |
| 110 & 112 Bolton St | 0.57mi | 8/— | 7,039 | 17mo | $197,500 | $28 | 47 |
| 400 & 402 Quapaw | 0.56mi | 15/— | 10,546 | 20mo | $450,000 | $43 | 45 |
| 522 & 524 Orange St | 0.59mi | —/— | 2,634 | 20mo | $550,000 | $209 | 44 |
| 519 Quapaw Ave | 0.66mi | 3/2.0 | 1,344 | 20mo | $95,000 | $71 | 40 |
Match score weights: distance 35% · size 25% · config 20% · recency 20%. Top-matched comps best support the ARV.
Projected returns pro-forma
-3.0% appreciation · 3.0% rent growth · sell at horizon
- IRR
- -2.5%
- Equity multiple
- 0.91×
- Total profit
- $-6,973
- Equity at exit
- $40,034
- IRR
- 7.2%
- Equity multiple
- 1.55×
- Total profit
- $41,103
- Equity at exit
- $23,215
Cash invested: $75,180 (down + closing). Projections, not guarantees.
Landlord ↔ Tenant lean methodology
- Overall (STATE)
- 92 Strongly Landlord-Friendly
- State Arkansas
- 92 Strongly Landlord-Friendly · R+14
- County
- — inherits STATE
- City
- — inherits STATE
ZIP-level market 71901
- Home prices YoY
- -3.6%
- Active inventory
- 363
- Price-to-rent
- 21.2×
Monthly cashflow live
- Estimated rent
- $3,074 high interval (Pro) →
- Mortgage (P&I)
- −$1,408
- Tax est. 1.5%
- −$336 /mo · $4,028/yr
- Insurance
- −$112
- HOA
- −$0
- Vacancy / Maint / Mgmt
- −$646
- Net cashflow
- $573
Break-even live
3-unit breakdown (identical units grouped — click to expand)
| Units | Beds | Baths | Est. rent |
|---|---|---|---|
| 2× units | 2 | 1 | $2,114 |
| #1 | 2 | 1 | $1,057 |
| #2 | 2 | 1 | $1,057 |
| 1× unit | 1 | 1 | $960 |
| Total (3 units) | $3,074 | ||
UW: 25.0% down · 7.5% · 30yr · 1.5% tax · 5.0% vac · 8.0% maint · 8.0% mgmt
Financing live
Cash to close
- Down payment
- $67,125
- Closing costs
- $8,055
- Reserves months
- —
- Total cash needed
- —
Loan-product check · same deal, 3 products live
Conventional
25% down · 7.5% · 30yr
- Down + closing
- —
- Monthly P&I
- —
- Monthly cashflow
- —
- DSCR
- —
- Eligible?
- —
Personal DTI + credit; lowest rate.
DSCR
20% down · 8.5% · 30yr
- Down + closing
- —
- Monthly P&I
- —
- Monthly cashflow
- —
- DSCR
- —
- Eligible?
- —
No personal income docs; deal must DSCR.
Hard money
10% down · 12.0% · 12mo
- Down + closing
- —
- Monthly P&I
- —
- Monthly cashflow
- —
- DSCR
- —
- Eligible?
- —
Short-term bridge; refi at stabilization.
Rent comps 17 comps
| Address | Beds | Baths | Sqft | Rent | $/sqft | DOM | Units | Dist |
|---|---|---|---|---|---|---|---|---|
| 315 Convention Blvd Hot Springs, AR | 2.0 | 1.0 | 900 | $950 | $1.06 | 44d | 4 | 0.02mi |
| 405 Spring St Unit 2 Hot Springs, AR | 1.0 | 1.0 | 750 | $750 | $1.00 | 44d | 1 | 0.09mi |
| 125 Oak St Unit 1-402 Hot Springs, AR | 2.0 | 1.0 | 1150 | $1,475 | $1.28 | 44d | 1 | 0.46mi |
| 125 Oak St Unit 1-306 Hot Springs, AR | 2.0 | 1.0 | 970 | $1,200 | $1.24 | 44d | 1 | 0.46mi |
| 125 Oak St Unit 1-404 Hot Springs, AR | 1.0 | 1.0 | 783 | $1,175 | $1.50 | 44d | 1 | 0.46mi |
| 125 Oak St Unit 1-307 Hot Springs, AR | 2.0 | 1.0 | 1000 | $1,350 | $1.35 | 44d | 1 | 0.46mi |
| 627 Quapaw Ave Unit 2 Hot Springs, AR | 1.0 | 1.0 | 775 | $950 | $1.23 | 44d | 1 | 0.75mi |
| 319 Hazel St Hot Springs National Park, AR | 3.0 | 2.0 | 1743 | $1,895 | $1.09 | 44d | 1 | 0.80mi |
| 132 Ramble St Unit A Hot Springs, AR | 2.0 | 2.0 | — | $1,200 | — | 44d | 1 | 0.82mi |
| 605 Hig Fry Rd Hot Springs National Park, AR | 2.0 | 1.0–2.0 | 806 | $1,400 | $1.74 | 23d | 1 | 0.83mi |
| 314 Hagen St Hot Springs, AR | 2.0 | 1.0 | — | $795 | — | 44d | 1 | 0.89mi |
| 103 Juniper Pl Hot Springs National Park, AR | 3.0 | 1.0 | 1056 | $1,250 | $1.18 | 44d | 1 | 1.10mi |
| 106 Breeze St Hot Springs, AR | 1.0 | 1.0 | 900 | $850 | $0.94 | 23d | 1 | 1.10mi |
| 104 Selma St Hot Springs National Park, AR | 2.0 | 1.0 | 832 | $950 | $1.14 | 44d | 1 | 1.18mi |
| 109 Alcorn St Unit A Hot Springs, AR | 2.0 | 1.0 | 850 | $1,295 | $1.52 | 44d | 1 | 1.19mi |
| 1007 Park Ave Hot Springs National Park, AR | 1.0 | 1.0 | 668 | $952 | $1.43 | 44d | 1 | 1.40mi |
| 120 Greenway St Unit 1 Hot Springs, AR | 1.0 | 1.0 | 750 | $775 | $1.03 | 44d | 1 | 1.46mi |
Listing history 17 events
-
2026-06-19days on market $268,500 Active 25 DOM
-
2026-06-18days on market $268,500 Active 24 DOM
-
2026-06-17days on market $268,500 Active 23 DOM
-
2026-06-16days on market $268,500 Active 22 DOM
-
2026-06-15days on market $268,500 Active 21 DOM
-
2026-06-14days on market $268,500 Active 19 DOM
-
2026-06-13days on market $268,500 Active 18 DOM
-
2026-06-10days on market $268,500 Active 16 DOM
-
2026-06-09days on market $268,500 Active 15 DOM
-
2026-06-08days on market $268,500 Active 14 DOM
-
2026-06-07days on market $268,500 Active 13 DOM
-
2026-06-05days on market $268,500 Active 10 DOM
-
2026-06-02days on market $268,500 Active 8 DOM
-
2026-06-01days on market $268,500 Active 7 DOM
-
2026-05-31days on market $268,500 Active 6 DOM
-
2026-05-30days on market $268,500 Active 5 DOM
-
2026-05-25$268,500 Active
ⓘ Source: listings_history table (triggers on properties + properties_extension) + one-shot
backfill from property_details.listing_events for pre-trigger history.
Climate risk First Street
- Flood 5/10 Major FEMA zone X (unshaded) · 24% chance over 30 yrs
- Wildfire 4/10 Moderate
- Heat 6/10 Major 8 d/yr ≥111°F today · 21 d/yr by 30 yrs out
- Wind 4/10 Moderate 9% chance of damaging wind over 30 yrs
- Air quality 1/10 Low 0 unhealthy d/yr today · 0 by 30 yrs out
Nearby sold comps map
Loading sold comps map…
Walkable amenities ~0.75 mi
Loading nearby amenities…
Taxation est. · year 1
- Rental income
- $36,888
- − Mortgage interest
- −$15,040
- − Property taxes
- −$4,028
- − Insurance
- −$1,342
- − Repairs & maintenance
- −$2,951
- − Management
- −$2,951
- − Depreciation
- −$7,811
- Taxable income
- $2,765
- Est. tax owed @ 24.0%
- −$664
- After-tax cash flow
- $6,211/yr
For passive investors: Depreciation is non-cash, so a rental often shows a tax loss while cash-flowing — sheltering income. Rental losses are passive: they offset passive income freely, and up to $25,000/yr can offset ordinary (W-2) income if you actively participate and your MAGI is under $100k (phasing out to $0 by $150k); unused losses carry forward. On sale, claimed depreciation is recaptured at up to 25%, and gains may owe capital-gains tax (a 1031 exchange can defer both). Figures are a year-1 estimate at your 24.0% rate — not tax advice; consult a CPA.
Condition & rehab AI · 10 photos
A moderate rehab project is needed to improve the curb appeal and resale value of this triplex in a great downtown location.
Repairs flagged
- Minor Landscaping — Overgrown grass needs trimming
- Moderate Exterior paint — Yellow siding shows wear
Value-add opportunities
- Both Landscaping and exterior painting — Improves curb appeal and resale value
- Rental HVAC system inspection and maintenance — Ensures comfort and energy efficiency
Renovation cost estimate screening
| Repair item | Severity | Est. cost |
|---|---|---|
| Landscaping · Overgrown grass needs trimming | Minor | $500–3,000 |
| Exterior paint · Yellow siding shows wear | Moderate | $3,000–15,000 |
| Total estimated repair cost · 2 items | $3,500–18,000 |
Value-add ROI direction
- Both Landscaping and exterior painting — Improves curb appeal and resale value ↑
- Rental HVAC system inspection and maintenance — Ensures comfort and energy efficiency ↑
ⓘ Cost ranges are severity-bucket heuristics (US national rule-of-thumb). Get contractor quotes + a written scope before underwriting a rehab budget.
Schools (NCES district)
- District
- Hot Springs School District
- NCES district ID
- 0507890
- Math proficiency
- 24% ▼ -15.00%
- Reading proficiency
- 25% ▼ -12.00%
- Median HH income
- $28,817
- Composite
- 19.62/100
- National rank
- #8746
- State rank
- #195 of 238 in AR
Livability — Hot Springs
- Score
- 65/100
- State rank
- #140
- US rank
- #12498
Category grades
Schools grade is shown separately in the Schools card above.
Census & demographics
- Census place
- Hot Springs, AR
- County
- Garland County · 76,414 people
- City population
- 76,414
- Metro
- Hot Springs, AR
- Population (ZIP)
- 28,937
- Household income
- $53,514
- Rent vs Own
- Severe rent burden
- 961.0
Population outlook (Garland County) Hauer SSP2
- Today (2025)
- 100,343 people
- By 2030
- 101,880 · +1.5%
- By 2040
- 104,804 · +4.4%
- By 2050
- 107,292 · +6.9%
- By 2075
- 113,182 · +12.8%
- By 2100
- 112,247 · +11.9%
Race, ethnicity, and origin ACS 2023
- Neighborhood character
- Predominantly White (71%)
- Race & ethnicity
- White 71% Black 13% Hispanic / Latino 10% Two or more races 6%
- Hispanic origin (detail)
- Mexican 7%
- Common ancestry
- Italian 2% Slovak 2% Portuguese 1%
- Foreign-born
- 5% · Canada, Vietnam
- Languages at home
- 90% English-only · Spanish 7% Vietnamese 1%
Political lean MEDSL · Garland
- 2024 margin
- Solid R (+36.2) · D 30.8% · R 67.0% · Other 2.2%
- 2008→2024 swing
- -11.3pp toward R · 2008: -25.0pp · 2024: -36.2pp
- All cycles
- 2024: R+36.2 2020: R+34.0 2016: R+34.1 2012: R+29.9 2008: R+25.0
Not yet ingested
- Civics
- —
Market trends
- HPI YoY
- ▼ -11.75%
- Current HPI
- 317.2542
- Rent YoY
- —
- Metro
- Hot Springs, AR
- State GDP YoY
- ▲ 3.80%
- F500 in state
- 10
Industry mix (Fortune 500 HQ in AR)
| Industry | F500 HQs | Revenue |
|---|---|---|
| Retail | 1 | $681B |
|
||
| Food / Agriculture | 1 | $53B |
|
||
| Retail / Energy | 1 | $22B |
|
||
| Transportation / Logistics | 1 | $12B |
|
||
| Energy | 1 | $4B |
|
||
Price history
1 event — show timeline
- 2026-05-25 Listed $268,500 HSBOR
Cash-flow waterfall
monthlySold comps — $/sqft
last 12 mo · ≤1 miLoading sold comps…