 Multi-family
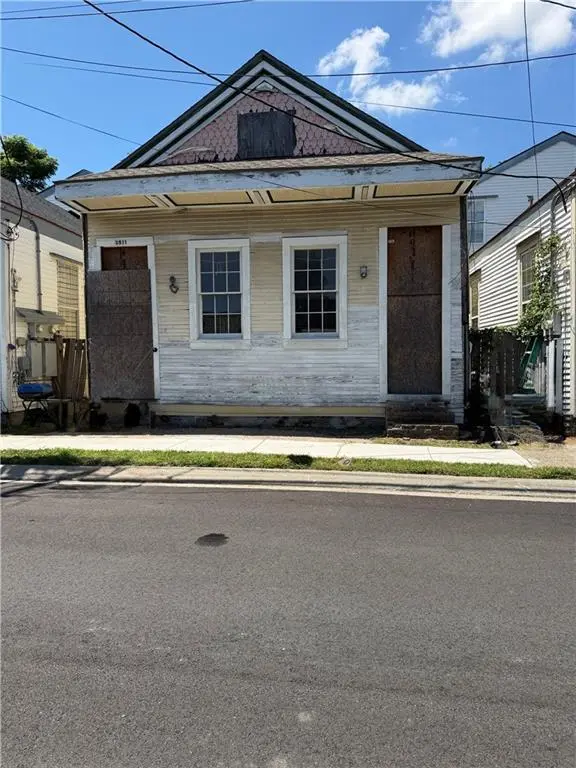
3509 11 S Saratoga St · New Orleans, LA
Flood risk 8/10 · Major
- FEMA flood zone
- X (shaded)
- Chance of flooding over 30 yrs
- 0.6%
- Est. flood insurance / yr
- $507 – $1,088
Fire risk 1/10 · Minimal
- Est. fire insurance / yr
- $1,269 – $2,357
Heat risk 10/10 · Severe
- Hot days now (above 108°F)
- 7 days/yr
- Hot days in 30 yrs
- 21 days/yr
Wind risk 10/10 · Severe
- Chance of severe wind over 30 yrs
- 99.0%
Air-quality risk 3/10 · Minor
- Unhealthy air days now
- 3 days/yr
- Unhealthy air days in 30 yrs
- 4 days/yr
Risk factors via First Street. Map © Google.
Why this score? — see what drove the B- grade
The composite is a weighted blend of 9 inputs, each scored 0–100. Each bar is that input's sub-score; the figure is the points it added to the 100-point composite (weight × sub-score).
- Cash flow +30.0/30.0
- 1% rule +10.0/10.0
- DSCR +10.0/10.0
- ARV discount +7.5/15.0
- Livability +4.0/5.0
- Condition / age +2.5/5.0
- Rent growth +2.1/5.0
- Schools +1.6/10.0
- Appreciation +0.0/10.0
$99,000
🖨 Deal sheet 📄 Offer letter ✓ Due diligence
Multi-family units
County records classify this as Multi-Family (2-4 Unit). Listing-text estimate: 1 unit. estimate disagrees with records
Listing remarks MLS
This property offers a unique opportunity to restore and reimagine a valuable piece of real estate. With multiple possibilities, the property can be renovated and converted back into a multi-family income-producing property, transformed into a spacious single-family residence, or cleared entirely to create a blank canvas for new construction. Whether you're an investor, developer, or homeowner with a vision, this property provides the flexibility to create something truly special. Bring your ideas and unlock its full potential.
Key facts
- 2,217 sq ft lot
- Built 1920
- Listed 8 days
Property features AI
Exterior
- Utilities: Public water; Public sewer
- Home design: 2-story home; Wood siding exterior; Shingle roof
- Construction: Wood siding construction; Raised foundation; Built with shingle roof
- Exterior features: City lot; Rectangular lot; Lot dimensions approximately 29 x 78
Interior
- Bathrooms: 2 full bathrooms
- Interior features: Average condition; Raised foundation
Neighborhood map
What this means for you Summary
Snapshot
- This is a 4-bed/2.0-bath multifamily listed at $99k.
Deal economics
- At list price, monthly cash flow is $2k ($21k/yr) — positive.
- The deal already cash-flows at list — no discount required.
- Meets the 1% rule at list price ($3k rent vs $99k).
- Cap rate 28.3% vs local median 4.4% in New Orleans — top-decile yield for the area; either an underpriced asset or a hidden risk that comps aren't pricing in. Stress-test before assuming the spread holds.
Location & tenants
- Location reads 81/100 on livability (#3 in LA, #1,383 nationally) — a professional / high-income tenant draw. Strengths: amenities A+, commute A+, health & safety A+; Watch: crime C-, employment D.
- Orleans Parish (urban): math 11% / reading 27% proficiency, ranked #69 of 98 in LA (top 70%) — low school quality limits family demand, transient renter base, plan for 1-2y turnover; 68% free/reduced lunch — lower-income household profile, screen leases tightly.
- Market conditions: Rents soft (-1.4%/yr); 278 active listings in the ZIP; 40 comparable units currently listed for rent nearby; rentals at typical pace (median 24d on market — plan ~3-4 weeks tenant-placement turnaround); solid renter incomes; 710 units permitted in Orleans Parish in 2024 (244 in 5+ unit buildings).
- This rent runs 44% of the median local income ($90k/yr) — at the standard rent-burdened threshold; future hikes will face affordability resistance.
Forward outlook
- Local home prices are declining (-3.0%/yr); year-one equity from $684 of loan paydown is wiped out by about $3k of value loss. Plan a longer hold.
- Orleans County population projected at +61% by 2050 — long-run rental-demand tailwind backs the buy-and-hold thesis.
- At projected returns (-3.0% appreciation + 0.0% rent growth), your $28k cash investment doubles in ~2 years — after that, you're playing with house money.
Negotiation context
- Only 8 days on market — expect competitive offers; lowballing is unlikely to land.
- 6 sale attempts since 17y ago with the ask held roughly flat each time — persistent listings suggest the price (not the market) is what's stuck; bring a comps-based counter.
- Current owner paid $25k; list at $99k implies a 296% gain — meaningful room to come down on a strong offer.
Risks & watch-outs
- Watch-outs: property tax is 3.1% of price; flood insurance adds $66/mo; built in 1920 — expect roof / HVAC / electrical / plumbing capex.
- Climate carrying-cost: severe flood risk; severe wind risk, 99% chance of damaging wind over 30y; extreme-heat days projected 7→21/yr by 2055 (HVAC capex compounding) — expect insurance premiums to compound above CPI over the hold.
Questions for the listing agent
- Built in 1920 — when were the roof, HVAC, electrical panel, plumbing, and water heater last replaced?
- Property tax is high relative to price — has the assessment been appealed recently, and will the sale trigger a re-assessment?
- What's the actual annual flood-insurance premium (NFIP or private), and is the property in a SFHA with mandatory coverage?
- Is there a deadline driving the sale (1031 exchange, divorce, estate, relocation)? That informs how much negotiation room exists.
- What's the average days-on-market for RENTAL listings here right now (not sales)? A rising rental-DOM trend means longer vacancies and softer asking-rent achievability than the comps imply.
- What's the recent tenant-quality profile in this submarket — average credit score on applications, eviction rate, late-payment / NSF rate, and stable-employment percentage? A property-management company in the area should have these aggregated.
- How much new apartment / multifamily construction is in the pipeline within 1–3 miles? Heavy new supply (>2% of stock underway) typically softens rents 12–24 months out; light construction supports rent growth.
Investment metrics
- 1% rule
- 3.37% ✓
- Cap rate
- 28.29%
- Cash-on-cash
- 78.56%
- DSCR
- 4.50
- GRM
- 2.5
CMA / ARV
- ARV (on-the-fly)
- $285,120
- Comps found
- 12
Show comp detail 12 sales within ~0.75 mi
| Address | Dist | Beds/Ba | Sqft | Sold | Price | $/sf | Match |
|---|---|---|---|---|---|---|---|
| 1713 15 8th St | 0.35mi | 4/2.0 | 1,750 (-2%) | 7mo | $280,000 | $160 | 75 |
| 2219 21 Toledano St | 0.20mi | 4/2.0 | 1,640 (-8%) | 4mo | $232,000 | $141 | 75 |
| 1917 Jena St | 0.53mi | 4/2.0 | 1,857 (+4%) | 1mo | $215,000 | $116 | 67 |
| 2820-22 Milan St | 0.56mi | 4/2.0 | 1,704 (-4%) | 0mo | $305,000 | $179 | 66 |
| 3020 22 Gen Taylor St | 0.68mi | 4/2.0 | 1,717 (-4%) | 6mo | $190,000 | $111 | 57 |
| 2521 23 Carondelet St | 0.62mi | 4/2.5 | 1,873 (+5%) | 6mo | $490,000 | $262 | 56 |
| 1809 11 Third St | 0.58mi | 4/2.0 | 1,585 (-11%) | 1mo | $260,000 | $164 | 54 |
| 4522 S Liberty St | 0.57mi | 5/3.0 (+1) | 1,831 (+3%) | 8mo | $253,000 | $138 | 53 |
| 2514-16 Second St | 0.62mi | 4/3.0 | 1,910 (+7%) | 12mo | $293,000 | $153 | 45 |
| 3112 14 General Taylor St | 0.73mi | 4/2.0 | 1,930 (+8%) | 11mo | $265,000 | $137 | 43 |
| 4005-4007 Camp St | 0.71mi | 3/2.0 (-1) | 1,625 (-9%) | 11mo | $540,000 | $332 | 38 |
| 3220 Chestnut St | 0.65mi | 3/3.0 (-1) | 1,975 (+11%) | 12mo | $649,000 | $329 | 33 |
Match score weights: distance 35% · size 25% · config 20% · recency 20%. Top-matched comps best support the ARV.
Projected returns pro-forma
-3.0% appreciation · 0.0% rent growth · sell at horizon
- IRR
- 71.9%
- Equity multiple
- 4.09×
- Total profit
- $85,719
- Equity at exit
- $14,761
- IRR
- 74.9%
- Equity multiple
- 7.53×
- Total profit
- $180,988
- Equity at exit
- $8,560
Cash invested: $27,720 (down + closing). Projections, not guarantees.
Landlord ↔ Tenant lean methodology
- Overall (STATE)
- 90 Strongly Landlord-Friendly
- State Louisiana
- 90 Strongly Landlord-Friendly · R+12
- County
- — inherits STATE
- City
- — inherits STATE
ZIP-level market 70115
- Rents YoY
- -1.4%
- Active inventory
- 278
- Price-to-rent
- 4.9×
Monthly cashflow live
- Estimated rent
- $3,333 high interval (Pro) →
- Mortgage (P&I)
- −$519
- Tax from tax record
- −$258 /mo · $3,094/yr
- Insurance
- −$41
- Flood insurance flood zone
- −$66 /mo · $798/yr
- HOA
- −$0
- Vacancy / Maint / Mgmt
- −$700
- Net cashflow
- $1,748
Break-even live
2-unit breakdown (identical units grouped — click to expand)
| Units | Beds | Baths | Est. rent |
|---|---|---|---|
| 2× units | 2 | 1 | $3,334 |
| #1 | 2 | 1 | $1,667 |
| #2 | 2 | 1 | $1,667 |
| Total (2 units) | $3,333 | ||
UW: 25.0% down · 7.5% · 30yr · 1.5% tax · 5.0% vac · 8.0% maint · 8.0% mgmt
Financing live
Cash to close
- Down payment
- $24,750
- Closing costs
- $2,970
- Reserves months
- —
- Total cash needed
- —
Loan-product check · same deal, 3 products live
Conventional
25% down · 7.5% · 30yr
- Down + closing
- —
- Monthly P&I
- —
- Monthly cashflow
- —
- DSCR
- —
- Eligible?
- —
Personal DTI + credit; lowest rate.
DSCR
20% down · 8.5% · 30yr
- Down + closing
- —
- Monthly P&I
- —
- Monthly cashflow
- —
- DSCR
- —
- Eligible?
- —
No personal income docs; deal must DSCR.
Hard money
10% down · 12.0% · 12mo
- Down + closing
- —
- Monthly P&I
- —
- Monthly cashflow
- —
- DSCR
- —
- Eligible?
- —
Short-term bridge; refi at stabilization.
Rent comps 40 comps
| Address | Beds | Baths | Sqft | Rent | $/sqft | DOM | Units | Dist |
|---|---|---|---|---|---|---|---|---|
| 3429 Baronne St New Orleans, LA | 3.0 | 2.5 | 1600 | $2,500 | $1.56 | 43d | 1 | 0.17mi |
| 3212 Danneel St New Orleans, LA | 3.0 | 2.0 | 1945 | $2,000 | $1.03 | 23d | 1 | 0.20mi |
| 1636 Peniston St Unit B New Orleans, LA | 3.0 | 2.0 | 1950 | $1,700 | $0.87 | 20d | 1 | 0.29mi |
| 2539 Amelia St New Orleans, LA | 3.0 | 2.0 | 1296 | $2,200 | $1.70 | 23d | 1 | 0.35mi |
| 4213 Dryades St New Orleans, LA | 4.0 | 2.0 | 2000 | $2,800 | $1.40 | 23d | 1 | 0.36mi |
| 4223 S Liberty St New Orleans, LA | 3.0 | 1.5 | 1509 | $2,400 | $1.59 | 2d | 1 | 0.38mi |
| 2600 Peniston St New Orleans, LA | 4.0 | 2.0 | 2342 | $3,500 | $1.49 | 43d | 1 | 0.39mi |
| 2535 Marengo St New Orleans, LA | 3.0 | 1.0 | 1300 | $1,200 | $0.92 | 14d | 1 | 0.39mi |
| 2733 Danneel St New Orleans, LA | 4.0 | 2.0 | 1350 | $1,775 | $1.31 | 23d | 1 | 0.43mi |
| 1907 Napoleon Ave New Orleans, LA | 4.0 | 2.0 | 2500 | $2,800 | $1.12 | 16d | 1 | 0.45mi |
| 2717 Loyola Ave New Orleans, LA | 3.0 | 2.0 | 1232 | $2,300 | $1.87 | 23d | 1 | 0.45mi |
| 2717 Loyola Ave New Orleans, LA | 3.0 | 2.0 | 1250 | $2,300 | $1.84 | 1d | 1 | 0.45mi |
| 2107 Fourth St New Orleans, LA | 3.0 | 1.0 | 1292 | $1,775 | $1.37 | 16d | 1 | 0.48mi |
| 2713 Baronne St New Orleans, LA | 3.0 | 2.5 | 1600 | $2,300 | $1.44 | 23d | 1 | 0.49mi |
| 3429 Clara St New Orleans, LA | 3.0 | 2.0 | 1620 | $2,350 | $1.45 | 14d | 1 | 0.52mi |
| 2717 Milan St New Orleans, LA | 3.0 | 1.5 | 1850 | $1,650 | $0.89 | 14d | 1 | 0.52mi |
| 4435 Loyola Ave New Orleans, LA | 3.0 | 2.0 | 1973 | $2,900 | $1.47 | 15d | 1 | 0.53mi |
| 2625 Baronne St Unit 1 New Orleans, LA | 3.0 | 1.5 | 2100 | $2,600 | $1.24 | 43d | 1 | 0.53mi |
| 2308 Jena St New Orleans, LA | 3.0 | 2.5 | 2550 | $3,300 | $1.29 | 43d | 1 | 0.57mi |
| 1410 6th St New Orleans, LA | 3.0 | 2.0 | 1400 | $5,000 | $3.57 | 15d | 1 | 0.61mi |
| 2608 Magnolia St New Orleans, LA | 4.0 | 2.5 | 1950 | $3,200 | $1.64 | 43d | 1 | 0.64mi |
| 4229 Coliseum St New Orleans, LA | 3.0 | 1.0 | 2000 | $1,950 | $0.97 | 16d | 1 | 0.64mi |
| 2403 S Saratoga St New Orleans, LA | 3.0 | 2.5 | 1600 | $2,500 | $1.56 | 23d | 1 | 0.64mi |
| 4502 Pitt St New Orleans, LA | 3.0 | 2.0 | 1360 | $2,500 | $1.84 | 19d | 1 | 0.67mi |
| 1118 Foucher St New Orleans, LA | 3.0 | 2.5 | 1620 | $2,490 | $1.54 | 16d | 1 | 0.67mi |
| 2301 Dryades St New Orleans, LA | 3.0 | 3.0 | 2070 | $3,000 | $1.45 | 2d | 1 | 0.70mi |
| 1915 Philip St New Orleans, LA | 3.0 | 1.5 | 1300 | $2,450 | $1.88 | 23d | 1 | 0.70mi |
| 3035 Delachaise St New Orleans, LA | 3.0 | 1.0 | 1968 | $1,750 | $0.89 | 1d | 1 | 0.71mi |
| 3044 Louisiana Avenue Pkwy New Orleans, LA | 3.0 | 2.0 | 1800 | $1,900 | $1.06 | 23d | 1 | 0.72mi |
| 2231 S Liberty St New Orleans, LA | 3.0 | 3.5 | 1752 | $2,000 | $1.14 | 16d | 1 | 0.74mi |
| 4206 S Derbigny St New Orleans, LA | 3.0 | 1.0 | 1300 | $1,600 | $1.23 | 23d | 1 | 0.75mi |
| 1944 Jackson Ave New Orleans, LA | 3.0 | 2.5 | 1572 | $2,500 | $1.59 | 43d | 1 | 0.77mi |
| 2833 S Derbigny St New Orleans, LA | 3.0 | 2.0 | 1500 | $1,795 | $1.20 | 23d | 1 | 0.77mi |
| 1111 6th St New Orleans, LA | 3.0 | 1.5 | 1425 | $2,995 | $2.10 | 43d | 1 | 0.79mi |
| 3208 Louisiana Avenue Pkwy New Orleans, LA | 3.0 | 2.0 | 1391 | $1,900 | $1.37 | 16d | 1 | 0.81mi |
| 2123 S Liberty St Unit 2125 New Orleans, LA | 3.0 | 2.0 | 1500 | $2,100 | $1.40 | 3d | 1 | 0.82mi |
| 4818 Carondelet St New Orleans, LA | 3.0 | 2.0 | 2400 | $3,600 | $1.50 | 23d | 1 | 0.82mi |
| 3200 Washington Ave Unit NA New Orleans, LA | 4.0 | 3.0 | 2490 | $3,400 | $1.37 | 3d | 1 | 0.84mi |
| 2102 Josephine St New Orleans, LA | 4.0 | 2.0 | 1286 | $2,100 | $1.63 | 23d | 1 | 0.84mi |
| 2806 Upperline St Unit Lower New Orleans, LA | 3.0 | 2.0 | 1250 | $2,500 | $2.00 | 19d | 1 | 0.85mi |
Listing history 5 events
-
2026-06-18days on market $99,000 Active 8 DOM
-
2026-06-17days on market $99,000 Active 7 DOM
-
2026-06-16days on market $99,000 Active 6 DOM
-
2026-06-15days on market $99,000 Active 5 DOM
-
2026-06-13$99,000 Active 3 DOM
ⓘ Source: listings_history table (triggers on properties + properties_extension) + one-shot
backfill from property_details.listing_events for pre-trigger history.
Tax reassessment forecast LA · Resets to sale price
- Current annual tax
- $3,094 · $258/mo
- Projected year-2 tax
- $3,094 · $258/mo
- Expected delta
- $0/yr ($0/mo · 0.0%)
ⓘ Screening estimate from a state-policy table — verify with the county assessor before closing.
Climate risk First Street
- Flood 8/10 Severe FEMA zone X (shaded) · 60% chance over 30 yrs
- Wildfire 1/10 Low
- Heat 10/10 Extreme 7 d/yr ≥108°F today · 21 d/yr by 30 yrs out
- Wind 10/10 Extreme 99% chance of damaging wind over 30 yrs
- Air quality 3/10 Moderate 3 unhealthy d/yr today · 4 by 30 yrs out
Nearby sold comps map
Loading sold comps map…
Walkable amenities ~0.75 mi
Loading nearby amenities…
Taxation est. · year 1
- Rental income
- $39,996
- − Mortgage interest
- −$5,546
- − Property taxes
- −$3,094
- − Insurance
- −$1,292
- − Repairs & maintenance
- −$3,200
- − Management
- −$3,200
- − Depreciation
- −$2,880
- Taxable income
- $20,785
- Est. tax owed @ 24.0%
- −$4,988
- After-tax cash flow
- $15,992/yr
For passive investors: Depreciation is non-cash, so a rental often shows a tax loss while cash-flowing — sheltering income. Rental losses are passive: they offset passive income freely, and up to $25,000/yr can offset ordinary (W-2) income if you actively participate and your MAGI is under $100k (phasing out to $0 by $150k); unused losses carry forward. On sale, claimed depreciation is recaptured at up to 25%, and gains may owe capital-gains tax (a 1031 exchange can defer both). Figures are a year-1 estimate at your 24.0% rate — not tax advice; consult a CPA.
Schools (NCES district)
- District
- Orleans Parish
- NCES district ID
- 2201170
- Math proficiency
- 11% ▼ -52.00%
- Reading proficiency
- 27% ▼ -46.00%
- Median HH income
- $37,011
- Composite
- 15.78/100
- National rank
- #9271
- State rank
- #69 of 98 in LA
Livability — New Orleans
- Score
- 81/100
- State rank
- #3
- US rank
- #1383
Category grades
Schools grade is shown separately in the Schools card above.
Census & demographics
- Census place
- New Orleans, LA
- County
- Orleans Parish · 338,817 people
- City population
- 338,817
- Metro
- New Orleans-Metairie, LA
- Population (ZIP)
- 31,183
- Household income
- $90,182
- Rent vs Own
- Severe rent burden
- 1756.0
Population outlook (Orleans County) Hauer SSP2
- Today (2025)
- 513,025 people
- By 2030
- 575,781 · +12.2%
- By 2040
- 700,174 · +36.5%
- By 2050
- 826,541 · +61.1%
- By 2075
- 1,123,374 · +119.0%
- By 2100
- 1,355,609 · +164.2%
Race, ethnicity, and origin ACS 2023
- Neighborhood character
- Diverse neighborhood (Simpson 0.58)
- Race & ethnicity
- White 59% Black 26% Two or more races 8% Hispanic / Latino 7% Asian 3%
- Hispanic origin (detail)
- Mexican 1%
- Common ancestry
- Lithuanian 8% Italian 3% Slovak 3%
- Foreign-born
- 5% · Canada, China
- Languages at home
- 91% English-only · Spanish 4% French/Haitian/Cajun 2% Other Indo-European 1%
Political lean MEDSL · Orleans
- 2024 margin
- Solid D (+67.0) · D 82.2% · R 15.2% · Other 2.7%
- 2008→2024 swing
- +6.7pp toward D · 2008: 60.3pp · 2024: 67.0pp
- All cycles
- 2024: D+67.0 2020: D+68.2 2016: D+66.2 2012: D+62.5 2008: D+60.3
Not yet ingested
- Civics
- —
Market trends
- HPI YoY
- ▼ -272.08%
- Current HPI
- 287.2138
- Rent YoY
- ▼ -1.42%
- Metro
- New Orleans-Metairie, LA
- State GDP YoY
- ▲ 3.29%
- F500 in state
- 10
Industry mix (Fortune 500 HQ in LA)
| Industry | F500 HQs | Revenue |
|---|---|---|
| Telecommunications | 2 | $23B |
|
||
| Utilities | 1 | $12B |
|
||
| Wholesale / Distribution | 1 | $5B |
|
||
| Advertising | 1 | $2B |
|
||
Price history
-70.4% since first listed8 events — show timeline
- 2026-06-10 Listed $99,000 GSREIN
- 2026-06-10 Listed $99,000 AcadianaMLS
- 2010-04-29 Sold (MLS) $25,000 GSREIN
- 2009-12-18 Listed $29,900 GSREIN
- 2009-12-18 Listed $29,900 AcadianaMLS
- 2009-07-27 Listed $54,900 GSREIN
- 2009-07-27 Listed $54,900 AcadianaMLS
- 2008-02-07 Sold (Public Records) $335,000 Public Records
Property tax history
+7.4%/yrLatest (2026): $3,094 · +1.0% YoY. Source: county tax records.
Cash-flow waterfall
monthlySold comps — $/sqft
last 12 mo · ≤1 miLoading sold comps…