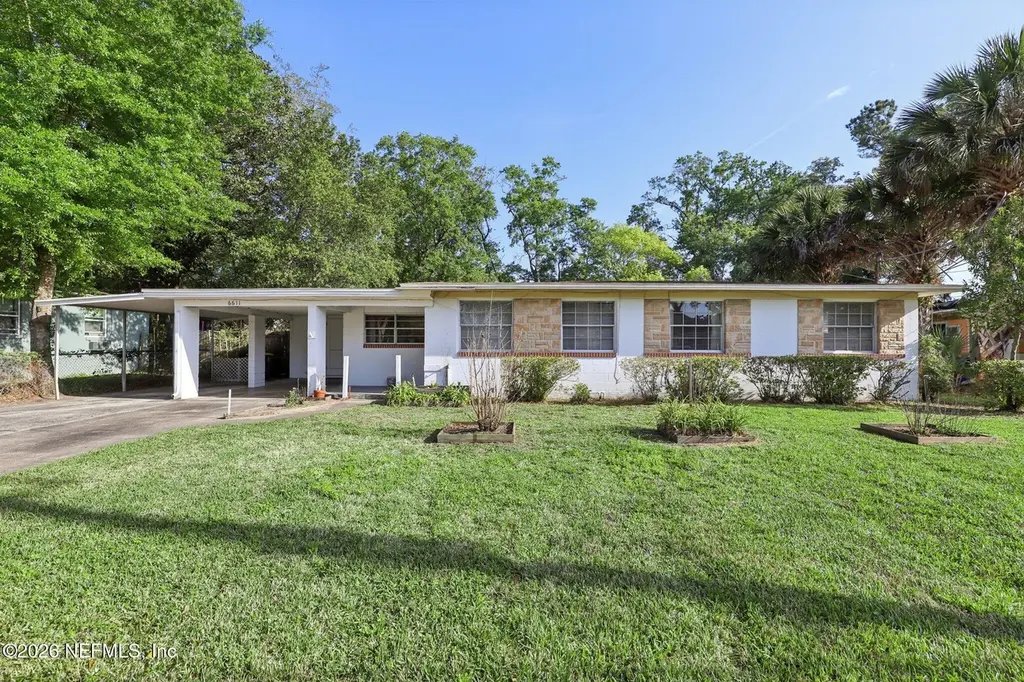
6611 Romilly Dr · Jacksonville, FL
Flood risk 1/10 · Minimal
- FEMA flood zone
- X (unshaded)
- Chance of flooding over 30 yrs
- 0.0%
- Est. flood insurance / yr
- $507 – $1,088
Fire risk 2/10 · Minimal
- Est. fire insurance / yr
- $947 – $1,759
Heat risk 8/10 · Major
- Hot days now (above 107°F)
- 7 days/yr
- Hot days in 30 yrs
- 20 days/yr
Wind risk 10/10 · Severe
- Chance of severe wind over 30 yrs
- 99.0%
Air-quality risk 5/10 · Moderate
- Unhealthy air days now
- 6 days/yr
- Unhealthy air days in 30 yrs
- 7 days/yr
Risk factors via First Street. Map © Google.
Why this score? — see what drove the D grade
The composite is a weighted blend of 9 inputs, each scored 0–100. Each bar is that input's sub-score; the figure is the points it added to the 100-point composite (weight × sub-score).
- Cash flow +13.4/30.0
- ARV discount +6.5/15.0
- Livability +4.2/5.0
- DSCR +4.0/10.0
- Schools +3.9/10.0
- Rent growth +3.0/5.0
- 1% rule +2.5/10.0
- Condition / age +2.5/5.0
- Appreciation +0.0/10.0
$200,000
🖨 Deal sheet 📄 Offer letter ✓ Due diligence
Listing remarks
$10,000 Buyer credit for closing cost or rate buy down. Well maintained ranch-style home in the Oak Hill subdivision 3 bed 1 bath home. This home has a layout that just makes sense. The front door opens to a formal living room that flows right into the kitchen, where appliances will stay, cabinets line the walls, and there's space for a table to gather around. Just past the kitchen, a sunken den creates a cozy second living area with access to the double carports. The yard is fully fenced, ready for pets, play, or a little privacy. Workshop and laundry room right off rear patio. Off the living room, down the hallway the bathroom sits to the left, updated shower/tub while keeping its vintage
Key facts
- Ranch style home
- Formal living room
- Fully fenced yard
Tags
Property features AI
Finance
- HOA & community: Not a senior community
Exterior
- Parking: Attached carport; 2-car carport
- Utilities: Public sewer; Electricity connected; Sewer connected; Water connected
- Home design: Single family residence; One level
- Construction: Shingle roof
- Exterior features: Front porch; Patio; Screened porch; Full backyard fencing; Back yard fence; Shed(s); Cleared lot; Drainage canal on lot; Few trees on lot
Interior
- Kitchen: Electric oven; Electric range; Microwave; Refrigerator
- Bedrooms: 3 bedrooms
- Flooring: Carpet; Wood
- Bathrooms: 1 full bathroom
- Heating & cooling: Central heating; Central air conditioning
- Interior features: Ceiling fans; Eat-in kitchen
- Laundry & utility: Washer; Dryer; Electric water heater
Neighborhood map
What this means for you Summary
Snapshot
- This is a 3-bed/1.0-bath single-family listed at $200k.
Deal economics
- At list price, monthly cash flow is $5 ($57/yr) — positive.
- The deal already cash-flows at list — no discount required.
- To meet the 1% rule (rent ≥ 1% of price), the offer needs to be $151k (24.7% below list).
- Recommended offer: $151k (24.7% below list) — sets the bar for 1% rule.
- Cap rate 6.3% vs local median 4.0% in Jacksonville — top-decile yield for the area; either an underpriced asset or a hidden risk that comps aren't pricing in. Stress-test before assuming the spread holds.
Location & tenants
- Location reads 83/100 on livability (#50 in FL, #911 nationally) — a professional / high-income tenant draw. Strengths: amenities A+, commute A+, housing A+.
- Duval (urban): math 46% / reading 45% proficiency, ranked #48 of 73 in FL (top 66%) — families likely to look elsewhere, expect single-tenant / working-renter base with shorter leases.
- Market conditions: Rents rising (+2.1%/yr); 441 active listings in the ZIP; 40 comparable units currently listed for rent nearby; rentals at typical pace (median 16d on market — plan ~3-4 weeks tenant-placement turnaround); 6,503 units permitted in Duval County in 2024 (1,131 in 5+ unit buildings).
Forward outlook
- Local home prices are declining (-3.0%/yr); year-one equity from $1k of loan paydown is wiped out by about $6k of value loss. Plan a longer hold.
- Duval County population projected at +19% by 2050 — long-run rental-demand tailwind backs the buy-and-hold thesis.
Negotiation context
- It's been on market 76 days — a 6% lower offer ($188k) is reasonable based on typical stale-listing flexibility.
- Current owner paid $60k; list at $200k implies a 231% gain — meaningful room to come down on a strong offer.
Risks & watch-outs
- Watch-outs: built in 1957 — expect roof / HVAC / electrical / plumbing capex.
- Climate carrying-cost: severe wind risk, 99% chance of damaging wind over 30y; extreme-heat days projected 7→20/yr by 2055 (HVAC capex compounding) — expect insurance premiums to compound above CPI over the hold.
Questions for the listing agent
- It's been on market 76 days. Have you received any prior offers? Is the seller open to a 25% concession, seller financing, or rate buy-down credit?
- Built in 1957 — when were the roof, HVAC, electrical panel, plumbing, and water heater last replaced?
- Why hasn't it sold? Are there any deal-killer items the seller is aware of (foundation, flood, title, zoning, code violations)?
- Is there a deadline driving the sale (1031 exchange, divorce, estate, relocation)? That informs how much negotiation room exists.
- Schools are B-rated — typically a magnet for longer-tenancy family renters. What's the average tenant stay here, and is there a school-zone premium baked into asking?
- The area grade is low — what's the realistic commute time and amenity access for the typical tenant pool here? Any planned neighborhood developments (good or bad) we should know about?
- What's the average days-on-market for RENTAL listings here right now (not sales)? A rising rental-DOM trend means longer vacancies and softer asking-rent achievability than the comps imply.
- What's the recent tenant-quality profile in this submarket — average credit score on applications, eviction rate, late-payment / NSF rate, and stable-employment percentage? A property-management company in the area should have these aggregated.
- How much new for-sale + rental construction is in the pipeline within 1–3 miles? Heavy new supply typically softens prices + rents 12–24 months out; constrained supply supports both.
Investment metrics
- 1% rule
- 0.75% ✗
- Cap rate
- 6.32%
- Cash-on-cash
- 0.10%
- DSCR
- 1.00
- GRM
- 11.1
CMA / ARV
- ARV (on-the-fly)
- $195,816
- Comps found
- 12
Show comp detail 12 sales within ~0.75 mi
| Address | Dist | Beds/Ba | Sqft | Sold | Price | $/sf | Match |
|---|---|---|---|---|---|---|---|
| 4819 Daughtry Blvd E | 0.12mi | 3/2.0 | 1,218 (+2%) | 0mo | $195,000 | $160 | 87 |
| 6766 London Bridge Ln | 0.25mi | 3/1.5 | 1,216 (+2%) | 3mo | $127,000 | $104 | 81 |
| 4714 Anvers Blvd | 0.18mi | 3/2.0 | 1,264 (+6%) | 8mo | $207,500 | $164 | 71 |
| 6853 London Bridge Ln | 0.42mi | 3/1.5 | 1,249 (+5%) | 3mo | $199,900 | $160 | 68 |
| 4439 Anvers Blvd | 0.41mi | 3/2.0 | 1,170 (-2%) | 9mo | $125,000 | $107 | 66 |
| 4558 Daughtry Blvd E | 0.31mi | 3/2.0 | 1,304 (+9%) | 6mo | $120,000 | $92 | 61 |
| 6873 Mother Hubbard Dr | 0.41mi | 4/2.0 (+1) | 1,272 (+6%) | 2mo | $220,000 | $173 | 59 |
| 6866 Daughtry Blvd S | 0.40mi | 4/2.0 (+1) | 1,281 (+7%) | 4mo | $220,000 | $172 | 57 |
| 7060 Perke Dr | 0.65mi | 3/2.0 | 1,251 (+5%) | 4mo | $229,900 | $184 | 54 |
| 4495 Twin Hills Way | 0.42mi | 3/2.0 | 1,365 (+14%) | 8mo | $253,000 | $185 | 46 |
| 6037 Transylvania Ave | 0.67mi | 4/1.0 (+1) | 1,352 (+13%) | 2mo | $174,121 | $129 | 40 |
| 6204 Sage Dr | 0.71mi | 3/2.0 | 1,359 (+14%) | 7mo | $239,725 | $176 | 34 |
Match score weights: distance 35% · size 25% · config 20% · recency 20%. Top-matched comps best support the ARV.
Projected returns pro-forma
-3.0% appreciation · 2.11% rent growth · sell at horizon
- IRR
- -17.1%
- Equity multiple
- 0.40×
- Total profit
- $-33,540
- Equity at exit
- $29,821
- IRR
- -10.6%
- Equity multiple
- 0.38×
- Total profit
- $-34,602
- Equity at exit
- $17,292
Cash invested: $56,000 (down + closing). Projections, not guarantees.
Landlord ↔ Tenant lean methodology
- Overall (STATE)
- 87 Strongly Landlord-Friendly
- State Florida
- 87 Strongly Landlord-Friendly · R+3
- County
- — inherits STATE
- City
- — inherits STATE
ZIP-level market 32210
- Rents YoY
- 2.1%
- Active inventory
- 441
- Price-to-rent
- 11.1×
Monthly cashflow live
- Estimated rent
- $1,506 high interval (Pro) →
- Mortgage (P&I)
- −$1,049
- Tax from tax record
- −$53 /mo · $632/yr
- Insurance
- −$83
- HOA
- −$0
- Vacancy / Maint / Mgmt
- −$316
- Net cashflow
- $5
Break-even live
UW: 25.0% down · 7.5% · 30yr · 1.5% tax · 5.0% vac · 8.0% maint · 8.0% mgmt
Financing live
Cash to close
- Down payment
- $50,000
- Closing costs
- $6,000
- Reserves months
- —
- Total cash needed
- —
Loan-product check · same deal, 3 products live
Conventional
25% down · 7.5% · 30yr
- Down + closing
- —
- Monthly P&I
- —
- Monthly cashflow
- —
- DSCR
- —
- Eligible?
- —
Personal DTI + credit; lowest rate.
DSCR
20% down · 8.5% · 30yr
- Down + closing
- —
- Monthly P&I
- —
- Monthly cashflow
- —
- DSCR
- —
- Eligible?
- —
No personal income docs; deal must DSCR.
Hard money
10% down · 12.0% · 12mo
- Down + closing
- —
- Monthly P&I
- —
- Monthly cashflow
- —
- DSCR
- —
- Eligible?
- —
Short-term bridge; refi at stabilization.
Rent comps 40 comps
| Address | Beds | Baths | Sqft | Rent | $/sqft | DOM | Units | Dist |
|---|---|---|---|---|---|---|---|---|
| 6511 Burgundy Rd S Jacksonville, FL | 3.0 | 2.0 | 1361 | $1,685 | $1.24 | 4d | 1 | 0.19mi |
| 4710 Herta Rd Jacksonville, FL | 4.0 | 2.0 | 1272 | $1,670 | $1.31 | 23d | 1 | 0.27mi |
| 6766 Londonbridge Ln Jacksonville, FL | 3.0 | 2.0 | 1300 | $1,775 | $1.37 | 20d | 1 | 0.27mi |
| 4503 Anvers Blvd Jacksonville, FL | 3.0 | 2.0 | 1084 | $1,595 | $1.47 | 23d | 1 | 0.36mi |
| 6479 Sweetbay Ln Jacksonville, FL | 2.0 | 2.0 | 1040 | $1,365 | $1.31 | 23d | 1 | 0.46mi |
| 6522 Sweetbay Ln Jacksonville, FL | 2.0 | 2.0 | 951 | $1,195 | $1.26 | 23d | 1 | 0.47mi |
| 6379 Delacy Rd Jacksonville, FL | 3.0 | 1.0 | 1296 | $1,495 | $1.15 | 23d | 1 | 0.47mi |
| 6468 Sweetbay Ln Unit 102 Jacksonville, FL | 2.0 | 2.0 | 1040 | $1,174 | $1.13 | 21d | 1 | 0.47mi |
| 6468 Sweetbay Ln #101 Jacksonville, FL | 2.0 | 2.0 | 1025 | $1,199 | $1.17 | 3d | 1 | 0.47mi |
| 6528 Sweetbay Ln Jacksonville, FL | 2.0 | 2.0 | 1040 | $1,150 | $1.11 | 23d | 1 | 0.49mi |
| 6462 Sweetbay Ln Jacksonville, FL | 2.0 | 2.0 | 1040 | $1,365 | $1.31 | 16d | 1 | 0.49mi |
| 6534 Sweetbay Ln Jacksonville, FL | 2.0 | 2.0 | 951 | $1,225 | $1.29 | 23d | 1 | 0.49mi |
| 4804 Ducheneau Dr Unit 26 Jacksonville, FL | 3.0 | 2.0 | 1182 | $1,635 | $1.38 | 23d | 1 | 0.49mi |
| 6461 Sweetbay Ln Jacksonville, FL | 2.0 | 2.0 | 995 | $1,295 | $1.30 | 16d | 4 | 0.49mi |
| 6547 Sweetbay Ln Unit 102 Jacksonville, FL | 2.0 | 2.0 | 1040 | $1,195 | $1.15 | 4d | 1 | 0.50mi |
| 6325 Delacy Rd Jacksonville, FL | 4.0 | 2.0 | 1286 | $1,680 | $1.31 | 4d | 1 | 0.50mi |
| 4336 Harlow Blvd Jacksonville, FL | 3.0 | 2.0 | 1408 | $1,499 | $1.06 | 1d | 1 | 0.53mi |
| 6408 Sweetbay Ln Jacksonville, FL | 2.0 | 2.0 | 951 | $1,225 | $1.29 | 16d | 1 | 0.54mi |
| 6870 103rd St Jacksonville, FL | 1.0–2.0 | 1.0–1.5 | 825 | $1,075 | $1.30 | 2d | 14 | 0.56mi |
| 6560 Barmer Dr S Jacksonville, FL | 4.0 | 2.0 | 1370 | $1,750 | $1.28 | 1d | 1 | 0.59mi |
| 5745 Antoinette Ln Jacksonville, FL | 2.0 | 1.0 | 1200 | $1,150 | $0.96 | 3d | 1 | 0.65mi |
| 7059 Melvin Rd Jacksonville, FL | 3.0 | 2.0 | 1330 | $1,600 | $1.20 | 1d | 1 | 0.65mi |
| 5747 Antoinette Ln Jacksonville, FL | 2.0 | 1.0 | 1200 | $1,195 | $1.00 | 23d | 1 | 0.66mi |
| 5984 Windsor Forest Dr Jacksonville, FL | 2.0 | 1.5 | 900 | $1,174 | $1.30 | 21d | 2 | 0.71mi |
| 5985 Windsor Forest Dr Unit 23 Jacksonville, FL | 2.0 | 1.5 | 900 | $999 | $1.11 | 21d | 1 | 0.71mi |
| 5985 Windsor Forest Dr Jacksonville, FL | 2.0 | 1.5 | 900 | $1,099 | $1.22 | 7d | 1 | 0.71mi |
| 5985 Windsor Forest Dr Unit 15 Jacksonville, FL | 2.0 | 1.5 | 900 | $999 | $1.11 | 7d | 1 | 0.71mi |
| 5931 Wilmar Rd Jacksonville, FL | 4.0 | 1.0 | 706 | $1,095 | $1.55 | 23d | 1 | 0.75mi |
| 5913 Tampico Rd Jacksonville, FL | 3.0 | 1.0 | 1110 | $1,348 | $1.21 | 13d | 1 | 0.75mi |
| 5933 Jammes Rd Jacksonville, FL | 3.0 | 3.0 | 1071 | $1,900 | $1.77 | 23d | 1 | 0.76mi |
| 5951 Wilmar Rd Jacksonville, FL | 2.0 | 1.0 | 706 | $1,095 | $1.55 | 23d | 1 | 0.77mi |
| 5984 Creekside Crossing Dr Jacksonville, FL | 3.0 | 2.5 | 1404 | $1,695 | $1.21 | 14d | 1 | 0.84mi |
| 5988 Creekside Crossing Dr Jacksonville, FL | 3.0 | 2.5 | 1404 | $1,850 | $1.32 | 14d | 1 | 0.84mi |
| 5958 Creekside Crossing Dr Jacksonville, FL | 3.0 | 2.5 | 1404 | $1,895 | $1.35 | 10d | 1 | 0.85mi |
| 6236 Autlan Dr Jacksonville, FL | 3.0 | 2.0 | 1299 | $1,555 | $1.20 | 4d | 1 | 0.88mi |
| 4442 Georgetown Dr Jacksonville, FL | 3.0 | 2.0 | 1259 | $1,386 | $1.10 | 3d | 1 | 0.90mi |
| 5816 Sonora Dr W Jacksonville, FL | 3.0 | 1.0 | 975 | $1,580 | $1.62 | 17d | 1 | 0.92mi |
| 6715 Cotton Tail Ln Jacksonville, FL | 3.0 | 1.5 | 1120 | $1,450 | $1.29 | 14d | 1 | 0.94mi |
| 6019 Verdes Rd Jacksonville, FL | 3.0 | 1.0 | 1209 | $1,335 | $1.10 | 23d | 1 | 0.97mi |
| 7262 Kivler Dr Jacksonville, FL | 3.0 | 1.0 | 759 | $1,499 | $1.97 | 23d | 1 | 0.98mi |
Listing history 16 events
-
2026-06-18days on market $200,000 Active 76 DOM
-
2026-06-17days on market $200,000 Active 75 DOM
-
2026-06-16days on market $200,000 Active 74 DOM
-
2026-06-15days on market $200,000 Active 73 DOM
-
2026-06-13days on market $200,000 Active 70 DOM
-
2026-06-10days on market $200,000 Active 67 DOM
-
2026-06-08days on market $200,000 Active 66 DOM
-
2026-06-07days on market $200,000 Active 65 DOM
-
2026-06-03days on market $200,000 Active 61 DOM
-
2026-06-02days on market $200,000 Active 60 DOM
-
2026-06-01days on market $200,000 Active 59 DOM
-
2026-05-31days on market $200,000 Active 58 DOM
-
2026-05-18price $200,000
-
2026-04-03price $210,000
-
2026-03-31$200,000 Active
-
1996-05-06soldstatus $60,500
ⓘ Source: listings_history table (triggers on properties + properties_extension) + one-shot
backfill from property_details.listing_events for pre-trigger history.
Tax reassessment forecast FL · Resets to sale price
- Current annual tax
- $632 · $53/mo
- Projected year-2 tax
- $1,660 · $138/mo
- Expected delta
- +$1,028/yr (+$86/mo · 162.7%)
ⓘ Screening estimate from a state-policy table — verify with the county assessor before closing.
Climate risk First Street
- Flood 1/10 Low FEMA zone X (unshaded) · 0% chance over 30 yrs
- Wildfire 2/10 Low
- Heat 8/10 Severe 7 d/yr ≥107°F today · 20 d/yr by 30 yrs out
- Wind 10/10 Extreme 99% chance of damaging wind over 30 yrs
- Air quality 5/10 Major 6 unhealthy d/yr today · 7 by 30 yrs out
Nearby sold comps map
Loading sold comps map…
Walkable amenities ~0.75 mi
Loading nearby amenities…
Taxation est. · year 1
- Rental income
- $18,070
- − Mortgage interest
- −$11,203
- − Property taxes
- −$632
- − Insurance
- −$1,000
- − Repairs & maintenance
- −$1,446
- − Management
- −$1,446
- − Depreciation
- −$5,818
- Taxable loss
- −$3,475
- Est. tax savings @ 24.0%
- +$834
- After-tax cash flow
- $891/yr
For passive investors: Depreciation is non-cash, so a rental often shows a tax loss while cash-flowing — sheltering income. Rental losses are passive: they offset passive income freely, and up to $25,000/yr can offset ordinary (W-2) income if you actively participate and your MAGI is under $100k (phasing out to $0 by $150k); unused losses carry forward. On sale, claimed depreciation is recaptured at up to 25%, and gains may owe capital-gains tax (a 1031 exchange can defer both). Figures are a year-1 estimate at your 24.0% rate — not tax advice; consult a CPA.
Schools (NCES district)
- District
- Duval
- NCES district ID
- 1200480
- Math proficiency
- 46% ▼ -11.00%
- Reading proficiency
- 45% ▼ -4.00%
- Median HH income
- $48,987
- Composite
- 38.97/100
- National rank
- #4076
- State rank
- #48 of 73 in FL
Livability — Jacksonville
- Score
- 83/100
- State rank
- #50
- US rank
- #911
Category grades
Schools grade is shown separately in the Schools card above.
Census & demographics
- Census place
- Jacksonville, FL
- County
- Duval County · 1,015,274 people
- City population
- 979,034
- Metro
- Jacksonville, FL
- Population (ZIP)
- 65,729
- Household income
- $61,050
- Rent vs Own
- Severe rent burden
- 3605.0
Population outlook (Duval County) Hauer SSP2
- Today (2025)
- 1,013,010 people
- By 2030
- 1,059,228 · +4.6%
- By 2040
- 1,141,439 · +12.7%
- By 2050
- 1,205,258 · +19.0%
- By 2075
- 1,324,282 · +30.7%
- By 2100
- 1,319,620 · +30.3%
Race, ethnicity, and origin ACS 2023
- Neighborhood character
- Diverse neighborhood (Simpson 0.65)
- Race & ethnicity
- White 43% Black 38% Hispanic / Latino 10% Two or more races 7% Asian 3%
- Hispanic origin (detail)
- Mexican 3% Puerto Rican 3%
- Common ancestry
- Slovak 2% Hispanic 2% Italian 1%
- Foreign-born
- 10% · Canada, Vietnam, China
- Languages at home
- 86% English-only · Spanish 7% French/Haitian/Cajun 2% Tagalog/Filipino 1%
Political lean MEDSL · Duval
- 2024 margin
- Toss-up / Even · D 48.7% · R 50.1% · Other 1.2%
- 2008→2024 swing
- +0.4pp no change · 2008: -1.9pp · 2024: -1.5pp
- All cycles
- 2024: R+1.5 2020: D+3.8 2016: R+1.5 2012: R+3.6 2008: R+1.9
Not yet ingested
- Civics
- —
Market trends
- HPI YoY
- ▼ -314.81%
- Current HPI
- 281.2688
- Rent YoY
- ▲ 2.11%
- Metro
- Jacksonville, FL
- State GDP YoY
- ▲ 3.28%
- F500 in state
- 36
Industry mix (Fortune 500 HQ in FL)
| Industry | F500 HQs | Revenue |
|---|---|---|
| Industrial Technology | 2 | $29B |
|
||
| Insurance | 2 | $17B |
|
||
| Retail | 1 | $60B |
|
||
| Technology Distribution | 1 | $58B |
|
||
| Homebuilding | 1 | $35B |
|
||
| Technology Manufacturing | 1 | $35B |
|
||
Price history
+230.6% since first listed4 events — show timeline
- 2026-05-18 Price Changed $200,000 realMLS
- 2026-04-03 Price Changed $210,000 realMLS
- 2026-03-31 Listed $200,000 realMLS
- 1996-05-06 Sold (Public Records) $60,500 Public Records
Property tax history
-0.5%/yrLatest (2025): $632 · +41.0% YoY. Source: county tax records.
Cash-flow waterfall
monthlySold comps — $/sqft
last 12 mo · ≤1 miLoading sold comps…