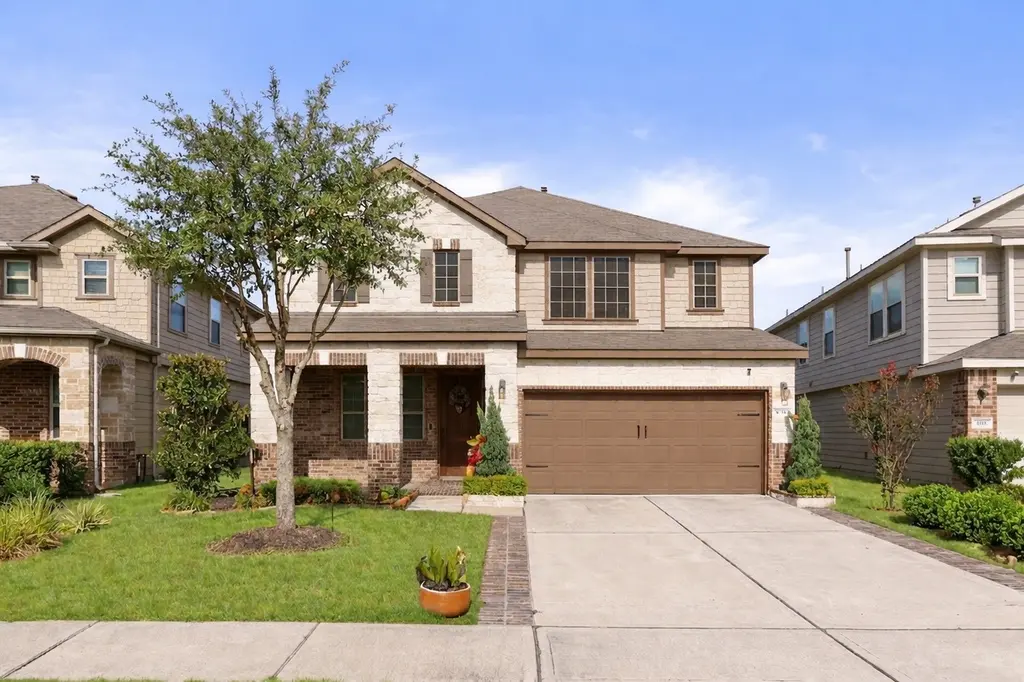
4230 Lake Cypress Cir · Houston, TX
Flood risk 6/10 · Moderate
- FEMA flood zone
- X (unshaded)
- Chance of flooding over 30 yrs
- 0.7%
- Est. flood insurance / yr
- $507 – $1,088
Fire risk 1/10 · Minimal
- Est. fire insurance / yr
- $1,222 – $2,270
Heat risk 9/10 · Severe
- Hot days now (above 111°F)
- 7 days/yr
- Hot days in 30 yrs
- 23 days/yr
Wind risk 8/10 · Major
- Chance of severe wind over 30 yrs
- 99.0%
Air-quality risk 3/10 · Minor
- Unhealthy air days now
- 3 days/yr
- Unhealthy air days in 30 yrs
- 3 days/yr
Risk factors via First Street. Map © Google.
Why this score? — see what drove the B- grade
The composite is a weighted blend of 9 inputs, each scored 0–100. Each bar is that input's sub-score; the figure is the points it added to the 100-point composite (weight × sub-score).
- Cash flow +30.0/30.0
- 1% rule +10.0/10.0
- DSCR +10.0/10.0
- Appreciation +3.9/10.0
- ARV discount +3.8/15.0
- Livability +3.7/5.0
- Rent growth +2.5/5.0
- Condition / age +2.5/5.0
- Schools +2.0/10.0
$365,000
🖨 Deal sheet (PDF) 📄 Offer letter ✓ Due diligence
Listing remarks MLS
Welcome to this beautifully upgraded 5-bedroom, 2.5-bath home offering over 3,000 square feet of stylish living in Cypress Creek Crossing. From the moment you arrive, the curb appeal shines with custom brickwork, stone accents, and a covered front porch. Inside, you’ll find an open-concept layout with laminate flooring, elegant fixtures, and designer touches. The spacious living, dining, and kitchen areas flow seamlessly together, ideal for entertaining. The kitchen features granite countertops, a stylish backsplash, a breakfast bar, and a wine nook with decorative ironwork. The first-floor primary suite offers comfort, while upstairs includes generously sized secondary bedrooms and a large game room. Step outside to enjoy the screened-in patio with tile flooring and string lights, plus a backyard with a custom walkway, added trees, and a play set. Other highlights include attic decking, upgraded shelving, and a fenced yard. Move-in ready with comfort, style, and thoughtful upgrades.
Key facts
- Covered front porch
- Stylish backsplash
- Stone accents
Tags
Neighborhood map
What this means for you Summary
Snapshot
- This is a 5-bed/3.5-bath single-family listed at $365k.
Deal economics
- At list price, monthly cash flow is $3k ($32k/yr) — positive.
- The deal already cash-flows at list — no discount required.
- Meets the 1% rule at list price ($7k rent vs $365k).
- Recommended offer: $354k (3.0% below list) — sets the bar for market timing.
- Cap rate 15.1% vs local median 3.1% in Houston — top-decile yield for the area; either an underpriced asset or a hidden risk that comps aren't pricing in. Stress-test before assuming the spread holds.
Location & tenants
- Location reads 74/100 on livability (#184 in TX, #4,771 nationally) — a middle-class / working-renter tenant base. Strengths: amenities A+, cost of living A+, housing A+; Watch: schools D, crime F.
- Spring ISD (suburban): math 19% / reading 26% proficiency, ranked #730 of 826 in TX (top 88%) — low school quality limits family demand, transient renter base, plan for 1-2y turnover; 66% free/reduced lunch — lower-income household profile, screen leases tightly.
- Market conditions: 117 active listings in the ZIP; 3 comparable units currently listed for rent nearby; rentals at typical pace (median 23d on market — plan ~3-4 weeks tenant-placement turnaround); 29,883 units permitted in Harris County in 2024 (8,621 in 5+ unit buildings).
Forward outlook
- Local home prices are declining (-2.1%/yr); year-one equity from $3k of loan paydown is wiped out by about $8k of value loss. Plan a longer hold.
- Harris County population projected at +47% by 2050 — long-run rental-demand tailwind backs the buy-and-hold thesis.
- At projected returns (-2.1% appreciation + 3.0% rent growth), your $102k cash investment doubles in ~4 years — after that, you're playing with house money.
Negotiation context
- It's been on market 37 days — a 3% lower offer ($354k) is reasonable based on typical stale-listing flexibility.
- 2 sale attempts with the ask held roughly flat each time — persistent listings suggest the price (not the market) is what's stuck; bring a comps-based counter.
Risks & watch-outs
- Climate carrying-cost: major flood risk; severe wind risk, 99% chance of damaging wind over 30y; extreme-heat days projected 7→23/yr by 2055 (HVAC capex compounding) — expect insurance premiums to compound above CPI over the hold.
Questions for the listing agent
- It's been on market 37 days. Have you received any prior offers? Is the seller open to a 3% concession, seller financing, or rate buy-down credit?
- What does the HOA fee cover, when was the last increase, and are there any pending special assessments or reserve-fund shortfalls?
- Is there a deadline driving the sale (1031 exchange, divorce, estate, relocation)? That informs how much negotiation room exists.
- Schools are D-rated, which usually means shorter tenancies and higher turnover. Who's the typical renter profile here, and what's been the actual vacancy rate?
- Crime grade is F in this area — have there been break-ins, vandalism, or insurance claims at this property in the last 3 years? What carrier currently insures it and at what premium?
- What's the average days-on-market for RENTAL listings here right now (not sales)? A rising rental-DOM trend means longer vacancies and softer asking-rent achievability than the comps imply.
- What's the recent tenant-quality profile in this submarket — average credit score on applications, eviction rate, late-payment / NSF rate, and stable-employment percentage? A property-management company in the area should have these aggregated.
- How much new for-sale + rental construction is in the pipeline within 1–3 miles? Heavy new supply typically softens prices + rents 12–24 months out; constrained supply supports both.
Investment metrics
- 1% rule
- 1.91% ✓
- Cap rate
- 15.13%
- Cash-on-cash
- 31.56%
- DSCR
- 2.40
- GRM
- 4.4
CMA / ARV
- ARV (median comp)
- $336,975
- List price
- $365,000
- Delta
- 8.32%
- Verdict
- FAIR
- Comps
- 20 within 1.0 mi
Show comp detail 12 sales within ~0.75 mi
| Address | Dist | Beds/Ba | Sqft | Sold | Price | $/sf | Match |
|---|---|---|---|---|---|---|---|
| 4306 Lake Cypress Cir | 0.06mi | 5/2.5 | 3,250 (+7%) | 6mo | $409,379 | $126 | 77 |
| 4118 Streambed Trl | 0.22mi | 4/2.5 (-1) | 2,979 (-2%) | 6mo | $359,999 | $121 | 73 |
| 15515 San Milo Dr | 0.62mi | 4/3.5 (-1) | 3,056 (+1%) | 2mo | $345,000 | $113 | 64 |
| 4022 Streambed Trl | 0.27mi | 4/2.5 (-1) | 2,792 (-8%) | 2mo | $325,000 | $116 | 63 |
| 4215 False Cypress Ln | 0.13mi | 4/2.5 (-1) | 2,596 (-15%) | 3mo | $285,000 | $110 | 58 |
| 14538 Bending Maple Dr | 0.71mi | 4/2.5 (-1) | 3,020 (-1%) | 1mo | $375,000 | $124 | 56 |
| 3818 Gladeridge Dr | 0.61mi | 4/2.5 (-1) | 3,068 (+1%) | 6mo | $335,000 | $109 | 56 |
| 4418 Windmill Run Dr | 0.52mi | 4/3.0 (-1) | 2,760 (-9%) | 0mo | $332,000 | $120 | 53 |
| 15406 Falling Creek Dr | 0.68mi | 4/2.5 (-1) | 2,950 (-3%) | 3mo | $315,000 | $107 | 51 |
| 15518 San Milo Dr | 0.65mi | 4/3.5 (-1) | 3,383 (+11%) | 2mo | $329,000 | $97 | 44 |
| 14543 Overland Hollow Dr | 0.50mi | 4/3.0 (-1) | 2,606 (-14%) | 5mo | $334,900 | $129 | 42 |
| 15007 Walters Rd | 0.73mi | 4/2.5 (-1) | 2,730 (-10%) | 1mo | $279,900 | $103 | 39 |
Match score weights: distance 35% · size 25% · config 20% · recency 20%. Top-matched comps best support the ARV.
Projected returns pro-forma
-2.14% appreciation · 3.0% rent growth · sell at horizon
- IRR
- 28.2%
- Equity multiple
- 2.23×
- Total profit
- $125,708
- Equity at exit
- $68,640
- IRR
- 34.6%
- Equity multiple
- 4.36×
- Total profit
- $342,941
- Equity at exit
- $56,529
Cash invested: $102,200 (down + closing). Projections, not guarantees.
Landlord ↔ Tenant lean methodology
- Overall (STATE)
- 87 Strongly Landlord-Friendly
- State Texas
- 87 Strongly Landlord-Friendly · R+5
- County
- — inherits STATE
- City
- — inherits STATE
ZIP-level market 77068
- Home prices YoY
- -1.0%
- Active inventory
- 117
- Price-to-rent
- 4.4×
Monthly cashflow live
- Estimated rent
- $6,988 medium interval (Pro) →
- Mortgage (P&I)
- −$1,914
- Tax from tax record
- −$697 /mo · $8,366/yr
- Insurance
- −$152
- HOA
- −$69
- Vacancy / Maint / Mgmt
- −$1,467
- Net cashflow
- $2,688
Break-even live
Sensitivity live
| Price | -10% $2,895 | -5% $2,791 | +0% $2,688 | +5% $2,585 | +10% $2,481 |
|---|---|---|---|---|---|
| Rent | -10% $2,136 | -5% $2,412 | +0% $2,688 | +5% $2,964 | +10% $3,240 |
| Rate | -1.0pp $2,872 | -0.5pp $2,781 | base $2,688 | +0.5pp $2,593 | +1.0pp $2,497 |
UW: 25.0% down · 7.5% · 30yr · 1.5% tax · 5.0% vac · 8.0% maint · 8.0% mgmt
Financing live
Cash to close
- Down payment
- $91,250
- Closing costs
- $10,950
- Reserves months
- —
- Total cash needed
- —
Loan-product check · same deal, 3 products live
Conventional
25% down · 7.5% · 30yr
- Down + closing
- —
- Monthly P&I
- —
- Monthly cashflow
- —
- DSCR
- —
- Eligible?
- —
Personal DTI + credit; lowest rate.
DSCR
20% down · 8.5% · 30yr
- Down + closing
- —
- Monthly P&I
- —
- Monthly cashflow
- —
- DSCR
- —
- Eligible?
- —
No personal income docs; deal must DSCR.
Hard money
10% down · 12.0% · 12mo
- Down + closing
- —
- Monthly P&I
- —
- Monthly cashflow
- —
- DSCR
- —
- Eligible?
- —
Short-term bridge; refi at stabilization.
Rent comps 3 comps
| Address | Beds | Baths | Sqft | Rent | $/sqft | DOM | Units | Dist |
|---|---|---|---|---|---|---|---|---|
| 4622 Falling Sun Dr Houston, TX | 4.0 | 3.0 | 2485 | $2,500 | $1.01 | 44d | 1 | 0.55mi |
| 5135 Westerham Pl Unit 1262307P Houston, TX | 5.0 | 3.5 | 3358 | $17,582 | $5.24 | 22d | 1 | 1.10mi |
| 5415 Olympia Fields Ln Houston, TX | 4.0 | 4.0 | 4163 | $3,500 | $0.84 | 4d | 1 | 1.23mi |
HOA detail
- Monthly dues
- $69 · $828/yr
Listing history 6 events
-
2026-04-22$365,000 Active 1004-char remark
Show marketing remark (1004 chars)
Welcome to this beautifully upgraded 5-bedroom, 2.5-bath home offering over 3,000 square feet of stylish living in Cypress Creek Crossing. From the moment you arrive, the curb appeal shines with custom brickwork, stone accents, and a covered front porch. Inside, you’ll find an open-concept layout with laminate flooring, elegant fixtures, and designer touches. The spacious living, dining, and kitchen areas flow seamlessly together, ideal for entertaining. The kitchen features granite countertops, a stylish backsplash, a breakfast bar, and a wine nook with decorative ironwork. The first-floor primary suite offers comfort, while upstairs includes generously sized secondary bedrooms and a large game room. Step outside to enjoy the screened-in patio with tile flooring and string lights, plus a backyard with a custom walkway, added trees, and a play set. Other highlights include attic decking, upgraded shelving, and a fenced yard. Move-in ready with comfort, style, and thoughtful upgrades.
-
2026-04-19historical
-
2026-03-20price $379,900
-
2026-03-10price $389,900
-
2025-10-27price $399,900
-
2025-10-07$400,000 Active
ⓘ Source: listings_history table (triggers on properties + properties_extension) + one-shot
backfill from property_details.listing_events for pre-trigger history.
Tax reassessment forecast TX · Resets to sale price
- Current annual tax
- $8,366 · $697/mo
- Projected year-2 tax
- $8,366 · $697/mo
- Expected delta
- $0/yr ($0/mo · 0.0%)
ⓘ Screening estimate from a state-policy table — verify with the county assessor before closing.
Climate risk First Street
- Flood 6/10 Major FEMA zone X (unshaded) · 70% chance over 30 yrs
- Wildfire 1/10 Low
- Heat 9/10 Extreme 7 d/yr ≥111°F today · 23 d/yr by 30 yrs out
- Wind 8/10 Severe 99% chance of damaging wind over 30 yrs
- Air quality 3/10 Moderate 3 unhealthy d/yr today · 3 by 30 yrs out
Nearby sold comps map
Loading sold comps map…
Walkable amenities ~0.75 mi
Loading nearby amenities…
Taxation est. · year 1
- Rental income
- $83,852
- − Mortgage interest
- −$20,446
- − Property taxes
- −$8,366
- − Insurance
- −$1,825
- − Repairs & maintenance
- −$6,708
- − Management
- −$6,708
- − HOA
- −$828
- − Depreciation
- −$10,618
- Taxable income
- $28,353
- Est. tax owed @ 24.0%
- −$6,805
- After-tax cash flow
- $25,450/yr
For passive investors: Depreciation is non-cash, so a rental often shows a tax loss while cash-flowing — sheltering income. Rental losses are passive: they offset passive income freely, and up to $25,000/yr can offset ordinary (W-2) income if you actively participate and your MAGI is under $100k (phasing out to $0 by $150k); unused losses carry forward. On sale, claimed depreciation is recaptured at up to 25%, and gains may owe capital-gains tax (a 1031 exchange can defer both). Figures are a year-1 estimate at your 24.0% rate — not tax advice; consult a CPA.
Schools (NCES district)
- District
- Spring ISD
- NCES district ID
- 4841220
- Math proficiency
- 19% ▼ -13.00%
- Reading proficiency
- 26% ▼ -6.00%
- Median HH income
- $51,584
- Composite
- 20.12/100
- National rank
- #8643
- State rank
- #730 of 826 in TX
Livability — Houston
- Score
- 74/100
- State rank
- #184
- US rank
- #4771
Category grades
Schools grade is shown separately in the Schools card above.
Census & demographics
- City population
- 3,226,434
- Population (ZIP)
- 12,289
Population outlook (Harris County) Hauer SSP2
- Today (2025)
- 5,571,493 people
- By 2030
- 6,089,821 · +9.3%
- By 2040
- 7,142,806 · +28.2%
- By 2050
- 8,185,864 · +46.9%
- By 2075
- 10,574,329 · +89.8%
- By 2100
- 12,109,958 · +117.4%
Race, ethnicity, and origin ACS 2023
- Neighborhood character
- Highly diverse neighborhood (Simpson 0.72)
- Race & ethnicity
- Hispanic / Latino 35% Black 31% White 23% Two or more races 11% Asian 6% Native American 1%
- Hispanic origin (detail)
- Mexican 27%
- Common ancestry
- Scandinavian 2% Romanian 1% Serbian 1%
- Foreign-born
- 21% · Canada, Vietnam, China
- Languages at home
- 65% English-only · Spanish 28% Vietnamese 4% Chinese 1%
Political lean MEDSL · Harris
- 2024 margin
- Lean D (+5.5) · D 52.0% · R 46.4% · Other 1.6%
- 2008→2024 swing
- +3.9pp toward D · 2008: 1.6pp · 2024: 5.5pp
- All cycles
- 2024: D+5.5 2020: D+13.3 2016: D+12.4 2012: D+0.1 2008: D+1.6
Not yet ingested
- Civics
- —
Market trends
- HPI YoY
- ▼ -2.14%
- Current HPI
- 206.5475
- Rent YoY
- —
- Metro
- —
- State GDP YoY
- ▲ 3.95%
- F500 in state
- 110
Industry mix (Fortune 500 HQ in TX)
| Industry | F500 HQs | Revenue |
|---|---|---|
| Energy | 16 | $1,198B |
|
||
| Technology | 5 | $198B |
|
||
| Engineering / Construction | 4 | $72B |
|
||
| Energy Services | 3 | $60B |
|
||
| Utilities | 3 | $41B |
|
||
| Healthcare | 2 | $330B |
|
||
Price history
-8.8% since first listed6 events — show timeline
- 2026-04-22 Listed $365,000 HARMLS
- 2026-04-19 Listing Removed — HARMLS
- 2026-03-20 Price Changed $379,900 HARMLS
- 2026-03-10 Price Changed $389,900 HARMLS
- 2025-10-27 Price Changed $399,900 HARMLS
- 2025-10-07 Listed $400,000 HARMLS
Property tax history
+34.5%/yrLatest (2025): $8,366 · +6.7% YoY. Source: county tax records.
Cash-flow waterfall
monthlySold comps — $/sqft
last 12 mo · ≤1 miLoading sold comps…