107 E 11th · Kemp, TX
Flood risk 1/10 · Minimal
- FEMA flood zone
- X (unshaded)
- Chance of flooding over 30 yrs
- 0.0%
- Est. flood insurance / yr
- $507 – $1,088
Fire risk 5/10 · Moderate
- Est. fire insurance / yr
- $1,222 – $2,270
Heat risk 7/10 · Major
- Hot days now (above 110°F)
- 7 days/yr
- Hot days in 30 yrs
- 26 days/yr
Wind risk 6/10 · Moderate
- Chance of severe wind over 30 yrs
- 50.0%
Air-quality risk 2/10 · Minimal
- Unhealthy air days now
- 0 days/yr
- Unhealthy air days in 30 yrs
- 1 days/yr
Risk factors via First Street. Map © Google.
Why this score? — see what drove the F grade
The composite is a weighted blend of 9 inputs, each scored 0–100. Each bar is that input's sub-score; the figure is the points it added to the 100-point composite (weight × sub-score).
- Cash flow +7.7/30.0
- ARV discount +7.5/15.0
- Livability +3.2/5.0
- 1% rule +2.6/10.0
- Schools +2.6/10.0
- Rent growth +2.5/5.0
- Condition / age +2.5/5.0
- DSCR +1.8/10.0
- Appreciation +0.0/10.0
$189,000
🖨 Deal sheet (PDF) 📄 Offer letter ✓ Due diligence
Listing remarks MLS
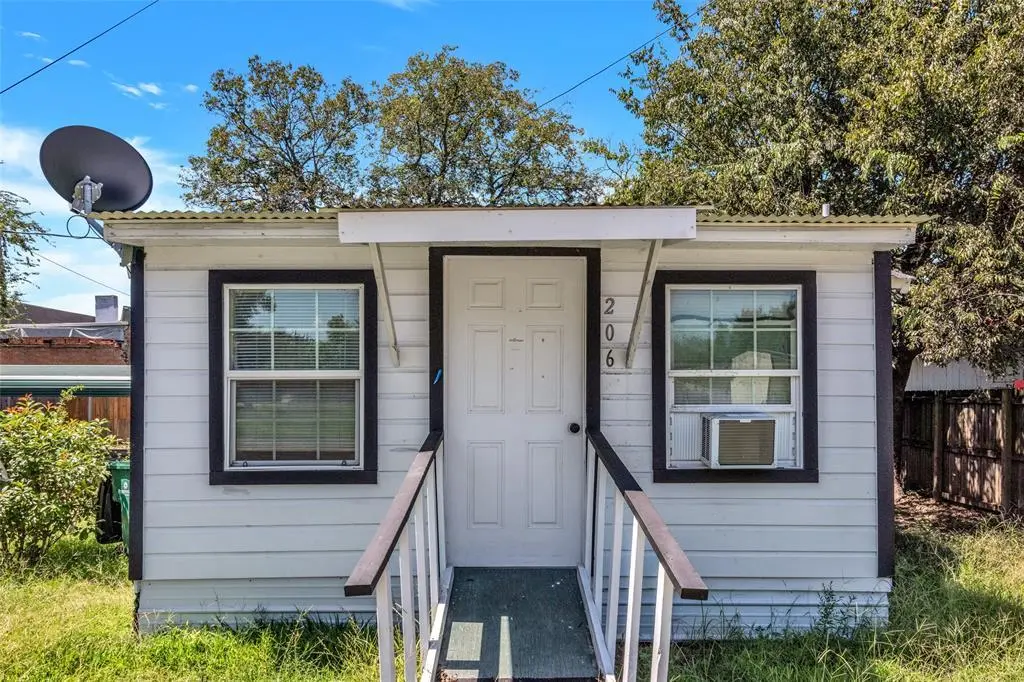
Very cute TWO full one bedroom houses near downtown Kemp! Both have closed in porches, small storage, very well maintained homes! Could also be used for commercial property!
Key facts
- 7,439 sq ft lot
- Parking
- Built 1900
Property features AI
Finance
- Other: Two buildings totaling two units; Building area reported (public records) as 1,336 total
- Financial info: Treated as clear loan type; Capitalization rate approximately 11.44%; Gross annual income reported at $25,620; Gross annual expenses reported at $2,490; Net operating income reported at $21,630; Operating expenses include insurance, maintenance (including grounds), manager, and mortgage/loans; Insurance expense listed as $1,500
- HOA & community: No association
Exterior
- Parking: Covered parking; 1 parking space
- Utilities: City water; City sewer; Not in a municipal utility district
- Home design: Duplex residential income property; One level; Facing information not provided
- Construction: Vinyl siding; Composition roof; Pillar/post/pier foundation; Built in 1900 (preowned)
- Exterior features: Lot roughly 74.39 x 100 (about 0.17 acres)
Interior
- Kitchen: Electric oven
- Bedrooms: 2 bedrooms
- Flooring: Laminate flooring
- Bathrooms: 1 full bathroom
- Heating & cooling: Propane heating; Wall/window cooling unit(s)
- Interior features: Accessible approach with ramp; Other interior features
Neighborhood map
What this means for you Summary
Snapshot
- This is a 4-bed/2.0-bath single-family listed at $189k.
Deal economics
- At list price, monthly cash flow is $-221 ($-3k/yr) — negative.
- To cash-flow at today's rent, offer at most $150k (20.7% below list).
- To meet the 1% rule (rent ≥ 1% of price), the offer needs to be $143k (24.3% below list).
- Recommended offer: $143k (24.3% below list) — sets the bar for 1% rule.
- Cap rate 4.9% vs local median 1.6% in Kemp — top-decile yield for the area; either an underpriced asset or a hidden risk that comps aren't pricing in. Stress-test before assuming the spread holds.
Location & tenants
- Location reads 64/100 on livability (#817 in TX) — a middle-class / working-renter tenant base. Strengths: cost of living A+, housing A+, crime A-; Watch: amenities F, commute F, employment F.
- Kemp ISD (rural): math 33% / reading 29% proficiency, ranked #605 of 826 in TX (top 73%) — families likely to look elsewhere, expect single-tenant / working-renter base with shorter leases.
- Zoned schools: Kemp Pri (503 students, 81% FRL); Kemp J H (math 28% / reading 26%, grade F, #1,177 of 1,662 statewide, top 72%, 401 students, 75% FRL); Kemp H S (math 32% / reading 37%, grade F, #963 of 1,632 statewide, top 61%, 543 students, 57% FRL) — zoned schools average 71% FRL vs 54% district-wide (16 pts higher); higher-poverty schools than district average — tighter screening recommended.
- Market conditions: 442 active listings in the ZIP; 1,747 units permitted in Kaufman County in 2024 (180 in 5+ unit buildings).
Forward outlook
- Local home prices are declining (-3.0%/yr); year-one equity from $1k of loan paydown is wiped out by about $6k of value loss. Plan a longer hold.
- Kaufman County population projected at +43% by 2050 — long-run rental-demand tailwind backs the buy-and-hold thesis.
Negotiation context
- It's been on market 20 days — a 2% lower offer ($186k) is reasonable based on typical stale-listing flexibility.
- 6 sale attempts since 8y ago with the ask held roughly flat each time — persistent listings suggest the price (not the market) is what's stuck; bring a comps-based counter.
Risks & watch-outs
- Watch-outs: built in 1900 — expect roof / HVAC / electrical / plumbing capex.
- Climate carrying-cost: major wind risk, 50% chance of damaging wind over 30y; moderate wildfire risk; extreme-heat days projected 7→26/yr by 2055 (HVAC capex compounding) — expect insurance premiums to compound above CPI over the hold.
Questions for the listing agent
- What do current leases actually rent for vs. the listed asking? Can we see a recent rent roll and the last 12 months of T-12 income?
- Built in 1900 — when were the roof, HVAC, electrical panel, plumbing, and water heater last replaced?
- Is there a deadline driving the sale (1031 exchange, divorce, estate, relocation)? That informs how much negotiation room exists.
- Schools are D-rated, which usually means shorter tenancies and higher turnover. Who's the typical renter profile here, and what's been the actual vacancy rate?
- The area grade is low — what's the realistic commute time and amenity access for the typical tenant pool here? Any planned neighborhood developments (good or bad) we should know about?
- What's the average days-on-market for RENTAL listings here right now (not sales)? A rising rental-DOM trend means longer vacancies and softer asking-rent achievability than the comps imply.
- What's the recent tenant-quality profile in this submarket — average credit score on applications, eviction rate, late-payment / NSF rate, and stable-employment percentage? A property-management company in the area should have these aggregated.
- How much new for-sale + rental construction is in the pipeline within 1–3 miles? Heavy new supply typically softens prices + rents 12–24 months out; constrained supply supports both.
Investment metrics
- 1% rule
- 0.76% ✗
- Cap rate
- 4.89%
- Cash-on-cash
- -5.01%
- DSCR
- 0.78
- GRM
- 11.0
CMA / ARV
No comps found within radius.
Projected returns pro-forma
-3.0% appreciation · 3.0% rent growth · sell at horizon
- IRR
- -24.8%
- Equity multiple
- 0.16×
- Total profit
- $-44,656
- Equity at exit
- $28,181
- IRR
- -20.4%
- Equity multiple
- -0.07×
- Total profit
- $-56,813
- Equity at exit
- $16,341
Cash invested: $52,920 (down + closing). Projections, not guarantees.
Landlord ↔ Tenant lean methodology
- Overall (STATE)
- 87 Strongly Landlord-Friendly
- State Texas
- 87 Strongly Landlord-Friendly · R+5
- County
- — inherits STATE
- City
- — inherits STATE
ZIP-level market 75143
- Home prices YoY
- -11.4%
- Active inventory
- 442
- Price-to-rent
- 11.0×
Monthly cashflow live
- Estimated rent
- $1,432 medium interval (Pro) →
- Mortgage (P&I)
- −$991
- Tax from tax record
- −$282 /mo · $3,385/yr
- Insurance
- −$79
- HOA
- −$0
- Vacancy / Maint / Mgmt
- −$301
- Net cashflow
- $-221
Break-even live
Sensitivity live
| Price | -10% $-114 | -5% $-168 | +0% $-221 | +5% $-275 | +10% $-328 |
|---|---|---|---|---|---|
| Rent | -10% $-334 | -5% $-278 | +0% $-221 | +5% $-165 | +10% $-108 |
| Rate | -1.0pp $-126 | -0.5pp $-173 | base $-221 | +0.5pp $-270 | +1.0pp $-320 |
UW: 25.0% down · 7.5% · 30yr · 1.5% tax · 5.0% vac · 8.0% maint · 8.0% mgmt
Financing live
Cash to close
- Down payment
- $47,250
- Closing costs
- $5,670
- Reserves months
- —
- Total cash needed
- —
Loan-product check · same deal, 3 products live
Conventional
25% down · 7.5% · 30yr
- Down + closing
- —
- Monthly P&I
- —
- Monthly cashflow
- —
- DSCR
- —
- Eligible?
- —
Personal DTI + credit; lowest rate.
DSCR
20% down · 8.5% · 30yr
- Down + closing
- —
- Monthly P&I
- —
- Monthly cashflow
- —
- DSCR
- —
- Eligible?
- —
No personal income docs; deal must DSCR.
Hard money
10% down · 12.0% · 12mo
- Down + closing
- —
- Monthly P&I
- —
- Monthly cashflow
- —
- DSCR
- —
- Eligible?
- —
Short-term bridge; refi at stabilization.
Listing history 14 events
-
2026-06-21days on market $189,000 Active 20 DOM
-
2026-06-18days on market $189,000 Active 17 DOM
-
2026-06-17days on market $189,000 Active 16 DOM
-
2026-06-16days on market $189,000 Active 15 DOM
-
2026-06-15days on market $189,000 Active 14 DOM
-
2026-06-13days on market $189,000 Active 12 DOM
-
2026-06-13days on market $189,000 Active 11 DOM
-
2026-06-09days on market $189,000 Active 8 DOM
-
2026-06-08days on market $189,000 Active 7 DOM
-
2026-06-07days on market $189,000 Active 6 DOM
-
2026-06-04days on market $189,000 Active 3 DOM
-
2026-06-03days on market $189,000 Active 2 DOM
-
2026-06-02remarks 468-char remark
-
2026-06-02$189,000 Active 1 DOM
ⓘ Source: listings_history table (triggers on properties + properties_extension) + one-shot
backfill from property_details.listing_events for pre-trigger history.
Tax reassessment forecast TX · Resets to sale price
- Current annual tax
- $3,385 · $282/mo
- Projected year-2 tax
- $3,459 · $288/mo
- Expected delta
- +$73/yr (+$6/mo · 2.2%)
ⓘ Screening estimate from a state-policy table — verify with the county assessor before closing.
Climate risk First Street
- Flood 1/10 Low FEMA zone X (unshaded) · 0% chance over 30 yrs
- Wildfire 5/10 Major
- Heat 7/10 Severe 7 d/yr ≥110°F today · 26 d/yr by 30 yrs out
- Wind 6/10 Major 50% chance of damaging wind over 30 yrs
- Air quality 2/10 Low 0 unhealthy d/yr today · 1 by 30 yrs out
Nearby sold comps map
Loading sold comps map…
Walkable amenities ~0.75 mi
Loading nearby amenities…
Taxation est. · year 1
- Rental income
- $17,179
- − Mortgage interest
- −$10,587
- − Property taxes
- −$3,385
- − Insurance
- −$945
- − Repairs & maintenance
- −$1,374
- − Management
- −$1,374
- − Depreciation
- −$5,498
- Taxable loss
- −$5,985
- Est. tax savings @ 24.0%
- +$1,436
- After-tax cash flow
- $-1,216/yr
For passive investors: Depreciation is non-cash, so a rental often shows a tax loss while cash-flowing — sheltering income. Rental losses are passive: they offset passive income freely, and up to $25,000/yr can offset ordinary (W-2) income if you actively participate and your MAGI is under $100k (phasing out to $0 by $150k); unused losses carry forward. On sale, claimed depreciation is recaptured at up to 25%, and gains may owe capital-gains tax (a 1031 exchange can defer both). Figures are a year-1 estimate at your 24.0% rate — not tax advice; consult a CPA.
Schools (NCES district)
- District
- Kemp ISD
- NCES district ID
- 4825320
- Math proficiency
- 33% ▼ -11.00%
- Reading proficiency
- 29% ▼ -5.00%
- Median HH income
- $42,788
- Composite
- 26.37/100
- National rank
- #7233
- State rank
- #605 of 826 in TX
Livability — Kemp
- Score
- 64/100
- State rank
- #817
- US rank
- #14816
Category grades
Schools grade is shown separately in the Schools card above.
Census & demographics
- Census place
- Kemp, TX
- Population (ZIP)
- 14,676
Population outlook (Kaufman County) Hauer SSP2
- Today (2025)
- 138,716 people
- By 2030
- 150,815 · +8.7%
- By 2040
- 174,877 · +26.1%
- By 2050
- 198,020 · +42.8%
- By 2075
- 251,908 · +81.6%
- By 2100
- 285,325 · +105.7%
Race, ethnicity, and origin ACS 2023
- Neighborhood character
- Predominantly White (80%)
- Race & ethnicity
- White 80% Hispanic / Latino 13% Two or more races 8% Black 2%
- Hispanic origin (detail)
- Mexican 13%
- Common ancestry
- Italian 2% Iranian 2% Lithuanian 1%
- Foreign-born
- 4% · Canada, China
- Languages at home
- 90% English-only · Spanish 9%
Political lean MEDSL · Kaufman
- 2024 margin
- Strong R (+27.9) · D 35.6% · R 63.5%
- 2008→2024 swing
- +7.9pp toward D · 2008: -35.8pp · 2024: -27.9pp
- All cycles
- 2024: R+27.9 2020: R+33.9 2016: R+47.0 2012: R+44.4 2008: R+35.8
Not yet ingested
- Civics
- —
Market trends
- HPI YoY
- ▼ -42.99%
- Current HPI
- 332.57
- Rent YoY
- —
- Metro
- —
- State GDP YoY
- ▲ 3.95%
- F500 in state
- 110
Industry mix (Fortune 500 HQ in TX)
| Industry | F500 HQs | Revenue |
|---|---|---|
| Energy | 16 | $1,198B |
|
||
| Technology | 5 | $198B |
|
||
| Engineering / Construction | 4 | $72B |
|
||
| Energy Services | 3 | $60B |
|
||
| Utilities | 3 | $41B |
|
||
| Healthcare | 2 | $330B |
|
||
Price history
+80.0% since first listed22 events — show timeline
- 2026-06-01 Listed $189,000 NTREIS
- 2025-11-19 Listing Removed — NTREIS
- 2025-09-04 Price Changed $189,000 NTREIS
- 2025-06-20 Price Changed $199,000 NTREIS
- 2025-06-12 Listed $200,000 NTREIS
- 2024-07-08 Rental Removed $1,000 NTREIS
- 2024-06-12 Listed for Rent $1,000 NTREIS
- 2024-01-24 Rental Removed $1,100 NTREIS
- 2024-01-16 Listed for Rent $1,100 NTREIS
- 2023-08-02 Sold (Public Records) — Public Records
- 2022-11-14 Sold (Public Records) — Public Records
- 2021-06-07 Sold (Public Records) — Public Records
- 2021-06-02 Sold (MLS) — NTREIS
- 2021-05-02 Pending — NTREIS
- 2021-02-25 Price Changed $85,000 NTREIS
- 2020-11-04 Price Changed $110,000 NTREIS
- 2020-09-10 Listed $125,000 NTREIS
- 2018-11-08 Listing Removed — NTREIS
- 2018-09-14 Price Changed $85,000 NTREIS
- 2018-08-14 Price Changed $95,000 NTREIS
- 2018-07-21 Listed $105,000 NTREIS
- 2017-02-13 Sold (Public Records) — Public Records
Property tax history
+13.9%/yrLatest (2025): $3,385 · +36.0% YoY. Source: county tax records.
Cash-flow waterfall
monthlySold comps — $/sqft
last 12 mo · ≤1 miLoading sold comps…