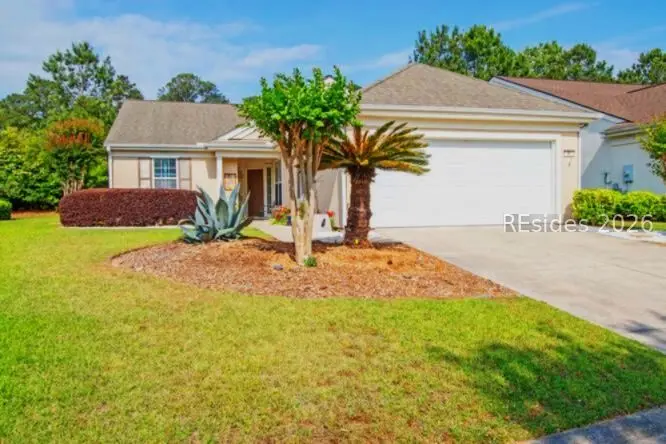
34 Wainwright Dr · Hardeeville, SC
Flood risk 1/10 · Minimal
- FEMA flood zone
- X (unshaded)
- Chance of flooding over 30 yrs
- 0.0%
- Est. flood insurance / yr
- $507 – $1,088
Fire risk 3/10 · Minor
- Est. fire insurance / yr
- $783 – $1,453
Heat risk 10/10 · Severe
- Hot days now (above 108°F)
- 7 days/yr
- Hot days in 30 yrs
- 18 days/yr
Wind risk 8/10 · Major
- Chance of severe wind over 30 yrs
- 99.0%
Air-quality risk 2/10 · Minimal
- Unhealthy air days now
- 2 days/yr
- Unhealthy air days in 30 yrs
- 2 days/yr
Risk factors via First Street. Map © Google.
Why this score? — see what drove the D grade
The composite is a weighted blend of 9 inputs, each scored 0–100. Each bar is that input's sub-score; the figure is the points it added to the 100-point composite (weight × sub-score).
- ARV discount +12.4/15.0
- Cash flow +9.5/30.0
- Rent growth +4.8/5.0
- Schools +4.1/10.0
- Livability +3.2/5.0
- DSCR +2.7/10.0
- Condition / age +2.5/5.0
- 1% rule +1.6/10.0
- Appreciation +0.0/10.0
$399,900
🖨 Deal sheet (PDF) 📄 Offer letter ✓ Due diligence
Listing remarks MLS
New EGRET Model: 2 Bedroom, 2 Bath, with Den. Very spacious layout with plenty of upgrades. Enjoy the lavish lifestyle at Sun City and LIVE ON.
Key facts
- Hurricane shutters
- Private patio
- Eat-in kitchen
Tags
Neighborhood map
What this means for you Summary
Snapshot
- This is a 2-bed/2.0-bath single-family listed at $400k.
Deal economics
- At list price, monthly cash flow is $-276 ($-3k/yr) — negative.
- To cash-flow at today's rent, offer at most $351k (12.2% below list).
- To meet the 1% rule (rent ≥ 1% of price), the offer needs to be $265k (33.6% below list).
- Recommended offer: $265k (33.6% below list) — sets the bar for 1% rule.
- Cap rate 5.5% vs local median 3.6% in Hardeeville — top-decile yield for the area; either an underpriced asset or a hidden risk that comps aren't pricing in. Stress-test before assuming the spread holds.
Location & tenants
- Location reads 65/100 on livability (#136 in SC) — a middle-class / working-renter tenant base. Strengths: health & safety A+, crime B+, housing B+; Watch: amenities F, commute F, cost of living F.
- Beaufort 01 (town): math 42% / reading 51% proficiency, ranked #17 of 80 in SC (top 21%) — families likely to look elsewhere, expect single-tenant / working-renter base with shorter leases.
- Zoned schools: Okatie Elementary (math 67% / reading 62%, grade B, #56 of 597 statewide, top 10%, 609 students, 26% FRL); Bluffton Middle (math 40% / reading 46%, grade D-, #60 of 229 statewide, top 26%, 872 students, 45% FRL); Bluffton High (math 69% / reading 85%, grade A-, #28 of 196 statewide, top 16%, 1,350 students, 38% FRL).
- Zoned-school proficiency averages 62% at this address vs 46% district-wide (+15 pts) — the actual schools serving this property are materially stronger than the Beaufort 01 average implies; a family-tenant draw the district grade alone would hide.
- Market conditions: Rents rising fast (+9.3%/yr); 657 active listings in the ZIP; 11 comparable units currently listed for rent nearby; rentals at typical pace (median 16d on market — plan ~3-4 weeks tenant-placement turnaround); solid renter incomes; 1,824 units permitted in Beaufort County in 2024 (618 in 5+ unit buildings).
- This rent runs 35% of the median local income ($91k/yr) — at the standard rent-burdened threshold; future hikes will face affordability resistance.
Forward outlook
- Local home prices are declining (-3.0%/yr); year-one equity from $3k of loan paydown is wiped out by about $12k of value loss. Plan a longer hold.
- Beaufort County population projected at +30% by 2050 — long-run rental-demand tailwind backs the buy-and-hold thesis.
Negotiation context
- It's been on market 77 days — a 6% lower offer ($376k) is reasonable based on typical stale-listing flexibility.
- 2 sale attempts since 22y ago; this cycle's ask has dropped $30k (7%) from the opening price — seller is motivated, your offer sets the floor, not the list.
- Current owner paid $193k; list at $400k implies a 108% gain — meaningful room to come down on a strong offer.
Risks & watch-outs
- Climate carrying-cost: severe wind risk, 99% chance of damaging wind over 30y; extreme-heat days projected 7→18/yr by 2055 (HVAC capex compounding) — expect insurance premiums to compound above CPI over the hold.
Questions for the listing agent
- What do current leases actually rent for vs. the listed asking? Can we see a recent rent roll and the last 12 months of T-12 income?
- It's been on market 77 days. Have you received any prior offers? Is the seller open to a 34% concession, seller financing, or rate buy-down credit?
- Why hasn't it sold? Are there any deal-killer items the seller is aware of (foundation, flood, title, zoning, code violations)?
- Is there a deadline driving the sale (1031 exchange, divorce, estate, relocation)? That informs how much negotiation room exists.
- Schools are F-rated, which usually means shorter tenancies and higher turnover. Who's the typical renter profile here, and what's been the actual vacancy rate?
- The area grade is low — what's the realistic commute time and amenity access for the typical tenant pool here? Any planned neighborhood developments (good or bad) we should know about?
- What's the average days-on-market for RENTAL listings here right now (not sales)? A rising rental-DOM trend means longer vacancies and softer asking-rent achievability than the comps imply.
- What's the recent tenant-quality profile in this submarket — average credit score on applications, eviction rate, late-payment / NSF rate, and stable-employment percentage? A property-management company in the area should have these aggregated.
- How much new for-sale + rental construction is in the pipeline within 1–3 miles? Heavy new supply typically softens prices + rents 12–24 months out; constrained supply supports both.
Investment metrics
- 1% rule
- 0.66% ✗
- Cap rate
- 5.47%
- Cash-on-cash
- -2.95%
- DSCR
- 0.87
- GRM
- 12.6
CMA / ARV
- ARV (median comp)
- $448,774
- List price
- $399,900
- Delta
- -10.89%
- Verdict
- UNDERPRICED
- Comps
- 20 within 1.0 mi
Show comp detail 12 sales within ~0.75 mi
| Address | Dist | Beds/Ba | Sqft | Sold | Price | $/sf | Match |
|---|---|---|---|---|---|---|---|
| 56 Doncaster Ln | 0.30mi | 2/2.0 | 1,719 (+0%) | 4mo | $369,000 | $215 | 82 |
| 15 Wainwright Dr | 0.11mi | 2/2.0 | 1,554 (-9%) | 1mo | $410,000 | $264 | 79 |
| 7 Sunbeam Dr | 0.55mi | 2/2.0 | 1,674 (-2%) | 2mo | $406,000 | $243 | 69 |
| 48 Doncaster Ln | 0.33mi | 2/2.0 | 1,850 (+8%) | 3mo | $439,900 | $238 | 68 |
| 192 Stratford Village Way | 0.49mi | 2/2.0 | 1,830 (+7%) | 4mo | $432,500 | $236 | 63 |
| 32 Doncaster Ln | 0.41mi | 2/2.0 | 1,871 (+9%) | 5mo | $425,000 | $227 | 62 |
| 45 Sunbeam Dr | 0.55mi | 2/2.0 | 1,830 (+7%) | 2mo | $415,000 | $227 | 61 |
| 191 Stratford Village Way | 0.52mi | 2/2.0 | 1,850 (+8%) | 2mo | $395,000 | $214 | 60 |
| 40 Doncaster Ln | 0.37mi | 2/2.0 | 1,928 (+13%) | 4mo | $395,000 | $205 | 58 |
| 36 Sunbeam Dr | 0.61mi | 2/2.0 | 1,884 (+10%) | 4mo | $360,000 | $191 | 51 |
| 18 Sundome Ct | 0.54mi | 2/2.0 | 1,957 (+14%) | 4mo | $375,000 | $192 | 48 |
| 4 Sunbeam Dr | 0.57mi | 3/2.0 (+1) | 1,937 (+13%) | 2mo | $440,000 | $227 | 45 |
Match score weights: distance 35% · size 25% · config 20% · recency 20%. Top-matched comps best support the ARV.
Projected returns pro-forma
-3.0% appreciation · 8.0% rent growth · sell at horizon
- IRR
- -16.7%
- Equity multiple
- 0.39×
- Total profit
- $-68,528
- Equity at exit
- $59,626
- IRR
- -2.1%
- Equity multiple
- 0.83×
- Total profit
- $-19,239
- Equity at exit
- $34,576
Cash invested: $111,972 (down + closing). Projections, not guarantees.
Landlord ↔ Tenant lean methodology
- Overall (STATE)
- 90 Strongly Landlord-Friendly
- State South Carolina
- 90 Strongly Landlord-Friendly · R+6
- County
- — inherits STATE
- City
- — inherits STATE
ZIP-level market 29909
- Home prices YoY
- -12.5%
- Rents YoY
- 9.3%
- Active inventory
- 657
- Price-to-rent
- 12.6×
Monthly cashflow live
- Estimated rent
- $2,655 high interval (Pro) →
- Mortgage (P&I)
- −$2,097
- Tax from tax record
- −$109 /mo · $1,310/yr
- Insurance
- −$167
- HOA
- −$0
- Vacancy / Maint / Mgmt
- −$557
- Net cashflow
- $-276
Break-even live
Sensitivity live
| Price | -10% $-49 | -5% $-162 | +0% $-276 | +5% $-389 | +10% $-502 |
|---|---|---|---|---|---|
| Rent | -10% $-485 | -5% $-381 | +0% $-276 | +5% $-171 | +10% $-66 |
| Rate | -1.0pp $-74 | -0.5pp $-174 | base $-276 | +0.5pp $-379 | +1.0pp $-485 |
UW: 25.0% down · 7.5% · 30yr · 1.5% tax · 5.0% vac · 8.0% maint · 8.0% mgmt
Financing live
Cash to close
- Down payment
- $99,975
- Closing costs
- $11,997
- Reserves months
- —
- Total cash needed
- —
Loan-product check · same deal, 3 products live
Conventional
25% down · 7.5% · 30yr
- Down + closing
- —
- Monthly P&I
- —
- Monthly cashflow
- —
- DSCR
- —
- Eligible?
- —
Personal DTI + credit; lowest rate.
DSCR
20% down · 8.5% · 30yr
- Down + closing
- —
- Monthly P&I
- —
- Monthly cashflow
- —
- DSCR
- —
- Eligible?
- —
No personal income docs; deal must DSCR.
Hard money
10% down · 12.0% · 12mo
- Down + closing
- —
- Monthly P&I
- —
- Monthly cashflow
- —
- DSCR
- —
- Eligible?
- —
Short-term bridge; refi at stabilization.
Rent comps 11 comps
| Address | Beds | Baths | Sqft | Rent | $/sqft | DOM | Units | Dist |
|---|---|---|---|---|---|---|---|---|
| 133 Stratford Village Way Bluffton, SC | 2.0 | 2.0 | 1835 | $2,995 | $1.63 | 45d | 1 | 0.52mi |
| 278 Landing Ln Bluffton, SC | 2.0 | 2.0 | 1586 | $2,730 | $1.72 | 23d | 1 | 0.63mi |
| 149 Lazy Daisy Dr Bluffton, SC | 2.0 | 2.0 | 1240 | $2,500 | $2.02 | 23d | 1 | 0.83mi |
| 37 Nesting Ln Bluffton, SC | 2.0 | 2.0 | 1158 | $2,350 | $2.03 | 15d | 1 | 0.88mi |
| 521 Eastwater Ln Okatie, SC | 2.0 | 2.5 | 1252 | $2,250 | $1.80 | 15d | 1 | 0.96mi |
| 193 University Pkwy Okatie, SC | 3.0 | 2.0 | 1257 | $2,350 | $1.87 | 15d | 1 | 0.97mi |
| 110 University Pkwy Okatie, SC | 2.0 | 2.5 | 1252 | $1,900 | $1.52 | 15d | 1 | 1.03mi |
| 38 Whitebark Ln Bluffton, SC | 2.0 | 2.0 | 1566 | $2,500 | $1.60 | 15d | 1 | 1.06mi |
| 10 Candlelight Ln Bluffton, SC | 2.0 | 2.0 | 2189 | $3,000 | $1.37 | 15d | 1 | 1.23mi |
| 309 Hampton Pl Bluffton, SC | 2.0 | 2.0 | 1633 | $3,200 | $1.96 | 15d | 1 | 1.34mi |
| 20 Fickling Ct Bluffton, SC | 2.0 | 2.0 | 1742 | $2,800 | $1.61 | 45d | 1 | 1.45mi |
Listing history 21 events
-
2026-06-21days on market $399,900 Active 77 DOM
-
2026-06-18days on market $399,900 Active 74 DOM
-
2026-06-17days on market $399,900 Active 73 DOM
-
2026-06-16days on market $399,900 Active 72 DOM
-
2026-06-15days on market $399,900 Active 71 DOM
-
2026-06-14days on market $399,900 Active 69 DOM
-
2026-06-13days on market $399,900 Active 68 DOM
-
2026-06-10days on market $399,900 Active 66 DOM
-
2026-06-09days on market $399,900 Active 65 DOM
-
2026-06-08days on market $399,900 Active 64 DOM
-
2026-06-07days on market $399,900 Active 63 DOM
-
2026-06-05days on market $399,900 Active 60 DOM
-
2026-06-03days on market $399,900 Active 59 DOM
-
2026-06-02days on market $399,900 Active 58 DOM
-
2026-06-01days on market $399,900 Active 57 DOM
-
2026-05-31days on market $399,900 Active 56 DOM
-
2025-07-21price $409,900
-
2025-07-01price $419,900
-
2025-03-11$429,900 Active
-
2004-12-27soldstatus $192,581 143-char remark
Show marketing remark (143 chars)
New EGRET Model: 2 Bedroom, 2 Bath, with Den. Very spacious layout with plenty of upgrades. Enjoy the lavish lifestyle at Sun City and LIVE ON.
-
2004-11-08$205,522 143-char remark
Show marketing remark (143 chars)
New EGRET Model: 2 Bedroom, 2 Bath, with Den. Very spacious layout with plenty of upgrades. Enjoy the lavish lifestyle at Sun City and LIVE ON.
ⓘ Source: listings_history table (triggers on properties + properties_extension) + one-shot
backfill from property_details.listing_events for pre-trigger history.
Tax reassessment forecast SC · Resets to sale price
- Current annual tax
- $1,310 · $109/mo
- Projected year-2 tax
- $2,279 · $190/mo
- Expected delta
- +$970/yr (+$81/mo · 74.0%)
ⓘ Screening estimate from a state-policy table — verify with the county assessor before closing.
Climate risk First Street
- Flood 1/10 Low FEMA zone X (unshaded) · 0% chance over 30 yrs
- Wildfire 3/10 Moderate
- Heat 10/10 Extreme 7 d/yr ≥108°F today · 18 d/yr by 30 yrs out
- Wind 8/10 Severe 99% chance of damaging wind over 30 yrs
- Air quality 2/10 Low 2 unhealthy d/yr today · 2 by 30 yrs out
Nearby sold comps map
Loading sold comps map…
Walkable amenities ~0.75 mi
Loading nearby amenities…
Taxation est. · year 1
- Rental income
- $31,857
- − Mortgage interest
- −$22,401
- − Property taxes
- −$1,310
- − Insurance
- −$2,000
- − Repairs & maintenance
- −$2,549
- − Management
- −$2,549
- − Depreciation
- −$11,633
- Taxable loss
- −$10,584
- Est. tax savings @ 24.0%
- +$2,540
- After-tax cash flow
- $-768/yr
For passive investors: Depreciation is non-cash, so a rental often shows a tax loss while cash-flowing — sheltering income. Rental losses are passive: they offset passive income freely, and up to $25,000/yr can offset ordinary (W-2) income if you actively participate and your MAGI is under $100k (phasing out to $0 by $150k); unused losses carry forward. On sale, claimed depreciation is recaptured at up to 25%, and gains may owe capital-gains tax (a 1031 exchange can defer both). Figures are a year-1 estimate at your 24.0% rate — not tax advice; consult a CPA.
Schools (NCES district)
- District
- Beaufort 01
- NCES district ID
- 4501110
- Math proficiency
- 42% ▼ -8.00%
- Reading proficiency
- 51% ▲ 2.00%
- Median HH income
- $57,430
- Composite
- 40.56/100
- National rank
- #3699
- State rank
- #17 of 80 in SC
Livability — Hardeeville
- Score
- 65/100
- State rank
- #136
- US rank
- #13105
Category grades
Schools grade is shown separately in the Schools card above.
Census & demographics
- County
- Beaufort County · 163,770 people
- City population
- 11,373
- Metro
- Hilton Head Island-Bluffton, SC
- Population (ZIP)
- 24,003
- Household income
- $91,294
- Rent vs Own
- Severe rent burden
- 268.0
Population outlook (Beaufort County) Hauer SSP2
- Today (2025)
- 211,915 people
- By 2030
- 227,272 · +7.2%
- By 2040
- 253,861 · +19.8%
- By 2050
- 275,126 · +29.8%
- By 2075
- 311,022 · +46.8%
- By 2100
- 321,286 · +51.6%
Race, ethnicity, and origin ACS 2023
- Neighborhood character
- Predominantly White (89%)
- Race & ethnicity
- White 89% Black 4% Hispanic / Latino 4% Two or more races 3% Asian 1%
- Common ancestry
- Romanian 5% Lithuanian 3% Slovak 2%
- Foreign-born
- 6% · Canada, Vietnam
- Languages at home
- 94% English-only · Spanish 2% Other Indo-European 1%
Political lean MEDSL · Beaufort
- 2024 margin
- R (+14.5) · D 42.1% · R 56.6% · Other 1.2%
- 2008→2024 swing
- -3.7pp toward R · 2008: -10.8pp · 2024: -14.5pp
- All cycles
- 2024: R+14.5 2020: R+10.0 2016: R+14.3 2012: R+17.5 2008: R+10.8
Not yet ingested
- Civics
- —
Market trends
- HPI YoY
- ▼ -27.99%
- Current HPI
- 196.0491
- Rent YoY
- ▲ 9.31%
- Metro
- Hilton Head Island-Bluffton, SC
- State GDP YoY
- ▲ 4.51%
- F500 in state
- 2
Industry mix (Fortune 500 HQ in SC)
| Industry | F500 HQs | Revenue |
|---|---|---|
| Packaging | 1 | $7B |
|
||
Price history
+99.4% since first listed5 events — show timeline
- 2025-07-21 Price Changed $409,900 RSMLS
- 2025-07-01 Price Changed $419,900 RSMLS
- 2025-03-11 Listed $429,900 RSMLS
- 2004-12-27 Sold (MLS) $192,581 RSMLS
- 2004-11-08 Listed $205,522 RSMLS
Property tax history
+3.2%/yrLatest (2025): $1,310 · -0.1% YoY. Source: county tax records.
Cash-flow waterfall
monthlySold comps — $/sqft
last 12 mo · ≤1 miLoading sold comps…