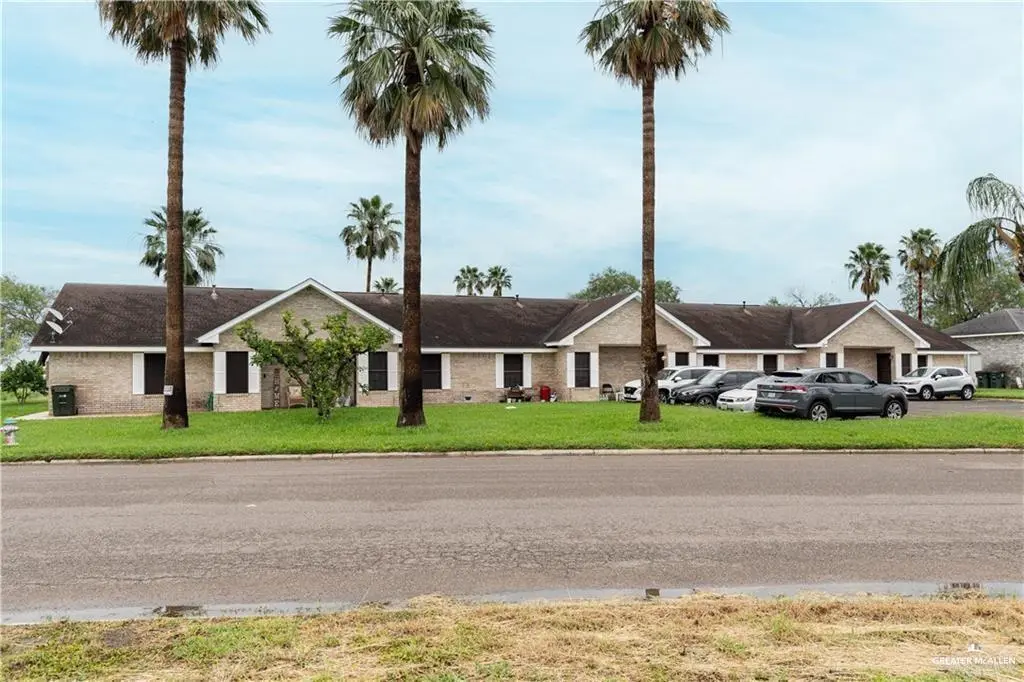
1406 Circle Dr · Mission, TX
Flood risk No data
- FEMA flood zone
- —
- Chance of flooding over 30 yrs
- —
- Est. flood insurance / yr
- —
Fire risk No data
- Est. fire insurance / yr
- —
Heat risk No data
- Hot days now (above threshold)
- —
- Hot days in 30 yrs
- —
Wind risk No data
- Chance of severe wind over 30 yrs
- —
Air-quality risk No data
- Unhealthy air days now
- —
- Unhealthy air days in 30 yrs
- —
Risk factors via First Street. Map © Google.
Why this score? — see what drove the D grade
The composite is a weighted blend of 9 inputs, each scored 0–100. Each bar is that input's sub-score; the figure is the points it added to the 100-point composite (weight × sub-score).
- ARV discount +15.0/15.0
- Cash flow +8.8/30.0
- 1% rule +4.1/10.0
- Condition / age +4.0/5.0
- Livability +3.8/5.0
- Rent growth +2.7/5.0
- DSCR +2.4/10.0
- Schools +1.7/10.0
- Appreciation +0.0/10.0
$109,900
🖨 Deal sheet (PDF) 📄 Offer letter ✓ Due diligence
Listing remarks MLS
This beautiful 2-bedroom, 1.5-bathroom condominium in Mission, TX has been completely remodeled and features stunning granite countertops, new appliances, and zebra blinds on the windows. The condo is located within a golf community & has a spacious covered patio area in the back. It's conveniently located just minutes away from Expressway 83, making it easy to get anywhere you need to go. Don't miss out on the opportunity to make this your perfect home!
Key facts
- Completely remodeled
- Zebra blinds
- New appliances
Tags
Neighborhood map
What this means for you Summary
Snapshot
- This is a 2-bed/1.5-bath condo listed at $110k. Condition is rated good.
Deal economics
- At list price, monthly cash flow is $-91 ($-1k/yr) — negative.
- To cash-flow at today's rent, offer at most $97k (12.0% below list).
- To meet the 1% rule (rent ≥ 1% of price), the offer needs to be $100k (8.6% below list).
- Recommended offer: $97k (12.0% below list) — sets the bar for cash-flow.
- Cap rate 5.3% vs local median 3.5% in Mission — top-decile yield for the area; either an underpriced asset or a hidden risk that comps aren't pricing in. Stress-test before assuming the spread holds.
Location & tenants
- Location reads 75/100 on livability (#148 in TX, #4,155 nationally) — a middle-class / working-renter tenant base. Strengths: cost of living A+, housing A+, health & safety A+; Watch: amenities F, commute F, employment D-.
- Mission CISD (urban): math 15% / reading 28% proficiency, ranked #775 of 826 in TX (top 94%) — low school quality limits family demand, transient renter base, plan for 1-2y turnover; 78% free/reduced lunch — lower-income household profile, screen leases tightly.
- Zoned schools: Leal El (math 12% / reading 25%, grade F, #3,759 of 4,322 statewide, top 88%, 463 students, 89% FRL); White J H (math 11% / reading 28%, grade F, #1,445 of 1,662 statewide, top 88%, 847 students, 90% FRL); Mission H S (math 18% / reading 28%, grade F, #1,348 of 1,632 statewide, top 83%, 2,218 students, 91% FRL).
- Market conditions: Rents flat; 853 active listings in the ZIP; 11 comparable units currently listed for rent nearby; rentals at typical pace (median 26d on market — plan ~3-4 weeks tenant-placement turnaround); 45% of comp listings sitting > 30 days — soft ceiling on asking rent; 7,378 units permitted in Hidalgo County in 2024 (641 in 5+ unit buildings).
Forward outlook
- Local home prices are declining (-3.0%/yr); year-one equity from $760 of loan paydown is wiped out by about $3k of value loss. Plan a longer hold.
- Hidalgo County population projected at +28% by 2050 — long-run rental-demand tailwind backs the buy-and-hold thesis.
Negotiation context
- It's been on market 263 days — a 12% lower offer ($97k) is reasonable based on typical stale-listing flexibility.
- 9 sale attempts since 8y ago with the ask held roughly flat each time — persistent listings suggest the price (not the market) is what's stuck; bring a comps-based counter.
Questions for the listing agent
- What do current leases actually rent for vs. the listed asking? Can we see a recent rent roll and the last 12 months of T-12 income?
- It's been on market 263 days. Have you received any prior offers? Is the seller open to a 12% concession, seller financing, or rate buy-down credit?
- What does the HOA fee cover, when was the last increase, and are there any pending special assessments or reserve-fund shortfalls?
- Any open or pending special assessments — roof, HVAC, plumbing, elevator, façade? What's the per-unit balance and payoff schedule, and is the seller paying it off at close or rolling it to the buyer?
- Why hasn't it sold? Are there any deal-killer items the seller is aware of (foundation, flood, title, zoning, code violations)?
- Is there a deadline driving the sale (1031 exchange, divorce, estate, relocation)? That informs how much negotiation room exists.
- The area grade is low — what's the realistic commute time and amenity access for the typical tenant pool here? Any planned neighborhood developments (good or bad) we should know about?
- What's the average days-on-market for RENTAL listings here right now (not sales)? A rising rental-DOM trend means longer vacancies and softer asking-rent achievability than the comps imply.
- What's the recent tenant-quality profile in this submarket — average credit score on applications, eviction rate, late-payment / NSF rate, and stable-employment percentage? A property-management company in the area should have these aggregated.
- How much new apartment / multifamily construction is in the pipeline within 1–3 miles? Heavy new supply (>2% of stock underway) typically softens rents 12–24 months out; light construction supports rent growth.
Investment metrics
- 1% rule
- 0.91% ✗
- Cap rate
- 5.30%
- Cash-on-cash
- -3.56%
- DSCR
- 0.84
- GRM
- 9.1
CMA / ARV
- ARV (median comp)
- $142,709
- List price
- $109,900
- Delta
- -22.99%
- Verdict
- UNDERPRICED
- Comps
- 20 within 1.0 mi
Projected returns pro-forma
-3.0% appreciation · 0.93% rent growth · sell at horizon
- IRR
- -24.9%
- Equity multiple
- 0.17×
- Total profit
- $-25,584
- Equity at exit
- $16,386
- IRR
- -30.0%
- Equity multiple
- -0.22×
- Total profit
- $-37,462
- Equity at exit
- $9,502
Cash invested: $30,772 (down + closing). Projections, not guarantees.
Landlord ↔ Tenant lean methodology
- Overall (STATE)
- 87 Strongly Landlord-Friendly
- State Texas
- 87 Strongly Landlord-Friendly · R+5
- County
- — inherits STATE
- City
- — inherits STATE
ZIP-level market 78572
- Home prices YoY
- -22.9%
- Rents YoY
- 0.9%
- Active inventory
- 853
- Price-to-rent
- 9.1×
Monthly cashflow live
- Estimated rent
- $1,004 high interval (Pro) →
- Mortgage (P&I)
- −$576
- Tax est. 1.5%
- −$137 /mo · $1,648/yr
- Insurance
- −$46
- HOA
- −$125
- Lot rent
- −$0
- Vacancy / Maint / Mgmt
- −$211
- Net cashflow
- $-91
Break-even live
Sensitivity live
| Price | -10% $-15 | -5% $-53 | +0% $-91 | +5% $-129 | +10% $-167 |
|---|---|---|---|---|---|
| Rent | -10% $-171 | -5% $-131 | +0% $-91 | +5% $-52 | +10% $-12 |
| Rate | -1.0pp $-36 | -0.5pp $-63 | base $-91 | +0.5pp $-120 | +1.0pp $-149 |
UW: 25.0% down · 7.5% · 30yr · 1.5% tax · 5.0% vac · 8.0% maint · 8.0% mgmt
Financing live
Cash to close
- Down payment
- $27,475
- Closing costs
- $3,297
- Reserves months
- —
- Total cash needed
- —
Loan-product check · same deal, 3 products live
Conventional
25% down · 7.5% · 30yr
- Down + closing
- —
- Monthly P&I
- —
- Monthly cashflow
- —
- DSCR
- —
- Eligible?
- —
Personal DTI + credit; lowest rate.
DSCR
20% down · 8.5% · 30yr
- Down + closing
- —
- Monthly P&I
- —
- Monthly cashflow
- —
- DSCR
- —
- Eligible?
- —
No personal income docs; deal must DSCR.
Hard money
10% down · 12.0% · 12mo
- Down + closing
- —
- Monthly P&I
- —
- Monthly cashflow
- —
- DSCR
- —
- Eligible?
- —
Short-term bridge; refi at stabilization.
Rent comps 11 comps
| Address | Beds | Baths | Sqft | Rent | $/sqft | DOM | Units | Dist |
|---|---|---|---|---|---|---|---|---|
| 1804 Oasis Ave Mission, TX | 2.0 | 1.0 | 899 | $788 | $0.88 | 21d | 3 | 0.13mi |
| 1800 Oasis Dr Unit 101 Mission, TX | 2.0 | 1.0 | 905 | $725 | $0.80 | 26d | 1 | 0.14mi |
| 1802 Oasis Dr Unit 202 Mission, TX | 2.0 | 1.0 | 893 | $850 | $0.95 | 46d | 1 | 0.15mi |
| 1525 Oasis Dr Unit 4 Mission, TX | 3.0 | 2.0 | 1100 | $825 | $0.75 | 16d | 1 | 0.22mi |
| 1605 W B St Mission, TX | 2.0 | 2.0 | 814 | $1,200 | $1.47 | 46d | 1 | 0.56mi |
| 1525 W B St Mission, TX | 2.0 | 2.0 | 852 | $1,350 | $1.58 | 21d | 1 | 0.57mi |
| 1513 W B St Mission, TX | 3.0 | 2.0 | 868 | $1,300 | $1.50 | 46d | 1 | 0.59mi |
| 1513 W B St Mission, TX | 3.0 | 2.0 | 868 | $1,300 | $1.50 | 16d | 1 | 0.59mi |
| 401 Bertha Ave Unit 3 Mission, TX | 2.0 | 2.0 | 1050 | $1,200 | $1.14 | 21d | 1 | 0.74mi |
| 401 Bertha Ave Unit 2 Mission, TX | 2.0 | 2.0 | 950 | $1,300 | $1.37 | 46d | 1 | 0.74mi |
| 1500 Industrial Way Unit A Mission, TX | 2.0 | 1.0 | 990 | $990 | $1.00 | 46d | 1 | 0.94mi |
HOA detail condo
- Monthly dues
- $125 · $1,500/yr
- Assessments
- None detected in remarks — confirm with the listing agent.
Listing history 41 events
-
2026-06-23days on market $109,900 Active 263 DOM
-
2026-06-21days on market $109,900 Active 262 DOM
-
2026-06-18days on market $109,900 Active 259 DOM
-
2026-06-17days on market $109,900 Active 258 DOM
-
2026-06-16days on market $109,900 Active 257 DOM
-
2026-06-15days on market $109,900 Active 256 DOM
-
2026-06-14days on market $109,900 Active 254 DOM
-
2026-06-10days on market $109,900 Active 251 DOM
-
2026-06-09days on market $109,900 Active 250 DOM
-
2026-06-08days on market $109,900 Active 249 DOM
-
2026-06-07days on market $109,900 Active 248 DOM
-
2026-06-03days on market $109,900 Active 244 DOM
-
2026-06-02days on market $109,900 Active 243 DOM
-
2026-06-01days on market $109,900 Active 242 DOM
-
2026-05-31days on market $109,900 Active 241 DOM
-
2026-05-31days on market $109,900 Active 240 DOM
-
2025-10-02$109,900 Active 463-char remark
Show marketing remark (463 chars)
This beautiful 2-bedroom, 1.5-bathroom condominium in Mission, TX has been completely remodeled and features stunning granite countertops, new appliances, and zebra blinds on the windows. The condo is located within a golf community & has a spacious covered patio area in the back. It's conveniently located just minutes away from Expressway 83, making it easy to get anywhere you need to go. Don't miss out on the opportunity to make this your perfect home!
-
2025-04-03price $109,900
-
2025-01-09$114,900 Active
-
2024-10-01price $114,900
-
2024-08-05$117,000 Active
-
2024-04-12status Active
-
2024-03-26status Pending
-
2024-03-01price $114,900
-
2024-01-29$117,500 Active
-
2023-10-18status Active
-
2023-10-01status Pending
-
2023-09-21historical Option
-
2023-09-11price $117,500
-
2023-05-08$119,900 Active
-
2022-10-20soldstatus Sold
-
2022-10-07status Pending
-
2022-09-29historical Option
-
2022-09-05$73,500 Active
-
2019-09-03price $40,000
-
2019-08-29soldstatus Sold
-
2019-08-17status Pending
-
2019-08-16price $47,500
-
2019-08-07historical Option
-
2019-05-06price $47,500
-
2018-12-12$50,000 Active
ⓘ Source: listings_history table (triggers on properties + properties_extension) + one-shot
backfill from property_details.listing_events for pre-trigger history.
Nearby sold comps map
Loading sold comps map…
Walkable amenities ~0.75 mi
Loading nearby amenities…
Taxation est. · year 1
- Rental income
- $12,048
- − Mortgage interest
- −$6,156
- − Property taxes
- −$1,648
- − Insurance
- −$550
- − Repairs & maintenance
- −$964
- − Management
- −$964
- − HOA
- −$1,500
- − Depreciation
- −$3,197
- Taxable loss
- −$2,931
- Est. tax savings @ 24.0%
- +$703
- After-tax cash flow
- $-393/yr
For passive investors: Depreciation is non-cash, so a rental often shows a tax loss while cash-flowing — sheltering income. Rental losses are passive: they offset passive income freely, and up to $25,000/yr can offset ordinary (W-2) income if you actively participate and your MAGI is under $100k (phasing out to $0 by $150k); unused losses carry forward. On sale, claimed depreciation is recaptured at up to 25%, and gains may owe capital-gains tax (a 1031 exchange can defer both). Figures are a year-1 estimate at your 24.0% rate — not tax advice; consult a CPA.
Condition & rehab AI · 12 photos
This beautifully remodeled 2-bedroom, 1.5-bathroom condominium in Mission, TX is move-in ready with granite countertops, new appliances, and zebra blinds. It's located in a golf community and is conveniently located near Expressway 83.
Value-add opportunities
- Both Paint exterior — Enhances curb appeal and resale value
- Both Replace zebra blinds with modern curtains — Modernizes the look and adds value
- Both Install smart home devices — Improves convenience and adds value
Renovation cost estimate screening
Value-add ROI direction
- Both Paint exterior — Enhances curb appeal and resale value ↑
- Both Replace zebra blinds with modern curtains — Modernizes the look and adds value ↑
- Both Install smart home devices — Improves convenience and adds value ↑
ⓘ Cost ranges are severity-bucket heuristics (US national rule-of-thumb). Get contractor quotes + a written scope before underwriting a rehab budget.
Schools (NCES district)
- District
- Mission CISD
- NCES district ID
- 4831040
- Math proficiency
- 15% ▼ -35.00%
- Reading proficiency
- 28% ▼ -15.00%
- Median HH income
- $32,855
- Composite
- 17.47/100
- National rank
- #9061
- State rank
- #775 of 826 in TX
Livability — Mission
- Score
- 75/100
- State rank
- #148
- US rank
- #4155
Category grades
Schools grade is shown separately in the Schools card above.
Census & demographics
- Census place
- Mission, TX
- County
- Hidalgo County · 623,128 people
- City population
- 78,024
- Metro
- McAllen-Edinburg-Mission, TX
- Population (ZIP)
- 78,024
- Household income
- $54,298
- Rent vs Own
- Severe rent burden
- 1714.0
Population outlook (Hidalgo County) Hauer SSP2
- Today (2025)
- 955,232 people
- By 2030
- 1,009,774 · +5.7%
- By 2040
- 1,120,332 · +17.3%
- By 2050
- 1,225,036 · +28.2%
- By 2075
- 1,439,189 · +50.7%
- By 2100
- 1,533,429 · +60.5%
Race, ethnicity, and origin ACS 2023
- Neighborhood character
- Predominantly Hispanic (85%)
- Race & ethnicity
- Hispanic / Latino 85% Two or more races 47% White 12% Asian 2%
- Hispanic origin (detail)
- Mexican 80%
- Common ancestry
- Slovak 1% Portuguese 0%
- Foreign-born
- 28% · Canada, South Korea
- Languages at home
- 22% English-only · Spanish 76%
Political lean MEDSL · Hidalgo
- 2024 margin
- Toss-up / Even · D 48.1% · R 51.0%
- 2008→2024 swing
- -41.6pp toward R · 2008: 38.7pp · 2024: -2.9pp
- All cycles
- 2024: R+2.9 2020: D+17.1 2016: D+40.5 2012: D+41.8 2008: D+38.7
Not yet ingested
- Civics
- —
Market trends
- HPI YoY
- ▼ -62.35%
- Current HPI
- 209.3573
- Rent YoY
- ▲ 0.93%
- Metro
- McAllen-Edinburg-Mission, TX
- State GDP YoY
- ▲ 3.95%
- F500 in state
- 110
Industry mix (Fortune 500 HQ in TX)
| Industry | F500 HQs | Revenue |
|---|---|---|
| Energy | 16 | $1,198B |
|
||
| Technology | 5 | $198B |
|
||
| Engineering / Construction | 4 | $72B |
|
||
| Energy Services | 3 | $60B |
|
||
| Utilities | 3 | $41B |
|
||
| Healthcare | 2 | $330B |
|
||
Price history
+119.8% since first listed25 events — show timeline
- 2025-10-02 Listed $109,900 MCALLENMLS
- 2025-04-03 Price Changed $109,900 MCALLENMLS
- 2025-01-09 Listed $114,900 MCALLENMLS
- 2024-10-01 Price Changed $114,900 MCALLENMLS
- 2024-08-05 Listed $117,000 MCALLENMLS
- 2024-04-12 Relisted — MCALLENMLS
- 2024-03-26 Pending — MCALLENMLS
- 2024-03-01 Price Changed $114,900 MCALLENMLS
- 2024-01-29 Listed $117,500 MCALLENMLS
- 2023-10-18 Relisted — MCALLENMLS
- 2023-10-01 Pending — MCALLENMLS
- 2023-09-21 Contingent — MCALLENMLS
- 2023-09-11 Price Changed $117,500 MCALLENMLS
- 2023-05-08 Listed $119,900 MCALLENMLS
- 2022-10-20 Sold (MLS) — MCALLENMLS
- 2022-10-07 Pending — MCALLENMLS
- 2022-09-29 Contingent — MCALLENMLS
- 2022-09-05 Listed $73,500 MCALLENMLS
- 2019-09-03 Price Changed $40,000 MCALLENMLS
- 2019-08-29 Sold (MLS) — MCALLENMLS
- 2019-08-17 Pending — MCALLENMLS
- 2019-08-16 Price Changed $47,500 MCALLENMLS
- 2019-08-07 Contingent — MCALLENMLS
- 2019-05-06 Price Changed $47,500 MCALLENMLS
- 2018-12-12 Listed $50,000 MCALLENMLS
Cash-flow waterfall
monthlySold comps — $/sqft
last 12 mo · ≤1 miLoading sold comps…