230 Norfolk Dr · Hampton, GA
Flood risk 1/10 · Minimal
- FEMA flood zone
- X (unshaded)
- Chance of flooding over 30 yrs
- 0.0%
- Est. flood insurance / yr
- $507 – $1,088
Fire risk 3/10 · Minor
- Est. fire insurance / yr
- $963 – $1,789
Heat risk 6/10 · Moderate
- Hot days now (above 105°F)
- 7 days/yr
- Hot days in 30 yrs
- 18 days/yr
Wind risk 6/10 · Moderate
- Chance of severe wind over 30 yrs
- 27.0%
Air-quality risk 4/10 · Minor
- Unhealthy air days now
- 4 days/yr
- Unhealthy air days in 30 yrs
- 5 days/yr
Risk factors via First Street. Map © Google.
Why this score? — see what drove the B- grade
The composite is a weighted blend of 9 inputs, each scored 0–100. Each bar is that input's sub-score; the figure is the points it added to the 100-point composite (weight × sub-score).
- Cash flow +30.0/30.0
- 1% rule +10.0/10.0
- DSCR +10.0/10.0
- ARV discount +7.5/15.0
- Livability +3.2/5.0
- Rent growth +3.1/5.0
- Schools +2.6/10.0
- Condition / age +2.5/5.0
- Appreciation +0.0/10.0
$80,000
🖨 Deal sheet (PDF) 📄 Offer letter ✓ Due diligence
Listing remarks
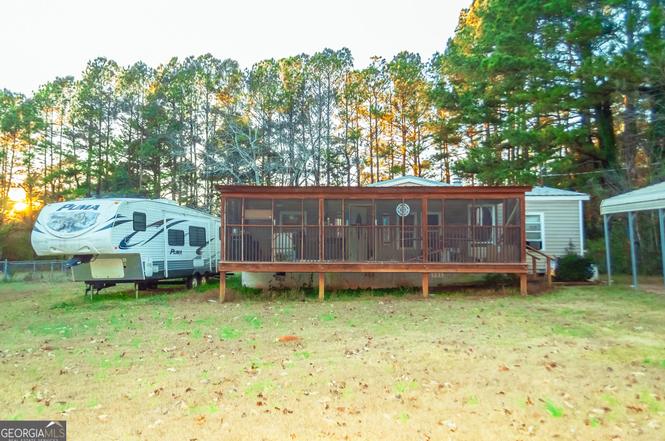
Discover a great opportunity just minutes from Hampton-this 1,000 sq ft home sits on a spacious 0.66-acre lot and offers 3 bedrooms and 2 full bathrooms, making it ideal for investors, first-time buyers, or anyone seeking a peaceful place; featuring public water, a septic system, and a cozy fireplace, this property combines comfort and convenience with its prime location just 4 minutes from town, providing easy access to local amenities while still enjoying a quiet, residential setting. The mobile home title is retired!
Key facts
- Spacious lot
- Cozy fireplace
- Prime location
Tags
Property features AI
Finance
- HOA & community: No HOA
Exterior
- Parking: Attached garage / Attached parking
- Utilities: Public water; Septic tank sewer; Other utilities
- Home design: Manufactured home / Single-family residence; Resale property; One story
- Construction: Built in 1989; Metal roof; Other construction materials; Manufactured house
- Exterior features: Other lot features
Interior
- Kitchen: No appliances listed
- Bedrooms: 3 bedrooms on the main level
- Flooring: Carpet flooring
- Bathrooms: 2 full bathrooms (both on the main level)
- Heating & cooling: Central heating; Window unit cooling
- Interior features: One-level layout; Fireplace (1); Other interior features
- Laundry & utility: Laundry room
Neighborhood map
What this means for you Summary
Snapshot
- This is a 3-bed/2.0-bath manufactured listed at $80k.
Deal economics
- At list price, monthly cash flow is $880 ($11k/yr) — positive.
- The deal already cash-flows at list — no discount required.
- Meets the 1% rule at list price ($2k rent vs $80k).
- Cap rate 19.5% vs local median 4.5% in Hampton — top-decile yield for the area; either an underpriced asset or a hidden risk that comps aren't pricing in. Stress-test before assuming the spread holds.
Location & tenants
- Location reads 65/100 on livability (#213 in GA) — a middle-class / working-renter tenant base. Strengths: cost of living A+, housing A+, crime A-; Watch: amenities F, commute F, health & safety F.
- Henry County (rural): math 24% / reading 33% proficiency, ranked #89 of 174 in GA (top 51%) — low school quality limits family demand, transient renter base, plan for 1-2y turnover.
- Zoned schools: Hampton Middle School (math 18% / reading 33%, grade F, #288 of 470 statewide, top 62%, 850 students, 62% FRL) — zoned schools average 62% FRL vs 43% district-wide (19 pts higher); higher-poverty schools than district average — tighter screening recommended.
- Market conditions: Rents rising (+2.2%/yr); 547 active listings in the ZIP; 9 comparable units currently listed for rent nearby; rentals lingering (median 44d on market — plan ~5-8 weeks vacancy on turnover, expect pricing pressure); 56% of comp listings sitting > 30 days — soft ceiling on asking rent; solid renter incomes; 1,989 units permitted in Henry County in 2024 (92 in 5+ unit buildings).
Forward outlook
- Local home prices are declining (-3.0%/yr); year-one equity from $553 of loan paydown is wiped out by about $2k of value loss. Plan a longer hold.
- Henry County population projected at +29% by 2050 — long-run rental-demand tailwind backs the buy-and-hold thesis.
- At projected returns (-3.0% appreciation + 2.2% rent growth), your $22k cash investment doubles in ~3 years — after that, you're playing with house money.
Negotiation context
- Only 14 days on market — expect competitive offers; lowballing is unlikely to land.
- 4 sale attempts with the ask held roughly flat each time — persistent listings suggest the price (not the market) is what's stuck; bring a comps-based counter.
- Current owner paid $57k; 41% above their basis — modest negotiation headroom, anchor on the comps not their cost.
Risks & watch-outs
- Watch-outs: property tax is 2.6% of price.
- Climate carrying-cost: major wind risk, 27% chance of damaging wind over 30y; extreme-heat days projected 7→18/yr by 2055 (HVAC capex compounding) — expect insurance premiums to compound above CPI over the hold.
Questions for the listing agent
- Property tax is high relative to price — has the assessment been appealed recently, and will the sale trigger a re-assessment?
- Is there a deadline driving the sale (1031 exchange, divorce, estate, relocation)? That informs how much negotiation room exists.
- Schools are F-rated, which usually means shorter tenancies and higher turnover. Who's the typical renter profile here, and what's been the actual vacancy rate?
- What's the average days-on-market for RENTAL listings here right now (not sales)? A rising rental-DOM trend means longer vacancies and softer asking-rent achievability than the comps imply.
- What's the recent tenant-quality profile in this submarket — average credit score on applications, eviction rate, late-payment / NSF rate, and stable-employment percentage? A property-management company in the area should have these aggregated.
- How much new for-sale + rental construction is in the pipeline within 1–3 miles? Heavy new supply typically softens prices + rents 12–24 months out; constrained supply supports both.
Investment metrics
- 1% rule
- 2.38% ✓
- Cap rate
- 19.49%
- Cash-on-cash
- 47.15%
- DSCR
- 3.10
- GRM
- 3.5
CMA / ARV
No comps found within radius.
Projected returns pro-forma
-3.0% appreciation · 2.2% rent growth · sell at horizon
- IRR
- 43.6%
- Equity multiple
- 2.86×
- Total profit
- $41,640
- Equity at exit
- $11,928
- IRR
- 49.2%
- Equity multiple
- 5.58×
- Total profit
- $102,590
- Equity at exit
- $6,917
Cash invested: $22,400 (down + closing). Projections, not guarantees.
Landlord ↔ Tenant lean methodology
- Overall (STATE)
- 90 Strongly Landlord-Friendly
- State Georgia
- 90 Strongly Landlord-Friendly · R+3
- County
- — inherits STATE
- City
- — inherits STATE
ZIP-level market 30228
- Home prices YoY
- -24.3%
- Rents YoY
- 2.2%
- Active inventory
- 547
- Price-to-rent
- 3.5×
Monthly cashflow live
- Estimated rent
- $1,903 high interval (Pro) →
- Mortgage (P&I)
- −$420
- Tax from tax record
- −$170 /mo · $2,045/yr
- Insurance
- −$33
- HOA
- −$0
- Vacancy / Maint / Mgmt
- −$400
- Net cashflow
- $880
Break-even live
Sensitivity live
| Price | -10% $925 | -5% $903 | +0% $880 | +5% $857 | +10% $835 |
|---|---|---|---|---|---|
| Rent | -10% $730 | -5% $805 | +0% $880 | +5% $955 | +10% $1,030 |
| Rate | -1.0pp $920 | -0.5pp $900 | base $880 | +0.5pp $859 | +1.0pp $838 |
UW: 25.0% down · 7.5% · 30yr · 1.5% tax · 5.0% vac · 8.0% maint · 8.0% mgmt
Financing live
Cash to close
- Down payment
- $20,000
- Closing costs
- $2,400
- Reserves months
- —
- Total cash needed
- —
Loan-product check · same deal, 3 products live
Conventional
25% down · 7.5% · 30yr
- Down + closing
- —
- Monthly P&I
- —
- Monthly cashflow
- —
- DSCR
- —
- Eligible?
- —
Personal DTI + credit; lowest rate.
DSCR
20% down · 8.5% · 30yr
- Down + closing
- —
- Monthly P&I
- —
- Monthly cashflow
- —
- DSCR
- —
- Eligible?
- —
No personal income docs; deal must DSCR.
Hard money
10% down · 12.0% · 12mo
- Down + closing
- —
- Monthly P&I
- —
- Monthly cashflow
- —
- DSCR
- —
- Eligible?
- —
Short-term bridge; refi at stabilization.
Rent comps 9 comps
| Address | Beds | Baths | Sqft | Rent | $/sqft | DOM | Units | Dist |
|---|---|---|---|---|---|---|---|---|
| 1299 N Hampton Dr Hampton, GA | 3.0 | 2.0 | 1232 | $1,790 | $1.45 | 5d | 1 | 0.21mi |
| 1323 N Hampton Dr Hampton, GA | 3.0 | 2.0 | 1208 | $1,794 | $1.49 | 44d | 1 | 0.23mi |
| 1330 N Hampton Dr Hampton, GA | 3.0 | 2.0 | 1228 | $1,685 | $1.37 | 13d | 1 | 0.24mi |
| 1514 N Hampton Ct Hampton, GA | 3.0 | 2.0 | 1208 | $1,700 | $1.41 | 13d | 1 | 0.25mi |
| 2074 Boatswain Dr Hampton, GA | 3.0 | 2.5 | 1490 | $1,965 | $1.32 | 21d | 1 | 0.41mi |
| 102 Jay Ln Unit A Hampton, GA | 2.0 | 1.0 | 878 | $1,175 | $1.34 | 44d | 1 | 0.54mi |
| 110 Jay Ln Unit A Hampton, GA | 2.0 | 1.0 | 878 | $1,275 | $1.45 | 44d | 1 | 0.55mi |
| 148 W James Cir Hampton, GA | 3.0 | 1.0 | 1000 | $1,750 | $1.75 | 44d | 1 | 1.08mi |
| 40 E James Cir Hampton, GA | 2.0 | 2.0 | 1100 | $1,100 | $1.00 | 44d | 1 | 1.11mi |
Listing history 9 events
-
2026-06-18statusdays on market $80,000 Active 14 DOM
-
2026-06-17days on market $80,000 New 13 DOM
-
2026-06-16days on market $80,000 New 12 DOM
-
2026-06-15days on market $80,000 New 11 DOM
-
2026-06-13days on market $80,000 New 9 DOM
-
2026-06-09days on market $80,000 New 5 DOM
-
2026-06-08days on market $80,000 New 4 DOM
-
2026-06-07remarks 525-char remark
-
2026-06-07$80,000 New 3 DOM
ⓘ Source: listings_history table (triggers on properties + properties_extension) + one-shot
backfill from property_details.listing_events for pre-trigger history.
Tax reassessment forecast GA · Resets to sale price
- Current annual tax
- $2,045 · $170/mo
- Projected year-2 tax
- $2,045 · $170/mo
- Expected delta
- $0/yr ($0/mo · 0.0%)
ⓘ Screening estimate from a state-policy table — verify with the county assessor before closing.
Climate risk First Street
- Flood 1/10 Low FEMA zone X (unshaded) · 0% chance over 30 yrs
- Wildfire 3/10 Moderate
- Heat 6/10 Major 7 d/yr ≥105°F today · 18 d/yr by 30 yrs out
- Wind 6/10 Major 27% chance of damaging wind over 30 yrs
- Air quality 4/10 Moderate 4 unhealthy d/yr today · 5 by 30 yrs out
Nearby sold comps map
Loading sold comps map…
Walkable amenities ~0.75 mi
Loading nearby amenities…
Taxation est. · year 1
- Rental income
- $22,835
- − Mortgage interest
- −$4,481
- − Property taxes
- −$2,045
- − Insurance
- −$400
- − Repairs & maintenance
- −$1,827
- − Management
- −$1,827
- − Depreciation
- −$2,327
- Taxable income
- $9,928
- Est. tax owed @ 24.0%
- −$2,383
- After-tax cash flow
- $8,178/yr
For passive investors: Depreciation is non-cash, so a rental often shows a tax loss while cash-flowing — sheltering income. Rental losses are passive: they offset passive income freely, and up to $25,000/yr can offset ordinary (W-2) income if you actively participate and your MAGI is under $100k (phasing out to $0 by $150k); unused losses carry forward. On sale, claimed depreciation is recaptured at up to 25%, and gains may owe capital-gains tax (a 1031 exchange can defer both). Figures are a year-1 estimate at your 24.0% rate — not tax advice; consult a CPA.
Schools (NCES district)
- District
- Henry County
- NCES district ID
- 1302820
- Math proficiency
- 24% ▼ -9.00%
- Reading proficiency
- 33% ▼ -7.00%
- Median HH income
- $62,594
- Composite
- 26.13/100
- National rank
- #7279
- State rank
- #89 of 174 in GA
Livability — Hampton
- Score
- 65/100
- State rank
- #213
- US rank
- #12664
Category grades
Schools grade is shown separately in the Schools card above.
Census & demographics
- County
- Henry County · 316,359 people
- City population
- 52,402
- Metro
- Atlanta-Sandy Springs-Alpharetta, GA
- Population (ZIP)
- 52,402
- Household income
- $82,619
- Rent vs Own
- Severe rent burden
- 1285.0
Population outlook (Henry County) Hauer SSP2
- Today (2025)
- 249,041 people
- By 2030
- 264,369 · +6.2%
- By 2040
- 294,459 · +18.2%
- By 2050
- 322,249 · +29.4%
- By 2075
- 392,310 · +57.5%
- By 2100
- 437,836 · +75.8%
Race, ethnicity, and origin ACS 2023
- Neighborhood character
- Majority Black (63%)
- Race & ethnicity
- Black 63% White 23% Hispanic / Latino 8% Two or more races 6% Asian 2%
- Hispanic origin (detail)
- Mexican 5% Puerto Rican 1%
- Common ancestry
- Hispanic 4% Lithuanian 1% Italian 1%
- Foreign-born
- 9% · Canada, Vietnam, Jamaica
- Languages at home
- 89% English-only · Spanish 6% French/Haitian/Cajun 2% Vietnamese 1%
Political lean MEDSL · Henry
- 2024 margin
- Strong D (+29.7) · D 64.5% · R 34.9%
- 2008→2024 swing
- +37.1pp toward D · 2008: -7.5pp · 2024: 29.7pp
- All cycles
- 2024: D+29.7 2020: D+20.5 2016: D+4.3 2012: R+3.2 2008: R+7.5
Not yet ingested
- Civics
- —
Market trends
- HPI YoY
- ▼ -71.11%
- Current HPI
- 222.0357
- Rent YoY
- ▲ 2.20%
- Metro
- Atlanta-Sandy Springs-Alpharetta, GA
- State GDP YoY
- ▲ 2.66%
- F500 in state
- 28
Industry mix (Fortune 500 HQ in GA)
| Industry | F500 HQs | Revenue |
|---|---|---|
| Paper / Packaging | 2 | $29B |
|
||
| Retail | 1 | $160B |
|
||
| Transportation / Logistics | 1 | $91B |
|
||
| Airlines | 1 | $62B |
|
||
| Consumer Goods | 1 | $47B |
|
||
| Utilities | 1 | $25B |
|
||
Price history
-83.2% since first listed14 events — show timeline
- 2026-06-04 Listed $80,000 GAMLS
- 2026-04-25 Listing Removed — GAMLS
- 2026-04-25 Relisted — GAMLS
- 2026-04-21 Listing Removed — GAMLS
- 2026-04-07 Price Changed $95,000 GAMLS
- 2026-03-18 Listed $100,000 GAMLS
- 2026-01-09 Listing Removed — GAMLS
- 2025-12-27 Price Changed $105,000 GAMLS
- 2025-12-22 Price Changed $108,000 GAMLS
- 2025-12-16 Listed $112,000 GAMLS
- 1995-07-17 Sold (Public Records) $56,673 Public Records
- 1995-07-17 Sold (Public Records) $56,673 Public Records
- 1989-08-31 Sold (Public Records) $51,600 Public Records
- 1988-04-01 Sold (Public Records) $475,000 Public Records
Property tax history
+9.5%/yrLatest (2025): $2,045 · +51.0% YoY. Source: county tax records.
Cash-flow waterfall
monthlySold comps — $/sqft
last 12 mo · ≤1 miLoading sold comps…