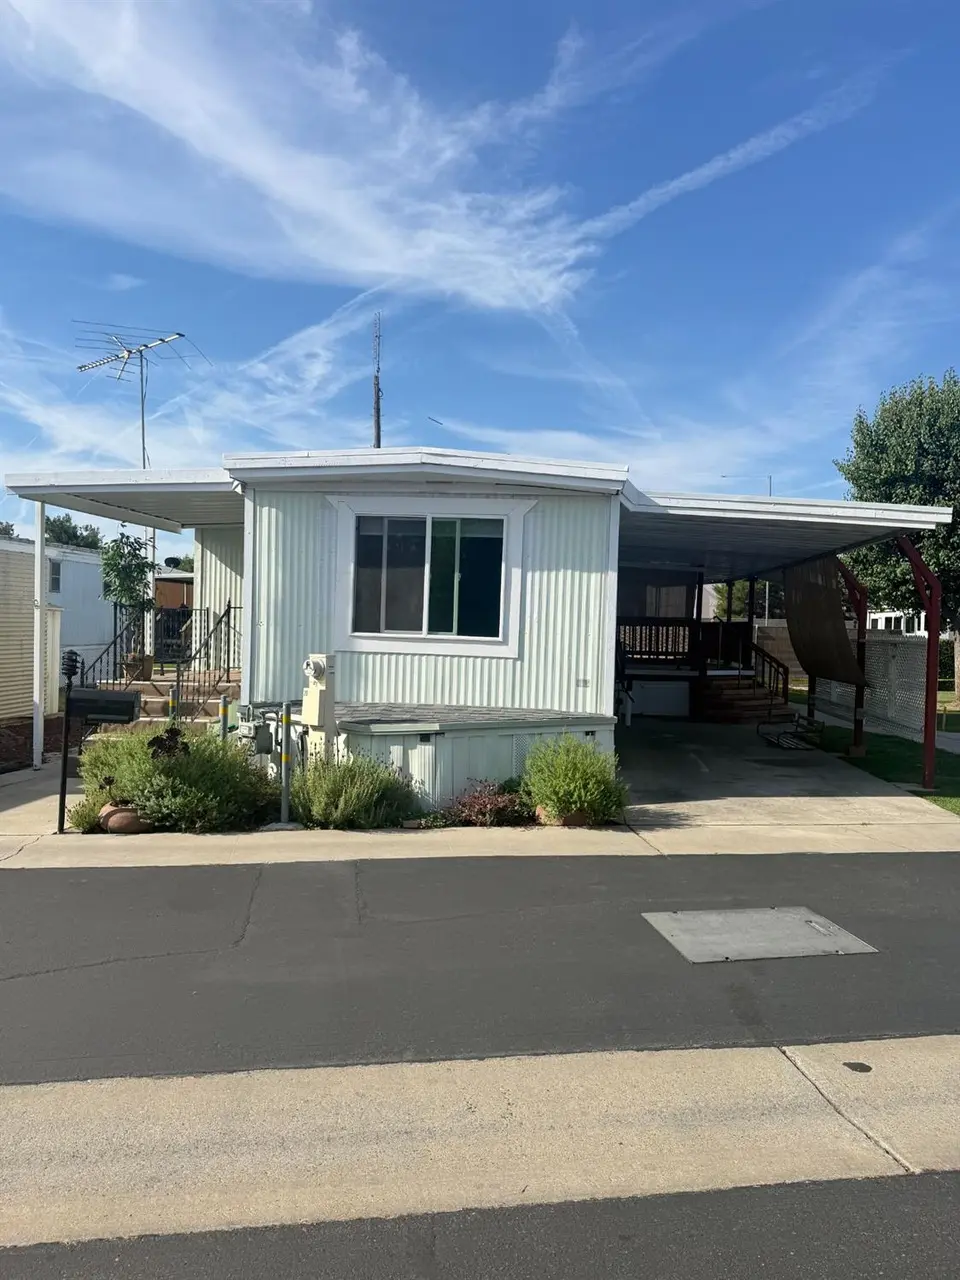
1650 Villa #20 · Clovis, CA
Flood risk 2/10 · Minimal
- FEMA flood zone
- X (shaded)
- Chance of flooding over 30 yrs
- 0.09%
- Est. flood insurance / yr
- $507 – $1,088
Fire risk 1/10 · Minimal
- Est. fire insurance / yr
- $659 – $1,223
Heat risk 8/10 · Major
- Hot days now (above 105°F)
- 7 days/yr
- Hot days in 30 yrs
- 16 days/yr
Wind risk 1/10 · Minimal
- Chance of severe wind over 30 yrs
- —
Air-quality risk 10/10 · Severe
- Unhealthy air days now
- 57 days/yr
- Unhealthy air days in 30 yrs
- 60 days/yr
Risk factors via First Street. Map © Google.
Why this score? — see what drove the B- grade
The composite is a weighted blend of 9 inputs, each scored 0–100. Each bar is that input's sub-score; the figure is the points it added to the 100-point composite (weight × sub-score).
- Cash flow +30.0/30.0
- 1% rule +10.0/10.0
- DSCR +10.0/10.0
- Schools +5.9/10.0
- Condition / age +4.0/5.0
- Livability +3.8/5.0
- Rent growth +3.2/5.0
- ARV discount +2.1/15.0
- Appreciation +0.0/10.0
$68,000
🖨 Deal sheet 📄 Offer letter ✓ Due diligence
Listing remarks
Welcome to 1650 Villa Ave Space 20 in Clovis! This beautifully renovated 1-bedroom, 1-bath mobile home offers approximately 750 square feet of comfortable living space in a well-maintained community. Thoughtfully updated throughout, the home features a modernized interior with sheetrock walls, dual-pane energy-efficient windows, updated flooring, granite countertops, new cabinetry, and a spacious walk-in shower. The widened hallway and oversized bathroom provide added accessibility and functionality. Recent improvements include a newly coated silicone roof, updated water heater, ceiling fans, central heating and air conditioning, and upgraded appliances, making this home truly move-in ready
Key facts
- Modernized interior
- Oversized bathroom
- Granite countertops
Tags
Property features AI
Finance
- HOA & community: Monthly association with pool, spa/hot tub, clubhouse and green area
Exterior
- Parking: Carport
- Utilities: Electric service on; Public sewer; Public utilities
- Home design: Mobile home; Single level; Park space rented; Broadmore make
- Construction: Metal roof; Metal siding; Wood subfloor foundation; Built as a mobile home
- Exterior features: Covered patio/deck; Synthetic lawn; Urban setting; Fenced in-ground community pool and community spa
Interior
- Kitchen: Fryer/Range/Oven (full-size); Electric appliances
- Flooring: Carpet; Tile
- Bathrooms: 1 bathroom
- Heating & cooling: Central heating and air conditioning
- Interior features: Den/Study; Zero clearance fireplace
- Laundry & utility: Indoor laundry
Neighborhood map
What this means for you Summary
Snapshot
- This is a 1-bed/1.0-bath manufactured listed at $68k. Condition is rated good.
Deal economics
- At list price, monthly cash flow is $731 ($9k/yr) — positive.
- The deal already cash-flows at list — no discount required.
- Meets the 1% rule at list price ($2k rent vs $68k).
- Cap rate 19.2% vs local median 3.0% in Clovis — top-decile yield for the area; either an underpriced asset or a hidden risk that comps aren't pricing in. Stress-test before assuming the spread holds.
Location & tenants
- Location reads 76/100 on livability (#92 in CA, #3,307 nationally) — a middle-class / working-renter tenant base. Strengths: commute A+, housing A+, employment A; Watch: amenities C-, health & safety D, cost of living F.
- Clovis Unified (suburban): math 58% / reading 72% proficiency, ranked #152 of 1,400 in CA (top 11%) — acceptable for families but not a draw, mixed tenant base, ~2y average lease.
- Zoned schools: Sierra Vista Elementary (503 students, 87% FRL); Clark Intermediate (1,462 students, 61% FRL); Clovis High (2,905 students, 48% FRL) — zoned schools average 65% FRL vs 32% district-wide (34 pts higher); higher-poverty schools than district average — tighter screening recommended.
- Market conditions: Rents rising (+2.6%/yr); 85 active listings in the ZIP; 40 comparable units currently listed for rent nearby; rentals at typical pace (median 24d on market — plan ~3-4 weeks tenant-placement turnaround); 2,426 units permitted in Fresno County in 2024 (296 in 5+ unit buildings).
Forward outlook
- Local home prices are declining (-3.0%/yr); year-one equity from $470 of loan paydown is wiped out by about $2k of value loss. Plan a longer hold.
- Fresno County population projected at +11% by 2050 — modest demand growth; plan on rents tracking national, not racing it.
- At projected returns (-3.0% appreciation + 2.6% rent growth), your $19k cash investment doubles in ~3 years — after that, you're playing with house money.
Negotiation context
- Only 14 days on market — expect competitive offers; lowballing is unlikely to land.
Risks & watch-outs
- Climate carrying-cost: extreme-heat days projected 7→16/yr by 2055 (HVAC capex compounding) — expect insurance premiums to compound above CPI over the hold.
Questions for the listing agent
- Built in 1968 — when were the roof, HVAC, electrical panel, plumbing, and water heater last replaced?
- Is there a deadline driving the sale (1031 exchange, divorce, estate, relocation)? That informs how much negotiation room exists.
- Schools are B-rated — typically a magnet for longer-tenancy family renters. What's the average tenant stay here, and is there a school-zone premium baked into asking?
- What's the average days-on-market for RENTAL listings here right now (not sales)? A rising rental-DOM trend means longer vacancies and softer asking-rent achievability than the comps imply.
- What's the recent tenant-quality profile in this submarket — average credit score on applications, eviction rate, late-payment / NSF rate, and stable-employment percentage? A property-management company in the area should have these aggregated.
- How much new for-sale + rental construction is in the pipeline within 1–3 miles? Heavy new supply typically softens prices + rents 12–24 months out; constrained supply supports both.
Investment metrics
- 1% rule
- 2.24% ✓
- Cap rate
- 19.19%
- Cash-on-cash
- 46.06%
- DSCR
- 3.05
- GRM
- 3.7
CMA / ARV
- ARV (on-the-fly)
- $60,750
- Comps found
- 12
Show comp detail 12 sales within ~0.75 mi
| Address | Dist | Beds/Ba | Sqft | Sold | Price | $/sf | Match |
|---|---|---|---|---|---|---|---|
| 1500 W Villa Ave N Spc 7 | 0.12mi | 2/1.0 (+1) | 800 (+7%) | 1mo | $59,500 | $74 | 78 |
| 1272 Villa Ave #28 | 0.22mi | 2/1.0 (+1) | 784 (+4%) | 1mo | $85,000 | $108 | 77 |
| 1500 Villa Ave #146 | 0.11mi | 2/1.0 (+1) | 700 (-7%) | 4mo | $99,000 | $141 | 76 |
| 1724 Minnewawa #8 | 0.33mi | 2/1.0 (+1) | 712 (-5%) | 1mo | $54,800 | $77 | 70 |
| 1500 Villa Ave #143 | 0.12mi | 2/2.0 (+1) | 720 (-4%) | 12mo | $54,000 | $75 | 69 |
| 1724 Minnewawa Ave #94 | 0.36mi | 2/1.0 (+1) | 720 (-4%) | 8mo | $58,500 | $81 | 65 |
| 1724 Minnewawa Ave #32 | 0.34mi | 2/1.8 (+1) | 756 (+1%) | 12mo | $55,900 | $74 | 64 |
| 1724 Minnewawa Ave #164 | 0.36mi | 1/1.0 | 664 (-12%) | 2mo | $52,500 | $79 | 62 |
| 1724 Minnewawa Ave #215 | 0.36mi | 2/1.0 (+1) | 800 (+7%) | 9mo | $72,500 | $91 | 60 |
| 1724 Minnewawa Ave #227 | 0.34mi | 2/2.0 (+1) | 800 (+7%) | 6mo | $65,200 | $82 | 59 |
| 1001 Sylmar Ave #230 | 0.52mi | 2/1.0 (+1) | 800 (+7%) | 9mo | $95,000 | $119 | 52 |
| 1272 Villa Ave #60 | 0.24mi | 2/1.5 (+1) | 650 (-13%) | 11mo | $10,000 | $15 | 50 |
Match score weights: distance 35% · size 25% · config 20% · recency 20%. Top-matched comps best support the ARV.
Projected returns pro-forma
-3.0% appreciation · 2.65% rent growth · sell at horizon
- IRR
- 42.9%
- Equity multiple
- 2.84×
- Total profit
- $35,016
- Equity at exit
- $10,139
- IRR
- 48.8%
- Equity multiple
- 5.64×
- Total profit
- $88,346
- Equity at exit
- $5,879
Cash invested: $19,040 (down + closing). Projections, not guarantees.
Landlord ↔ Tenant lean methodology
- Overall (STATE)
- 18 Strongly Tenant-Friendly
- State California
- 18 Strongly Tenant-Friendly · D+13
- County
- — inherits STATE
- City
- — inherits STATE
ZIP-level market 93612
- Rents YoY
- 2.6%
- Active inventory
- 85
- Price-to-rent
- 3.7×
Monthly cashflow live
- Estimated rent
- $1,520 high interval (Pro) →
- Mortgage (P&I)
- −$357
- Tax est. 1.5%
- −$85 /mo · $1,020/yr
- Insurance
- −$28
- HOA
- −$0
- Vacancy / Maint / Mgmt
- −$319
- Net cashflow
- $731
Break-even live
UW: 25.0% down · 7.5% · 30yr · 1.5% tax · 5.0% vac · 8.0% maint · 8.0% mgmt
Financing live
Cash to close
- Down payment
- $17,000
- Closing costs
- $2,040
- Reserves months
- —
- Total cash needed
- —
Loan-product check · same deal, 3 products live
Conventional
25% down · 7.5% · 30yr
- Down + closing
- —
- Monthly P&I
- —
- Monthly cashflow
- —
- DSCR
- —
- Eligible?
- —
Personal DTI + credit; lowest rate.
DSCR
20% down · 8.5% · 30yr
- Down + closing
- —
- Monthly P&I
- —
- Monthly cashflow
- —
- DSCR
- —
- Eligible?
- —
No personal income docs; deal must DSCR.
Hard money
10% down · 12.0% · 12mo
- Down + closing
- —
- Monthly P&I
- —
- Monthly cashflow
- —
- DSCR
- —
- Eligible?
- —
Short-term bridge; refi at stabilization.
Rent comps 40 comps
| Address | Beds | Baths | Sqft | Rent | $/sqft | DOM | Units | Dist |
|---|---|---|---|---|---|---|---|---|
| 322 W Barstow Ave Unit 101 Clovis, CA | 2.0 | 2.0 | 1100 | $2,150 | $1.95 | 43d | 1 | 0.29mi |
| 69 W Beverly Ave Unit Advertising Unit Clovis, CA | 2.0 | 1.0 | 850 | $1,650 | $1.94 | 43d | 1 | 0.34mi |
| 1108 Villa Ave Clovis, CA | 2.0 | 1.5 | 900 | $1,500 | $1.67 | 43d | 1 | 0.37mi |
| 1108 Villa Ave Clovis, CA | 1.0 | 1.0 | 651 | $1,300 | $2.00 | 23d | 1 | 0.37mi |
| 361 W Santa Ana Ave Clovis, CA | 1.0 | 1.0 | 735 | $1,150 | $1.56 | 43d | 1 | 0.41mi |
| 189 W Santa Ana Ave Apt F Clovis, CA | 2.0 | 1.0 | 800 | $1,450 | $1.81 | 2d | 1 | 0.44mi |
| 563 W Alamos Ave Unit D Clovis, CA | 1.0 | 1.0 | 700 | $1,195 | $1.71 | 3d | 1 | 0.44mi |
| 1099 Sylmar Ave Clovis, CA | 2.0 | 1.0 | 965 | $1,750 | $1.81 | 23d | 3 | 0.46mi |
| 139 W Portals Ave Clovis, CA | 2.0 | 1.0 | 1014 | $1,600 | $1.58 | 43d | 1 | 0.47mi |
| 2243 Helm Ave Unit 102 Clovis, CA | 2.0 | 2.0 | 1100 | $1,925 | $1.75 | 21d | 1 | 0.50mi |
| 33 W Santa Ana Ave Apt A Clovis, CA | 2.0 | 1.5 | 900 | $1,450 | $1.61 | 2d | 1 | 0.53mi |
| 50 W 9th St Clovis, CA | 2.0 | 2.0 | 1100 | $1,500 | $1.36 | 23d | 1 | 0.61mi |
| 139 Santa Ana Ave Clovis, CA | 1.0 | 1.0 | 620 | $1,365 | $2.20 | 10d | 3 | 0.65mi |
| 1038 Tollhouse Rd Unit 1038 Clovis, CA | 2.0 | 1.5 | 1100 | $1,800 | $1.64 | 2d | 1 | 0.66mi |
| 400 W Gettysburg Ave Apt 204A Clovis, CA | 2.0 | 1.0 | 904 | $1,600 | $1.77 | 43d | 1 | 0.72mi |
| 400 W Gettysburg Ave Unit 215B Clovis, CA | 2.0 | 2.0 | 994 | $1,780 | $1.79 | 43d | 1 | 0.72mi |
| 400 W Gettysburg Ave Apt 208A Clovis, CA | 2.0 | 1.0 | 904 | $1,500 | $1.66 | 43d | 1 | 0.72mi |
| 400 W Gettysburg Ave Apt 220A Clovis, CA | 1.0 | 1.0 | 714 | $1,350 | $1.89 | 43d | 1 | 0.72mi |
| 400 W Gettysburg Ave Unit 143A Clovis, CA | 2.0 | 1.0 | 904 | $1,650 | $1.83 | 21d | 1 | 0.72mi |
| 400 W Gettysburg Ave Unit 206B Clovis, CA | 2.0 | 1.0 | 904 | $1,500 | $1.66 | 23d | 1 | 0.72mi |
| 400 W Gettysburg Ave Unit 101A Clovis, CA | 2.0 | 1.0 | 904 | $1,580 | $1.75 | 23d | 1 | 0.72mi |
| 400 W Gettysburg Ave Unit 145A Clovis, CA | 1.0 | 1.0 | 714 | $1,500 | $2.10 | 23d | 1 | 0.72mi |
| 400 W Gettysburg Ave Unit 116B Clovis, CA | 2.0 | 2.0 | 994 | $1,795 | $1.81 | 43d | 1 | 0.72mi |
| 400 W Gettysburg Ave Apt 223A Clovis, CA | 2.0 | 2.0 | 994 | $1,700 | $1.71 | 43d | 1 | 0.72mi |
| 400 W Gettysburg Ave Unit 243A Clovis, CA | 2.0 | 1.0 | 904 | $1,500 | $1.66 | 2d | 1 | 0.72mi |
| 707 Bush Ave Clovis, CA | 2.0 | 1.0 | 950 | $1,575 | $1.66 | 43d | 1 | 0.73mi |
| 740 Villa Ave Clovis, CA | 2.0 | 2.0 | 922 | $1,950 | $2.11 | 21d | 1 | 0.75mi |
| 2777 Willow Ave Clovis, CA | 1.0–2.0 | 1.0 | 812 | $1,395 | $1.72 | 1d | 8 | 0.83mi |
| 835 W Pico Ave Clovis, CA | 1.0–2.0 | 1.0 | 761 | $1,395 | $1.83 | 1d | 3 | 0.87mi |
| 5082 Primitivo Way Fresno, CA | 1.0–2.0 | 1.0 | 847 | $1,775 | $2.10 | 11d | 2 | 0.92mi |
| 2810 Willow Ave Clovis, CA | 2.0 | 2.0 | 928 | $1,623 | $1.75 | 23d | 1 | 0.94mi |
| 2810 Willow Ave Clovis, CA | 2.0 | 2.0 | 890 | $1,572 | $1.77 | 10d | 1 | 0.94mi |
| 2810 Willow Ave Clovis, CA | 1.0 | 1.0 | 621 | $1,389 | $2.24 | 3d | 1 | 0.94mi |
| 55 W Bullard Ave Clovis, CA | 1.0–2.0 | 1.0 | 800 | $1,480 | $1.85 | 1d | 13 | 0.94mi |
| 434 W Stuart Ave Unit 2 Clovis, CA | 2.0 | 1.0 | 860 | $1,575 | $1.83 | 3d | 1 | 0.94mi |
| 2800 Willow Ave Clovis, CA | 1.0–2.0 | 1.0–2.0 | 774 | $1,393 | $1.80 | 1d | 7 | 0.95mi |
| 3143 Matoian Way Fresno, CA | 1.0–2.0 | 1.0–2.0 | 971 | $1,605 | $1.65 | 43d | 1 | 0.98mi |
| 537 W Escalon Ave Apt 101 Clovis, CA | 2.0 | 2.0 | 1000 | $1,600 | $1.60 | 43d | 1 | 1.16mi |
| 1008 Jefferson Ave Unit D Clovis, CA | 2.0 | 1.0 | 700 | $1,375 | $1.96 | 23d | 1 | 1.16mi |
| 551 W Ashlan Ave Unit 101 858 Clovis, CA | 2.0 | 2.0 | 1000 | $1,450 | $1.45 | 43d | 1 | 1.19mi |
Listing history 12 events
-
2026-06-18days on market $68,000 Active 14 DOM
-
2026-06-17days on market $68,000 Active 13 DOM
-
2026-06-16days on market $68,000 Active 12 DOM
-
2026-06-15days on market $68,000 Active 11 DOM
-
2026-06-13days on market $68,000 Active 9 DOM
-
2026-06-13days on market $68,000 Active 8 DOM
-
2026-06-10days on market $68,000 Active 6 DOM
-
2026-06-09days on market $68,000 Active 5 DOM
-
2026-06-08days on market $68,000 Active 4 DOM
-
2026-06-07days on market $68,000 Active 3 DOM
-
2026-06-05remarks 699-char remark
-
2026-06-05$68,000 Active 1 DOM
ⓘ Source: listings_history table (triggers on properties + properties_extension) + one-shot
backfill from property_details.listing_events for pre-trigger history.
Climate risk First Street
- Flood 2/10 Low FEMA zone X (shaded) · 9% chance over 30 yrs
- Wildfire 1/10 Low
- Heat 8/10 Severe 7 d/yr ≥105°F today · 16 d/yr by 30 yrs out
- Wind 1/10 Low
- Air quality 10/10 Extreme 57 unhealthy d/yr today · 60 by 30 yrs out
Nearby sold comps map
Loading sold comps map…
Walkable amenities ~0.75 mi
Loading nearby amenities…
Taxation est. · year 1
- Rental income
- $18,239
- − Mortgage interest
- −$3,809
- − Property taxes
- −$1,020
- − Insurance
- −$340
- − Repairs & maintenance
- −$1,459
- − Management
- −$1,459
- − Depreciation
- −$1,978
- Taxable income
- $8,174
- Est. tax owed @ 24.0%
- −$1,962
- After-tax cash flow
- $6,808/yr
For passive investors: Depreciation is non-cash, so a rental often shows a tax loss while cash-flowing — sheltering income. Rental losses are passive: they offset passive income freely, and up to $25,000/yr can offset ordinary (W-2) income if you actively participate and your MAGI is under $100k (phasing out to $0 by $150k); unused losses carry forward. On sale, claimed depreciation is recaptured at up to 25%, and gains may owe capital-gains tax (a 1031 exchange can defer both). Figures are a year-1 estimate at your 24.0% rate — not tax advice; consult a CPA.
Condition & rehab AI · 13 photos
This beautifully renovated mobile home is move-in ready with recent updates and good condition. It offers a modernized interior and a well-maintained exterior, making it an attractive option for both resale and rental.
Value-add opportunities
- Both Painting the exterior siding — Enhances curb appeal and value
- Both Upgrading the flooring to hardwood or tile — Improves aesthetics and durability
- Both Upgrading the appliances to energy-efficient models — Reduces utility costs and enhances appeal
Renovation cost estimate screening
Value-add ROI direction
- Both Painting the exterior siding — Enhances curb appeal and value ↑
- Both Upgrading the flooring to hardwood or tile — Improves aesthetics and durability ↑
- Both Upgrading the appliances to energy-efficient models — Reduces utility costs and enhances appeal ↑
ⓘ Cost ranges are severity-bucket heuristics (US national rule-of-thumb). Get contractor quotes + a written scope before underwriting a rehab budget.
Schools (NCES district)
- District
- Clovis Unified
- NCES district ID
- 0609030
- Math proficiency
- 58% ▲ 1.00%
- Reading proficiency
- 72% ▲ 2.00%
- Median HH income
- $71,950
- Composite
- 58.7/100
- National rank
- #2003
- State rank
- #152 of 1400 in CA
Livability — Clovis
- Score
- 76/100
- State rank
- #92
- US rank
- #3307
Category grades
Schools grade is shown separately in the Schools card above.
Census & demographics
- Census place
- Clovis, CA
- County
- Fresno County · 834,801 people
- City population
- 139,989
- Metro
- Fresno, CA
- Population (ZIP)
- 37,755
- Household income
- $66,683
- Rent vs Own
- Severe rent burden
- 2487.0
Population outlook (Fresno County) Hauer SSP2
- Today (2025)
- 1,042,971 people
- By 2030
- 1,072,198 · +2.8%
- By 2040
- 1,122,408 · +7.6%
- By 2050
- 1,157,251 · +11.0%
- By 2075
- 1,182,575 · +13.4%
- By 2100
- 1,105,899 · +6.0%
Race, ethnicity, and origin ACS 2023
- Neighborhood character
- Diverse neighborhood (Simpson 0.65)
- Race & ethnicity
- Hispanic / Latino 41% White 41% Two or more races 18% Asian 12% Black 2% Native American 2%
- Hispanic origin (detail)
- Mexican 37%
- Common ancestry
- Slovak 2% Lithuanian 1% Italian 1%
- Foreign-born
- 12% · Canada, China, Vietnam
- Languages at home
- 73% English-only · Spanish 18% Other Asian/Pacific 4% Tagalog/Filipino 2%
Political lean MEDSL · Fresno
- 2024 margin
- Toss-up / Even · D 46.5% · R 50.9% · Other 2.6%
- 2008→2024 swing
- -6.5pp toward R · 2008: 2.1pp · 2024: -4.4pp
- All cycles
- 2024: R+4.4 2020: D+7.8 2016: D+3.9 2012: R+2.9 2008: D+2.1
Not yet ingested
- Civics
- —
Market trends
- HPI YoY
- ▼ -352.97%
- Current HPI
- 357.6089
- Rent YoY
- ▲ 2.65%
- Metro
- Fresno, CA
- State GDP YoY
- ▲ 3.21%
- F500 in state
- 116
Industry mix (Fortune 500 HQ in CA)
| Industry | F500 HQs | Revenue |
|---|---|---|
| Technology | 27 | $1,492B |
|
||
| Financial Services | 3 | $174B |
|
||
| Retail | 3 | $44B |
|
||
| Insurance | 3 | $26B |
|
||
| Media / Entertainment | 2 | $115B |
|
||
| Pharmaceuticals / Biotech | 2 | $62B |
|
||
Price history
1 event — show timeline
- 2026-06-03 Listed $68,000 FRESNOMLS
Cash-flow waterfall
monthlySold comps — $/sqft
last 12 mo · ≤1 miLoading sold comps…