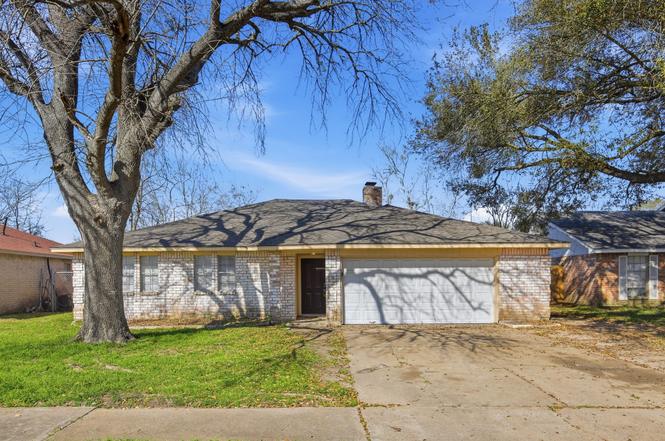
14915 Four Winds Dr · Houston, TX
Flood risk 7/10 · Major
- FEMA flood zone
- X (unshaded)
- Chance of flooding over 30 yrs
- 0.95%
- Est. flood insurance / yr
- $507 – $1,088
Fire risk 3/10 · Minor
- Est. fire insurance / yr
- $1,222 – $2,270
Heat risk 9/10 · Severe
- Hot days now (above 110°F)
- 7 days/yr
- Hot days in 30 yrs
- 23 days/yr
Wind risk 9/10 · Severe
- Chance of severe wind over 30 yrs
- 99.0%
Air-quality risk 3/10 · Minor
- Unhealthy air days now
- 2 days/yr
- Unhealthy air days in 30 yrs
- 3 days/yr
Risk factors via First Street. Map © Google.
Why this score? — see what drove the D- grade
The composite is a weighted blend of 9 inputs, each scored 0–100. Each bar is that input's sub-score; the figure is the points it added to the 100-point composite (weight × sub-score).
- Cash flow +9.8/30.0
- ARV discount +5.3/15.0
- Appreciation +4.7/10.0
- Schools +4.5/10.0
- Livability +3.7/5.0
- 1% rule +3.4/10.0
- DSCR +2.8/10.0
- Rent growth +2.6/5.0
- Condition / age +2.5/5.0
$233,786
🖨 Deal sheet (PDF) 📄 Offer letter ✓ Due diligence
Listing remarks MLS
CORPORATE OWNED 4 BEDROOM,WONDERFUL OPPORTUNITY FOR A LARGE FAMILY,NEEDS COSMETIC REPAIR,LOTS OF WINDOWS,FIREPLACE,HUGE YARD FOR A POOL,A MINUTE FROM THE TOLL ROAD.GREAT INVESTMENT TO BE SOLD AS-IS!
Key facts
- 0.24 acre lot
- Built 1976
Property features AI
Finance
- HOA & community: Willow Park HOA with a $29 monthly fee
Exterior
- Home design: Residential property; Single-story (first-floor living areas)
- Construction: Brick construction; Built in 1976; Composition roof; Slab foundation
- Exterior features: Located in a subdivision
Interior
- Kitchen: Kitchen on the first floor (9 x 10)
- Bedrooms: Primary bedroom on the first floor (11 x 16); Bedroom on the first floor (11 x 14); Bedroom on the first floor (10 x 11); Bedroom on the first floor (10 x 11)
- Bathrooms: Two full bathrooms
- Heating & cooling: Central heating (electric); Central air conditioning (electric)
- Interior features: One fireplace; Seven total rooms
Neighborhood map
What this means for you Summary
Snapshot
- This is a 3-bed/2.0-bath single-family listed at $234k.
Deal economics
- At list price, monthly cash flow is $-216 ($-3k/yr) — negative.
- To cash-flow at today's rent, offer at most $196k (16.3% below list).
- To meet the 1% rule (rent ≥ 1% of price), the offer needs to be $195k (16.5% below list).
- Recommended offer: $195k (16.5% below list) — sets the bar for 1% rule.
- Cap rate 5.5% vs local median 3.1% in Houston — top-decile yield for the area; either an underpriced asset or a hidden risk that comps aren't pricing in. Stress-test before assuming the spread holds.
Location & tenants
- Location reads 74/100 on livability (#184 in TX, #4,771 nationally) — a middle-class / working-renter tenant base. Strengths: amenities A+, cost of living A+, housing A+; Watch: crime F.
- Fort Bend ISD (suburban): math 44% / reading 53% proficiency, ranked #140 of 826 in TX (top 17%) — families likely to look elsewhere, expect single-tenant / working-renter base with shorter leases.
- Zoned schools: Christa Mcauliffe Middle (math 9% / reading 20%, grade F, #1,583 of 1,662 statewide, top 96%, 835 students, 94% FRL); Willowridge H S (math 12% / reading 29%, grade F, #1,389 of 1,632 statewide, top 86%, 1,319 students, 87% FRL) — zoned schools average 91% FRL vs 35% district-wide (56 pts higher); higher-poverty schools than district average — tighter screening recommended.
- Zoned-school proficiency averages 18% at this address vs 48% district-wide (-31 pts) — the specific schools serving this property underperform the Fort Bend ISD average; the district grade overstates school quality for this exact location.
- Market conditions: Rents flat; 186 active listings in the ZIP; 14 comparable units currently listed for rent nearby; rentals at typical pace (median 17d on market — plan ~3-4 weeks tenant-placement turnaround); 12,093 units permitted in Fort Bend County in 2024 (815 in 5+ unit buildings).
- This rent runs 31% of the median local income ($75k/yr) — at the standard rent-burdened threshold; future hikes will face affordability resistance.
Forward outlook
- In year one you build about $328 of equity ($2k loan paydown + $-1k appreciation (-0.6% local appreciation)).
- Fort Bend County population projected at +75% by 2050 — long-run rental-demand tailwind backs the buy-and-hold thesis.
Negotiation context
- Only 2 days on market — expect competitive offers; lowballing is unlikely to land.
- 2 sale attempts since 17y ago with the ask held roughly flat each time — persistent listings suggest the price (not the market) is what's stuck; bring a comps-based counter.
Risks & watch-outs
- Watch-outs: flood insurance adds $66/mo.
- Climate carrying-cost: major flood risk; severe wind risk, 99% chance of damaging wind over 30y; extreme-heat days projected 7→23/yr by 2055 (HVAC capex compounding) — expect insurance premiums to compound above CPI over the hold.
Questions for the listing agent
- What do current leases actually rent for vs. the listed asking? Can we see a recent rent roll and the last 12 months of T-12 income?
- Built in 1976 — when were the roof, HVAC, electrical panel, plumbing, and water heater last replaced?
- What's the actual annual flood-insurance premium (NFIP or private), and is the property in a SFHA with mandatory coverage?
- What does the HOA fee cover, when was the last increase, and are there any pending special assessments or reserve-fund shortfalls?
- Is there a deadline driving the sale (1031 exchange, divorce, estate, relocation)? That informs how much negotiation room exists.
- Schools are D-rated, which usually means shorter tenancies and higher turnover. Who's the typical renter profile here, and what's been the actual vacancy rate?
- Crime grade is F in this area — have there been break-ins, vandalism, or insurance claims at this property in the last 3 years? What carrier currently insures it and at what premium?
- The area grade is low — what's the realistic commute time and amenity access for the typical tenant pool here? Any planned neighborhood developments (good or bad) we should know about?
- What's the average days-on-market for RENTAL listings here right now (not sales)? A rising rental-DOM trend means longer vacancies and softer asking-rent achievability than the comps imply.
- What's the recent tenant-quality profile in this submarket — average credit score on applications, eviction rate, late-payment / NSF rate, and stable-employment percentage? A property-management company in the area should have these aggregated.
- How much new for-sale + rental construction is in the pipeline within 1–3 miles? Heavy new supply typically softens prices + rents 12–24 months out; constrained supply supports both.
Investment metrics
- 1% rule
- 0.84% ✗
- Cap rate
- 5.52%
- Cash-on-cash
- -2.74%
- DSCR
- 0.88
- GRM
- 10.0
CMA / ARV
- ARV (on-the-fly)
- $223,080
- Comps found
- 12
Show comp detail 12 sales within ~0.75 mi
| Address | Dist | Beds/Ba | Sqft | Sold | Price | $/sf | Match |
|---|---|---|---|---|---|---|---|
| 15043 Four Winds Dr | 0.14mi | 3/2.0 | 1,612 (+3%) | 6mo | $273,000 | $169 | 83 |
| 7018 Roberson Rd | 0.19mi | 3/2.5 | 1,670 (+7%) | 7mo | $220,000 | $132 | 71 |
| 7027 Dickson Way | 0.16mi | 3/2.0 | 1,782 (+14%) | 3mo | $245,000 | $137 | 66 |
| 6734 Indian Lake Dr | 0.50mi | 3/2.0 | 1,654 (+6%) | 4mo | $230,000 | $139 | 63 |
| 14602 Steeplechase Dr | 0.59mi | 3/2.0 | 1,612 (+3%) | 7mo | $165,000 | $102 | 61 |
| 7612 Goudin Dr | 0.67mi | 3/2.5 | 1,699 (+9%) | 2mo | $165,000 | $97 | 50 |
| 6618 Castleview Ln | 0.74mi | 4/2.0 (+1) | 1,458 (-6%) | 1mo | $260,000 | $178 | 49 |
| 7458 Bahia Ln | 0.60mi | 3/2.0 | 1,341 (-14%) | 1mo | $228,000 | $170 | 48 |
| 6706 Castleview Ln | 0.70mi | 3/2.0 | 1,364 (-13%) | 2mo | $195,000 | $143 | 44 |
| 14603 Chase Village Dr | 0.62mi | 3/2.0 | 1,763 (+13%) | 10mo | $280,000 | $159 | 42 |
| 15439 Indian Woods Dr | 0.72mi | 4/2.0 (+1) | 1,428 (-8%) | 9mo | $268,000 | $188 | 40 |
| 15406 Appleridge Dr | 0.65mi | 4/2.0 (+1) | 1,342 (-14%) | 10mo | $155,000 | $115 | 33 |
Match score weights: distance 35% · size 25% · config 20% · recency 20%. Top-matched comps best support the ARV.
Projected returns pro-forma
-0.55% appreciation · 0.34% rent growth · sell at horizon
- IRR
- -11.0%
- Equity multiple
- 0.52×
- Total profit
- $-31,567
- Equity at exit
- $61,513
- IRR
- -6.8%
- Equity multiple
- 0.38×
- Total profit
- $-40,473
- Equity at exit
- $69,031
Cash invested: $65,460 (down + closing). Projections, not guarantees.
Landlord ↔ Tenant lean methodology
- Overall (STATE)
- 87 Strongly Landlord-Friendly
- State Texas
- 87 Strongly Landlord-Friendly · R+5
- County
- — inherits STATE
- City
- — inherits STATE
ZIP-level market 77489
- Home prices YoY
- -0.2%
- Rents YoY
- 0.3%
- Active inventory
- 186
- Price-to-rent
- 10.0×
Monthly cashflow live
- Estimated rent
- $1,953 high interval (Pro) →
- Mortgage (P&I)
- −$1,226
- Tax from tax record
- −$340 /mo · $4,079/yr
- Insurance
- −$97
- Flood insurance flood zone
- −$66 /mo · $798/yr
- HOA
- −$29
- Vacancy / Maint / Mgmt
- −$410
- Net cashflow
- $-216
Break-even live
Sensitivity live
| Price | -10% $-84 | -5% $-150 | +0% $-216 | +5% $-282 | +10% $-348 |
|---|---|---|---|---|---|
| Rent | -10% $-370 | -5% $-293 | +0% $-216 | +5% $-139 | +10% $-62 |
| Rate | -1.0pp $-98 | -0.5pp $-157 | base $-216 | +0.5pp $-277 | +1.0pp $-338 |
UW: 25.0% down · 7.5% · 30yr · 1.5% tax · 5.0% vac · 8.0% maint · 8.0% mgmt
Financing live
Cash to close
- Down payment
- $58,446
- Closing costs
- $7,014
- Reserves months
- —
- Total cash needed
- —
Loan-product check · same deal, 3 products live
Conventional
25% down · 7.5% · 30yr
- Down + closing
- —
- Monthly P&I
- —
- Monthly cashflow
- —
- DSCR
- —
- Eligible?
- —
Personal DTI + credit; lowest rate.
DSCR
20% down · 8.5% · 30yr
- Down + closing
- —
- Monthly P&I
- —
- Monthly cashflow
- —
- DSCR
- —
- Eligible?
- —
No personal income docs; deal must DSCR.
Hard money
10% down · 12.0% · 12mo
- Down + closing
- —
- Monthly P&I
- —
- Monthly cashflow
- —
- DSCR
- —
- Eligible?
- —
Short-term bridge; refi at stabilization.
Rent comps 14 comps
| Address | Beds | Baths | Sqft | Rent | $/sqft | DOM | Units | Dist |
|---|---|---|---|---|---|---|---|---|
| 13960 Hillcroft St Unit 2174 Houston, TX | 2.0 | 2.0 | 1332 | $1,570 | $1.18 | 0d | 1 | 0.70mi |
| 13960 Hillcroft St Unit 425 Houston, TX | 2.0 | 2.0 | 1332 | $1,540 | $1.16 | 8d | 1 | 0.70mi |
| 13960 Hillcroft St Unit 14017 Houston, TX | 2.0 | 2.0 | 1332 | $1,540 | $1.16 | 16d | 1 | 0.70mi |
| 6610 Rowell Ct Missouri City, TX | 3.0 | 2.0 | 1753 | $2,056 | $1.17 | 6d | 1 | 0.70mi |
| 13939 Hillcroft Ave Unit 13972 Houston, TX | 3.0 | 2.0 | 1404 | $2,164 | $1.54 | 21d | 1 | 0.88mi |
| 13939 Hillcroft Ave Houston, TX | 1.0–3.0 | 1.0–2.0 | 985 | $2,254 | $2.29 | 4d | 22 | 0.88mi |
| 13939 Hillcroft Ave Unit 13976 Houston, TX | 2.0 | 2.0 | 1089 | $1,703 | $1.56 | 21d | 1 | 0.88mi |
| 6406 Summer Ridge Dr Missouri City, TX | 3.0 | 2.0 | 1624 | $1,958 | $1.21 | 3d | 1 | 0.88mi |
| 15703 Baybriar Dr Missouri City, TX | 3.0 | 2.0 | 1252 | $1,615 | $1.29 | 20d | 1 | 0.96mi |
| 507 Whippoorwill Dr Missouri City, TX | 3.0 | 2.0 | 1970 | $1,925 | $0.98 | 44d | 1 | 1.07mi |
| 15823 Baybriar Dr Missouri City, TX | 3.0 | 2.0 | 1335 | $1,641 | $1.23 | 6d | 1 | 1.12mi |
| 6023 Heatherbrook Dr Houston, TX | 3.0 | 2.0 | 1474 | $1,899 | $1.29 | 0d | 1 | 1.37mi |
| 16211 Corsair Rd Houston, TX | 3.0 | 2.0 | 1139 | $1,813 | $1.59 | 25d | 1 | 1.44mi |
| 712 Beechbend Dr Missouri City, TX | 4.0 | 2.5 | 2245 | $2,250 | $1.00 | 21d | 1 | 1.47mi |
HOA detail
- Monthly dues
- $29 · $348/yr
- Likely covers
- pool
Listing history 3 events
-
2026-06-18days on market $233,786 Active 2 DOM
-
2026-06-17remarks 699-char remark
-
2026-06-17$233,786 Active 1 DOM
ⓘ Source: listings_history table (triggers on properties + properties_extension) + one-shot
backfill from property_details.listing_events for pre-trigger history.
Tax reassessment forecast TX · Resets to sale price
- Current annual tax
- $4,079 · $340/mo
- Projected year-2 tax
- $4,278 · $357/mo
- Expected delta
- +$199/yr (+$17/mo · 4.9%)
ⓘ Screening estimate from a state-policy table — verify with the county assessor before closing.
Climate risk First Street
- Flood 7/10 Severe FEMA zone X (unshaded) · 95% chance over 30 yrs
- Wildfire 3/10 Moderate
- Heat 9/10 Extreme 7 d/yr ≥110°F today · 23 d/yr by 30 yrs out
- Wind 9/10 Extreme 99% chance of damaging wind over 30 yrs
- Air quality 3/10 Moderate 2 unhealthy d/yr today · 3 by 30 yrs out
Nearby sold comps map
Loading sold comps map…
Walkable amenities ~0.75 mi
Loading nearby amenities…
Taxation est. · year 1
- Rental income
- $23,433
- − Mortgage interest
- −$13,096
- − Property taxes
- −$4,079
- − Insurance
- −$1,966
- − Repairs & maintenance
- −$1,875
- − Management
- −$1,875
- − HOA
- −$348
- − Depreciation
- −$6,801
- Taxable loss
- −$6,607
- Est. tax savings @ 24.0%
- +$1,586
- After-tax cash flow
- $-1,008/yr
For passive investors: Depreciation is non-cash, so a rental often shows a tax loss while cash-flowing — sheltering income. Rental losses are passive: they offset passive income freely, and up to $25,000/yr can offset ordinary (W-2) income if you actively participate and your MAGI is under $100k (phasing out to $0 by $150k); unused losses carry forward. On sale, claimed depreciation is recaptured at up to 25%, and gains may owe capital-gains tax (a 1031 exchange can defer both). Figures are a year-1 estimate at your 24.0% rate — not tax advice; consult a CPA.
Schools (NCES district)
- District
- Fort Bend ISD
- NCES district ID
- 4819650
- Math proficiency
- 44% ▼ -15.00%
- Reading proficiency
- 53% ▼ -4.00%
- Median HH income
- $82,360
- Composite
- 44.61/100
- National rank
- #2779
- State rank
- #140 of 826 in TX
Livability — Houston
- Score
- 74/100
- State rank
- #184
- US rank
- #4771
Category grades
Schools grade is shown separately in the Schools card above.
Census & demographics
- Census place
- Houston, TX
- County
- Fort Bend County · 836,777 people
- City population
- 3,226,434
- Metro
- Houston-The Woodlands-Sugar Land, TX
- Population (ZIP)
- 39,292
- Household income
- $74,689
- Rent vs Own
- Severe rent burden
- 1121.0
Population outlook (Fort Bend County) Hauer SSP2
- Today (2025)
- 1,004,526 people
- By 2030
- 1,153,104 · +14.8%
- By 2040
- 1,453,718 · +44.7%
- By 2050
- 1,753,781 · +74.6%
- By 2075
- 2,455,772 · +144.5%
- By 2100
- 2,930,528 · +191.7%
Race, ethnicity, and origin ACS 2023
- Neighborhood character
- Majority Black (60%)
- Race & ethnicity
- Black 60% Hispanic / Latino 29% Two or more races 13% White 4% Asian 3%
- Hispanic origin (detail)
- Mexican 17%
- Foreign-born
- 16% · Canada, Vietnam
- Languages at home
- 73% English-only · Spanish 22% Vietnamese 1% Other Asian/Pacific 1%
Political lean MEDSL · Fort Bend
- 2024 margin
- Toss-up / Even · D 49.5% · R 47.9% · Other 2.6%
- 2008→2024 swing
- +4.0pp toward D · 2008: -2.4pp · 2024: 1.6pp
- All cycles
- 2024: D+1.6 2020: D+10.6 2016: D+6.6 2012: R+6.8 2008: R+2.4
Not yet ingested
- Civics
- —
Market trends
- HPI YoY
- ▼ -0.55%
- Current HPI
- 288.1306
- Rent YoY
- ▲ 0.34%
- Metro
- Houston-The Woodlands-Sugar Land, TX
- State GDP YoY
- ▲ 3.95%
- F500 in state
- 110
Industry mix (Fortune 500 HQ in TX)
| Industry | F500 HQs | Revenue |
|---|---|---|
| Energy | 16 | $1,198B |
|
||
| Technology | 5 | $198B |
|
||
| Engineering / Construction | 4 | $72B |
|
||
| Energy Services | 3 | $60B |
|
||
| Utilities | 3 | $41B |
|
||
| Healthcare | 2 | $330B |
|
||
Price history
+325.8% since first listed8 events — show timeline
- 2026-06-16 Listed $233,786 HARMLS
- 2010-02-03 Sold (Public Records) — Public Records
- 2009-03-05 Sold (MLS) — HARMLS
- 2009-02-13 Listing Removed — HARMLS
- 2009-02-07 Listed $54,900 HARMLS
- 2008-12-24 Sold (Public Records) — Public Records
- 2007-04-04 Sold (Public Records) — Public Records
- 2001-05-30 Sold (Public Records) — Public Records
Property tax history
+4.0%/yrLatest (2025): $4,079 · -10.8% YoY. Source: county tax records.
Cash-flow waterfall
monthlySold comps — $/sqft
last 12 mo · ≤1 miLoading sold comps…