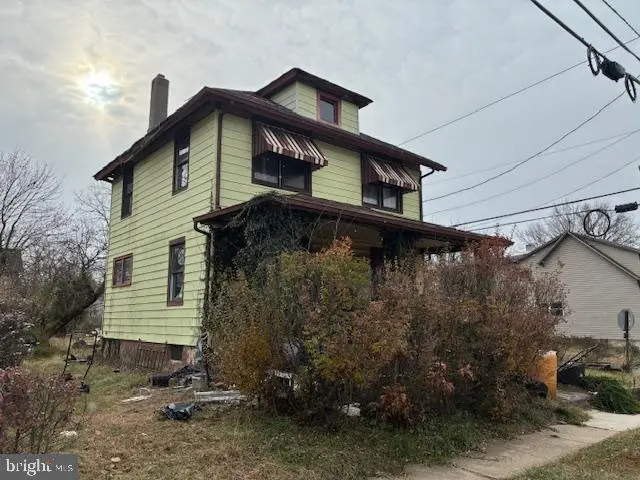
122 W Emlen Ave · Lawnside, NJ
Flood risk 1/10 · Minimal
- FEMA flood zone
- X (unshaded)
- Chance of flooding over 30 yrs
- 0.0%
- Est. flood insurance / yr
- $507 – $1,088
Fire risk 1/10 · Minimal
- Est. fire insurance / yr
- $526 – $976
Heat risk 6/10 · Moderate
- Hot days now (above 104°F)
- 7 days/yr
- Hot days in 30 yrs
- 14 days/yr
Wind risk 6/10 · Moderate
- Chance of severe wind over 30 yrs
- 54.0%
Air-quality risk 4/10 · Minor
- Unhealthy air days now
- 4 days/yr
- Unhealthy air days in 30 yrs
- 6 days/yr
Risk factors via First Street. Map © Google.
Why this score? — see what drove the B+ grade
The composite is a weighted blend of 9 inputs, each scored 0–100. Each bar is that input's sub-score; the figure is the points it added to the 100-point composite (weight × sub-score).
- Cash flow +30.0/30.0
- 1% rule +10.0/10.0
- DSCR +10.0/10.0
- Appreciation +10.0/10.0
- ARV discount +7.5/15.0
- Livability +3.8/5.0
- Schools +2.8/10.0
- Rent growth +2.5/5.0
- Condition / age +2.5/5.0
$129,900
🖨 Deal sheet 📄 Offer letter ✓ Due diligence
Listing remarks
The seller has received multiple offers on 122 Emlen Avenue, Lawnside, NJ and is requesting all interested parties to submit their client’s highest and best offer no later than 12:00 PM on Monday, June 1, 2026.
Key facts
- 7,501 sq ft lot
- Built 1916
- Listed 10 days
Property features AI
Finance
- Other: Ownership is fee simple; Above-grade finished area approximately 1,152 (source: Assessor)
Exterior
- Parking: Driveway
- Utilities: Electric hot water; Public water; Public septic
- Home design: Detached structure; Shingle roof; Frame construction; Block foundation; Above-grade and below-grade structures noted
- Construction: Frame construction; Block foundation; Shingle roof
- Exterior features: Lot dimensions approximately 50 x 150
Interior
- Bedrooms: 3 bedrooms on main level
- Bathrooms: 1 full bathroom on main level
- Interior features: Unfinished basement; Living area source: Assessor
Neighborhood map
What this means for you Summary
Snapshot
- This is a 3-bed/1.0-bath single-family listed at $130k.
Deal economics
- At list price, monthly cash flow is $852 ($10k/yr) — positive.
- The deal already cash-flows at list — no discount required.
- Meets the 1% rule at list price ($2k rent vs $130k).
Location & tenants
- Location reads 75/100 on livability (#152 in NJ, #3,974 nationally) — a middle-class / working-renter tenant base. Strengths: commute A+, housing A+, employment A-; Watch: schools D-, crime F, amenities F.
- Lawnside School Distric (suburban): math 20% / reading 35% proficiency, ranked #566 of 612 in NJ (top 92%) — low school quality limits family demand, transient renter base, plan for 1-2y turnover; 64% free/reduced lunch — lower-income household profile, screen leases tightly.
- Market conditions: 21 active listings in the ZIP; 6 comparable units currently listed for rent nearby; rentals leasing fast (median 1d on market — plan ~1-2 weeks tenant-placement turnaround); 1,018 units permitted in Camden County in 2024 (509 in 5+ unit buildings).
Forward outlook
- In year one you build about $14k of equity ($898 loan paydown + $13k appreciation (10.0% local appreciation)).
- Camden County population projected to shrink 8% by 2050 — rents likely to lag national; underwrite the cash flow, not the appreciation.
- At projected returns (10.0% appreciation + 3.0% rent growth), your $36k cash investment doubles in ~2 years — after that, you're playing with house money.
- By year 3, paydown + projected appreciation supports a ~$35k cash-out refi (75% LTV) — recoverable capital for the next deal without selling this one.
Negotiation context
- Only 10 days on market — expect competitive offers; lowballing is unlikely to land.
Risks & watch-outs
- Watch-outs: property tax is 3.2% of price; built in 1916 — expect roof / HVAC / electrical / plumbing capex.
- Climate carrying-cost: major wind risk, 54% chance of damaging wind over 30y; extreme-heat days projected 7→14/yr by 2055 (HVAC capex compounding) — expect insurance premiums to compound above CPI over the hold.
Questions for the listing agent
- Built in 1916 — when were the roof, HVAC, electrical panel, plumbing, and water heater last replaced?
- Property tax is high relative to price — has the assessment been appealed recently, and will the sale trigger a re-assessment?
- Is there a deadline driving the sale (1031 exchange, divorce, estate, relocation)? That informs how much negotiation room exists.
- Schools are D-rated, which usually means shorter tenancies and higher turnover. Who's the typical renter profile here, and what's been the actual vacancy rate?
- Crime grade is F in this area — have there been break-ins, vandalism, or insurance claims at this property in the last 3 years? What carrier currently insures it and at what premium?
- What's the average days-on-market for RENTAL listings here right now (not sales)? A rising rental-DOM trend means longer vacancies and softer asking-rent achievability than the comps imply.
- What's the recent tenant-quality profile in this submarket — average credit score on applications, eviction rate, late-payment / NSF rate, and stable-employment percentage? A property-management company in the area should have these aggregated.
- How much new for-sale + rental construction is in the pipeline within 1–3 miles? Heavy new supply typically softens prices + rents 12–24 months out; constrained supply supports both.
Investment metrics
- 1% rule
- 1.88% ✓
- Cap rate
- 14.16%
- Cash-on-cash
- 28.10%
- DSCR
- 2.25
- GRM
- 4.4
CMA / ARV
- ARV (on-the-fly)
- $304,128
- Comps found
- 12
Show comp detail 12 sales within ~0.75 mi
| Address | Dist | Beds/Ba | Sqft | Sold | Price | $/sf | Match |
|---|---|---|---|---|---|---|---|
| 124 Thomas Ave S Ave S | 0.06mi | 3/2.5 | 1,179 (+2%) | 11mo | $355,000 | $301 | 78 |
| 436 Carver Ave | 0.43mi | 3/1.0 | 1,214 (+5%) | 0mo | $320,000 | $264 | 71 |
| 27 E Phoenix Ave | 0.25mi | 2/2.0 (-1) | 1,200 (+4%) | 6mo | $260,000 | $217 | 67 |
| 10 Ashland Ave | 0.51mi | 2/1.5 (-1) | 1,184 (+3%) | 8mo | $285,000 | $241 | 58 |
| 102 2nd Ave | 0.65mi | 3/1.0 | 1,091 (-5%) | 9mo | $365,000 | $335 | 53 |
| 612 N Walnut Ave | 0.73mi | 2/1.0 (-1) | 1,100 (-4%) | 3mo | $275,000 | $250 | 51 |
| 207 Phillips Ave | 0.58mi | 3/1.0 | 1,320 (+15%) | 0mo | $285,000 | $216 | 48 |
| 33 E Gloucester Pike | 0.67mi | 2/1.0 (-1) | 1,242 (+8%) | 4mo | $275,000 | $221 | 48 |
| 118 Woodland Ave | 0.63mi | 3/1.0 | 1,287 (+12%) | 8mo | $412,500 | $321 | 44 |
| 392 Tavistock Blvd | 0.68mi | 3/1.5 | 1,271 (+10%) | 14mo | $315,000 | $248 | 38 |
| 115 Woodland Ave | 0.64mi | 3/2.0 | 1,310 (+14%) | 7mo | $425,000 | $324 | 37 |
| 510 Davis Rd | 0.74mi | 3/1.0 | 1,012 (-12%) | 15mo | $298,888 | $295 | 32 |
Match score weights: distance 35% · size 25% · config 20% · recency 20%. Top-matched comps best support the ARV.
Projected returns pro-forma
10.0% appreciation · 3.0% rent growth · sell at horizon
- IRR
- 45.6%
- Equity multiple
- 4.44×
- Total profit
- $125,135
- Equity at exit
- $117,024
- IRR
- 39.6%
- Equity multiple
- 9.97×
- Total profit
- $326,149
- Equity at exit
- $252,367
Cash invested: $36,372 (down + closing). Projections, not guarantees.
Landlord ↔ Tenant lean methodology
- Overall (STATE)
- 21 Tenant-Leaning
- State New Jersey
- 21 Tenant-Leaning · D+6
- County
- — inherits STATE
- City
- — inherits STATE
ZIP-level market 08045
- Home prices YoY
- 13.5%
- Active inventory
- 21
- Price-to-rent
- 4.4×
Monthly cashflow live
- Estimated rent
- $2,449 high interval (Pro) →
- Mortgage (P&I)
- −$681
- Tax from tax record
- −$347 /mo · $4,169/yr
- Insurance
- −$54
- HOA
- −$0
- Vacancy / Maint / Mgmt
- −$514
- Net cashflow
- $852
Break-even live
UW: 25.0% down · 7.5% · 30yr · 1.5% tax · 5.0% vac · 8.0% maint · 8.0% mgmt
Financing live
Cash to close
- Down payment
- $32,475
- Closing costs
- $3,897
- Reserves months
- —
- Total cash needed
- —
Loan-product check · same deal, 3 products live
Conventional
25% down · 7.5% · 30yr
- Down + closing
- —
- Monthly P&I
- —
- Monthly cashflow
- —
- DSCR
- —
- Eligible?
- —
Personal DTI + credit; lowest rate.
DSCR
20% down · 8.5% · 30yr
- Down + closing
- —
- Monthly P&I
- —
- Monthly cashflow
- —
- DSCR
- —
- Eligible?
- —
No personal income docs; deal must DSCR.
Hard money
10% down · 12.0% · 12mo
- Down + closing
- —
- Monthly P&I
- —
- Monthly cashflow
- —
- DSCR
- —
- Eligible?
- —
Short-term bridge; refi at stabilization.
Rent comps 6 comps
| Address | Beds | Baths | Sqft | Rent | $/sqft | DOM | Units | Dist |
|---|---|---|---|---|---|---|---|---|
| 214 David Pl Magnolia, NJ | 4.0 | 1.0 | 1280 | $2,695 | $2.11 | 1d | 1 | 0.76mi |
| 400 E Oak Ave Lawnside, NJ | 2.0 | 2.0 | 1138 | $2,528 | $2.22 | 1d | 3 | 0.97mi |
| 200 W Washington Ave Magnolia, NJ | 2.0 | 1.0 | 800 | $1,375 | $1.72 | 1d | 1 | 1.27mi |
| 413 N Warwick Rd Somerdale, NJ | 1.0–2.0 | 1.0 | 727 | $1,900 | $2.61 | 1d | 6 | 1.42mi |
| 154 E Valleybrook Rd Cherry Hill, NJ | 3.0 | 1.5 | 1413 | $3,300 | $2.34 | 43d | 1 | 1.42mi |
| 401 Glendale Dr Somerdale, NJ | 3.0 | 1.0 | 1060 | $2,400 | $2.26 | 1d | 1 | 1.50mi |
Listing history 7 events
-
2026-06-07status $129,900 Pending 10 DOM
-
2026-06-04days on market $129,900 Active 10 DOM
-
2026-06-03days on market $129,900 Active 9 DOM
-
2026-06-02days on market $129,900 Active 8 DOM
-
2026-06-01days on market $129,900 Active 7 DOM
-
2026-05-31days on market $129,900 Active 6 DOM
-
2026-05-20historical $129,900
ⓘ Source: listings_history table (triggers on properties + properties_extension) + one-shot
backfill from property_details.listing_events for pre-trigger history.
Tax reassessment forecast NJ · Partial reset (capped growth)
- Current annual tax
- $4,169 · $347/mo
- Projected year-2 tax
- $4,169 · $347/mo
- Expected delta
- $0/yr ($0/mo · 0.0%)
ⓘ Screening estimate from a state-policy table — verify with the county assessor before closing.
Climate risk First Street
- Flood 1/10 Low FEMA zone X (unshaded) · 0% chance over 30 yrs
- Wildfire 1/10 Low
- Heat 6/10 Major 7 d/yr ≥104°F today · 14 d/yr by 30 yrs out
- Wind 6/10 Major 54% chance of damaging wind over 30 yrs
- Air quality 4/10 Moderate 4 unhealthy d/yr today · 6 by 30 yrs out
Nearby sold comps map
Loading sold comps map…
Walkable amenities ~0.75 mi
Loading nearby amenities…
Taxation est. · year 1
- Rental income
- $29,382
- − Mortgage interest
- −$7,276
- − Property taxes
- −$4,169
- − Insurance
- −$650
- − Repairs & maintenance
- −$2,351
- − Management
- −$2,351
- − Depreciation
- −$3,779
- Taxable income
- $8,807
- Est. tax owed @ 24.0%
- −$2,114
- After-tax cash flow
- $8,105/yr
For passive investors: Depreciation is non-cash, so a rental often shows a tax loss while cash-flowing — sheltering income. Rental losses are passive: they offset passive income freely, and up to $25,000/yr can offset ordinary (W-2) income if you actively participate and your MAGI is under $100k (phasing out to $0 by $150k); unused losses carry forward. On sale, claimed depreciation is recaptured at up to 25%, and gains may owe capital-gains tax (a 1031 exchange can defer both). Figures are a year-1 estimate at your 24.0% rate — not tax advice; consult a CPA.
Schools (NCES district)
- District
- Lawnside School Distric
- NCES district ID
- 3408340
- Math proficiency
- 20% ▬ 0.00%
- Reading proficiency
- 35% ▼ -10.00%
- Median HH income
- $57,050
- Composite
- 27.71/100
- National rank
- #12312
- State rank
- #566 of 612 in NJ
Livability — Lawnside
- Score
- 75/100
- State rank
- #152
- US rank
- #3974
Category grades
Schools grade is shown separately in the Schools card above.
Census & demographics
- Census place
- Lawnside, NJ
- City population
- 3,124
- Population (ZIP)
- 3,124
Population outlook (Camden County) Hauer SSP2
- Today (2025)
- 507,964 people
- By 2030
- 502,182 · -1.1%
- By 2040
- 485,602 · -4.4%
- By 2050
- 465,630 · -8.3%
- By 2075
- 419,986 · -17.3%
- By 2100
- 369,492 · -27.3%
Race, ethnicity, and origin ACS 2023
- Neighborhood character
- Predominantly Black (72%)
- Race & ethnicity
- Black 72% Hispanic / Latino 20% Two or more races 5% White 4%
- Hispanic origin (detail)
- Mexican 8% Puerto Rican 4% Dominican 2%
- Common ancestry
- Italian 1%
- Foreign-born
- 10% · Canada
- Languages at home
- 83% English-only · Spanish 16% Other Indo-European 1%
Political lean MEDSL · Camden
- 2024 margin
- Strong D (+27.4) · D 63.0% · R 35.5% · Other 1.5%
- 2008→2024 swing
- -8.8pp toward R · 2008: 36.2pp · 2024: 27.4pp
- All cycles
- 2024: D+27.4 2020: D+33.5 2016: D+32.4 2012: D+36.6 2008: D+36.2
Not yet ingested
- Civics
- —
Market trends
- HPI YoY
- ▲ 40.66%
- Current HPI
- 341.1483
- Rent YoY
- —
- Metro
- —
- State GDP YoY
- ▲ 2.05%
- F500 in state
- 34
Industry mix (Fortune 500 HQ in NJ)
| Industry | F500 HQs | Revenue |
|---|---|---|
| Consumer Goods | 3 | $31B |
|
||
| Pharmaceuticals | 2 | $153B |
|
||
| Technology | 2 | $21B |
|
||
| Insurance | 2 | $20B |
|
||
| Healthcare | 2 | $19B |
|
||
| Financial Services | 1 | $70B |
|
||
Price history
1 event — show timeline
- 2026-05-20 Coming Soon $129,900 BRIGHT MLS
Property tax history
+3.3%/yrLatest (2025): $4,169 · +3.5% YoY. Source: county tax records.
Cash-flow waterfall
monthlySold comps — $/sqft
last 12 mo · ≤1 miLoading sold comps…