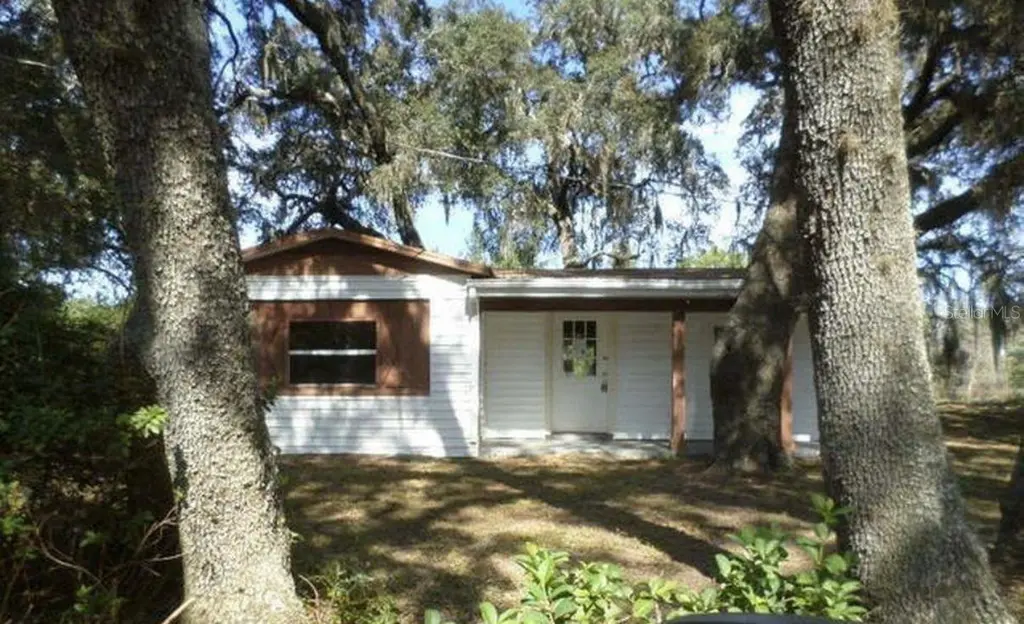
106 Pennsylvania Ave · Pomona Park, FL
Flood risk 1/10 · Minimal
- FEMA flood zone
- X (unshaded)
- Chance of flooding over 30 yrs
- 0.0%
- Est. flood insurance / yr
- $507 – $1,088
Fire risk 6/10 · Moderate
- Est. fire insurance / yr
- $947 – $1,759
Heat risk 9/10 · Severe
- Hot days now (above 108°F)
- 7 days/yr
- Hot days in 30 yrs
- 21 days/yr
Wind risk 9/10 · Severe
- Chance of severe wind over 30 yrs
- 99.0%
Air-quality risk 3/10 · Minor
- Unhealthy air days now
- 3 days/yr
- Unhealthy air days in 30 yrs
- 3 days/yr
Risk factors via First Street. Map © Google.
Why this score? — see what drove the D grade
The composite is a weighted blend of 9 inputs, each scored 0–100. Each bar is that input's sub-score; the figure is the points it added to the 100-point composite (weight × sub-score).
- Cash flow +10.9/30.0
- ARV discount +7.5/15.0
- Appreciation +5.6/10.0
- DSCR +3.2/10.0
- Livability +3.1/5.0
- Schools +3.0/10.0
- Rent growth +2.5/5.0
- Condition / age +2.5/5.0
- 1% rule +2.3/10.0
$114,000
🖨 Deal sheet (PDF) 📄 Offer letter ✓ Due diligence
Listing remarks MLS
This Bungalow style home is situated on a nicely wooded lot and has a work shed for extra storage and a covered entry. The home features 1 bedroom and 1 bathroom and open floor plan layout, laminate floors and countertops, built in stove with an electric coil range top above it, ceramic double sink. Come see this quaint home to appreciate its charm. This is a Fannie Mae HomePath Property.
Key facts
- Outdoor recreation
- Easy access to us-17
- Quiet neighborhood
Tags
Property features AI
Finance
- Other: Unfurnished; Pets allowed
- HOA & community: No association; Association approval not required
Exterior
- Parking: On-street parking; Open parking
- Utilities: Public water; Public sewer; Other utilities
- Home design: Single family residence; One story; Faces south; Residential property (Zoning: R-2)
- Construction: Other construction materials; Other roof; Other foundation; Built on one level
- Exterior features: Other exterior features
Interior
- Kitchen: Range
- Bedrooms: 2 bedrooms
- Flooring: Ceramic tile
- Bathrooms: 1 full bathroom
- Heating & cooling: Central heating; Central air conditioning
- Interior features: Ceiling fans; Open floorplan
- Laundry & utility: Laundry room
Neighborhood map
What this means for you Summary
Snapshot
- This is a 2-bed/1.0-bath single-family listed at $114k.
Deal economics
- At list price, monthly cash flow is $-50 ($-604/yr) — negative.
- To cash-flow at today's rent, offer at most $105k (7.8% below list).
- To meet the 1% rule (rent ≥ 1% of price), the offer needs to be $84k (26.8% below list).
- Recommended offer: $84k (26.8% below list) — sets the bar for 1% rule.
- Cap rate 5.8% vs local median 2.0% in Pomona Park — top-decile yield for the area; either an underpriced asset or a hidden risk that comps aren't pricing in. Stress-test before assuming the spread holds.
Location & tenants
- Location reads 61/100 on livability (#774 in FL) — a middle-class / working-renter tenant base. Strengths: crime A+, cost of living A+, housing A+; Watch: health & safety C-, amenities F, commute F.
- Putnam (town): math 34% / reading 39% proficiency, ranked #66 of 73 in FL (top 90%) — families likely to look elsewhere, expect single-tenant / working-renter base with shorter leases; 71% free/reduced lunch — lower-income household profile, screen leases tightly.
- Zoned schools: Middleton-Burney Elementary School (math 31% / reading 30%, grade F, #1,862 of 2,144 statewide, top 88%, 1,046 students, 70% FRL); Putnam Academy of Arts And Sciences (math 42% / reading 52%, grade D+, #291 of 571 statewide, top 52%, 177 students, 75% FRL, charter); Crescent City Jr-Sr High School (math 17% / reading 34%, grade F, #499 of 667 statewide, top 75%, 1,005 students, 72% FRL) — zoned schools at 72% FRL track the district average.
- Market conditions: 73 active listings in the ZIP; 113 units permitted in Putnam County in 2024 (0 in 5+ unit buildings).
Forward outlook
- In year one you build about $2k of equity ($788 loan paydown + $1k appreciation (1.3% local appreciation)).
- Putnam County population projected at -31% by 2050 — secular population decline; favor cash flow + early exit over multi-decade hold.
Negotiation context
- It's been on market 17 days — a 2% lower offer ($112k) is reasonable based on typical stale-listing flexibility.
- 9 sale attempts since 12y ago with the ask held roughly flat each time — persistent listings suggest the price (not the market) is what's stuck; bring a comps-based counter.
- Current owner paid $20k; list at $114k implies a 473% gain — meaningful room to come down on a strong offer.
Risks & watch-outs
- Climate carrying-cost: severe wind risk, 99% chance of damaging wind over 30y; major wildfire risk; extreme-heat days projected 7→21/yr by 2055 (HVAC capex compounding) — expect insurance premiums to compound above CPI over the hold.
Questions for the listing agent
- What do current leases actually rent for vs. the listed asking? Can we see a recent rent roll and the last 12 months of T-12 income?
- Built in 1962 — when were the roof, HVAC, electrical panel, plumbing, and water heater last replaced?
- Is there a deadline driving the sale (1031 exchange, divorce, estate, relocation)? That informs how much negotiation room exists.
- Schools are F-rated, which usually means shorter tenancies and higher turnover. Who's the typical renter profile here, and what's been the actual vacancy rate?
- The area grade is low — what's the realistic commute time and amenity access for the typical tenant pool here? Any planned neighborhood developments (good or bad) we should know about?
- What's the average days-on-market for RENTAL listings here right now (not sales)? A rising rental-DOM trend means longer vacancies and softer asking-rent achievability than the comps imply.
- What's the recent tenant-quality profile in this submarket — average credit score on applications, eviction rate, late-payment / NSF rate, and stable-employment percentage? A property-management company in the area should have these aggregated.
- How much new for-sale + rental construction is in the pipeline within 1–3 miles? Heavy new supply typically softens prices + rents 12–24 months out; constrained supply supports both.
Investment metrics
- 1% rule
- 0.73% ✗
- Cap rate
- 5.76%
- Cash-on-cash
- -1.89%
- DSCR
- 0.92
- GRM
- 11.4
CMA / ARV
No comps found within radius.
Projected returns pro-forma
1.29% appreciation · 3.0% rent growth · sell at horizon
- IRR
- 0.3%
- Equity multiple
- 1.02×
- Total profit
- $544
- Equity at exit
- $40,675
- IRR
- 4.9%
- Equity multiple
- 1.62×
- Total profit
- $19,670
- Equity at exit
- $55,440
Cash invested: $31,920 (down + closing). Projections, not guarantees.
Landlord ↔ Tenant lean methodology
- Overall (STATE)
- 87 Strongly Landlord-Friendly
- State Florida
- 87 Strongly Landlord-Friendly · R+3
- County
- — inherits STATE
- City
- — inherits STATE
ZIP-level market 32181
- Home prices YoY
- 0.5%
- Active inventory
- 73
- Price-to-rent
- 11.4×
Monthly cashflow live
- Estimated rent
- $835 medium interval (Pro) →
- Mortgage (P&I)
- −$598
- Tax from tax record
- −$65 /mo · $776/yr
- Insurance
- −$48
- HOA
- −$0
- Vacancy / Maint / Mgmt
- −$175
- Net cashflow
- $-50
Break-even live
Sensitivity live
| Price | -10% $14 | -5% $-18 | +0% $-50 | +5% $-83 | +10% $-115 |
|---|---|---|---|---|---|
| Rent | -10% $-116 | -5% $-83 | +0% $-50 | +5% $-17 | +10% $16 |
| Rate | -1.0pp $7 | -0.5pp $-21 | base $-50 | +0.5pp $-80 | +1.0pp $-110 |
UW: 25.0% down · 7.5% · 30yr · 1.5% tax · 5.0% vac · 8.0% maint · 8.0% mgmt
Financing live
Cash to close
- Down payment
- $28,500
- Closing costs
- $3,420
- Reserves months
- —
- Total cash needed
- —
Loan-product check · same deal, 3 products live
Conventional
25% down · 7.5% · 30yr
- Down + closing
- —
- Monthly P&I
- —
- Monthly cashflow
- —
- DSCR
- —
- Eligible?
- —
Personal DTI + credit; lowest rate.
DSCR
20% down · 8.5% · 30yr
- Down + closing
- —
- Monthly P&I
- —
- Monthly cashflow
- —
- DSCR
- —
- Eligible?
- —
No personal income docs; deal must DSCR.
Hard money
10% down · 12.0% · 12mo
- Down + closing
- —
- Monthly P&I
- —
- Monthly cashflow
- —
- DSCR
- —
- Eligible?
- —
Short-term bridge; refi at stabilization.
Listing history 11 events
-
2026-06-21days on market $114,000 Active 17 DOM
-
2026-06-18days on market $114,000 Active 14 DOM
-
2026-06-17days on market $114,000 Active 13 DOM
-
2026-06-16days on market $114,000 Active 12 DOM
-
2026-06-15days on market $114,000 Active 11 DOM
-
2026-06-13days on market $114,000 Active 9 DOM
-
2026-06-09days on market $114,000 Active 5 DOM
-
2026-06-08days on market $114,000 Active 4 DOM
-
2026-06-07days on market $114,000 Active 3 DOM
-
2026-06-05remarks 688-char remark
-
2026-06-05$114,000 Active 1 DOM
ⓘ Source: listings_history table (triggers on properties + properties_extension) + one-shot
backfill from property_details.listing_events for pre-trigger history.
Tax reassessment forecast FL · Resets to sale price
- Current annual tax
- $776 · $65/mo
- Projected year-2 tax
- $946 · $79/mo
- Expected delta
- +$170/yr (+$14/mo · 22.0%)
ⓘ Screening estimate from a state-policy table — verify with the county assessor before closing.
Climate risk First Street
- Flood 1/10 Low FEMA zone X (unshaded) · 0% chance over 30 yrs
- Wildfire 6/10 Major
- Heat 9/10 Extreme 7 d/yr ≥108°F today · 21 d/yr by 30 yrs out
- Wind 9/10 Extreme 99% chance of damaging wind over 30 yrs
- Air quality 3/10 Moderate 3 unhealthy d/yr today · 3 by 30 yrs out
Nearby sold comps map
Loading sold comps map…
Walkable amenities ~0.75 mi
Loading nearby amenities…
Taxation est. · year 1
- Rental income
- $10,020
- − Mortgage interest
- −$6,386
- − Property taxes
- −$776
- − Insurance
- −$570
- − Repairs & maintenance
- −$802
- − Management
- −$802
- − Depreciation
- −$3,316
- Taxable loss
- −$2,631
- Est. tax savings @ 24.0%
- +$631
- After-tax cash flow
- $28/yr
For passive investors: Depreciation is non-cash, so a rental often shows a tax loss while cash-flowing — sheltering income. Rental losses are passive: they offset passive income freely, and up to $25,000/yr can offset ordinary (W-2) income if you actively participate and your MAGI is under $100k (phasing out to $0 by $150k); unused losses carry forward. On sale, claimed depreciation is recaptured at up to 25%, and gains may owe capital-gains tax (a 1031 exchange can defer both). Figures are a year-1 estimate at your 24.0% rate — not tax advice; consult a CPA.
Schools (NCES district)
- District
- Putnam
- NCES district ID
- 1201620
- Math proficiency
- 34% ▼ -10.00%
- Reading proficiency
- 39% ▼ -4.00%
- Median HH income
- $33,350
- Composite
- 29.99/100
- National rank
- #6361
- State rank
- #66 of 73 in FL
Livability — Pomona Park
- Score
- 61/100
- State rank
- #774
- US rank
- #17514
Category grades
Schools grade is shown separately in the Schools card above.
Census & demographics
- City population
- 2,512
- Population (ZIP)
- 2,512
Population outlook (Putnam County) Hauer SSP2
- Today (2025)
- 65,299 people
- By 2030
- 61,255 · -6.2%
- By 2040
- 52,930 · -18.9%
- By 2050
- 45,051 · -31.0%
- By 2075
- 28,720 · -56.0%
- By 2100
- 15,852 · -75.7%
Race, ethnicity, and origin ACS 2023
- Neighborhood character
- Predominantly White (74%)
- Race & ethnicity
- White 74% Two or more races 19% Hispanic / Latino 18% Black 3% Native American 1%
- Hispanic origin (detail)
- Mexican 16% Puerto Rican 2%
- Common ancestry
- Romanian 3% Lithuanian 2% Russian 1%
- Foreign-born
- 3% · Canada
- Languages at home
- 83% English-only · Spanish 17%
Political lean MEDSL · Putnam
- 2024 margin
- Solid R (+47.8) · D 25.8% · R 73.6%
- 2008→2024 swing
- -28.5pp toward R · 2008: -19.3pp · 2024: -47.8pp
- All cycles
- 2024: R+47.8 2020: R+41.2 2016: R+36.6 2012: R+24.5 2008: R+19.3
Not yet ingested
- Civics
- —
Market trends
- HPI YoY
- ▲ 1.29%
- Current HPI
- 267.8886
- Rent YoY
- —
- Metro
- —
- State GDP YoY
- ▲ 3.28%
- F500 in state
- 36
Industry mix (Fortune 500 HQ in FL)
| Industry | F500 HQs | Revenue |
|---|---|---|
| Industrial Technology | 2 | $29B |
|
||
| Insurance | 2 | $17B |
|
||
| Retail | 1 | $60B |
|
||
| Technology Distribution | 1 | $58B |
|
||
| Homebuilding | 1 | $35B |
|
||
| Technology Manufacturing | 1 | $35B |
|
||
Price history
+356.0% since first listed30 events — show timeline
- 2026-06-04 Listed $114,000 Stellar MLS as Distributed by MLS Grid
- 2026-05-01 Listing Removed — Stellar MLS as Distributed by MLS Grid
- 2026-03-15 Price Changed $108,000 Stellar MLS as Distributed by MLS Grid
- 2026-02-22 Price Changed $112,000 Stellar MLS as Distributed by MLS Grid
- 2026-01-31 Price Changed $114,000 Stellar MLS as Distributed by MLS Grid
- 2026-01-20 Relisted — Stellar MLS as Distributed by MLS Grid
- 2026-01-20 Listing Removed — Stellar MLS as Distributed by MLS Grid
- 2026-01-01 Rental Removed $1,200 STELLARMLS
- 2025-12-28 Listed for Rent $1,200 STELLARMLS
- 2025-12-28 Relisted — Stellar MLS as Distributed by MLS Grid
- 2025-11-26 Rental Removed $1,200 STELLARMLS
- 2025-11-26 Pending — Stellar MLS as Distributed by MLS Grid
- 2025-11-01 Relisted — Stellar MLS as Distributed by MLS Grid
- 2025-10-29 Listed for Rent $1,200 STELLARMLS
- 2025-10-03 Listing Removed — Stellar MLS as Distributed by MLS Grid
- 2025-09-20 Price Changed $118,000 Stellar MLS as Distributed by MLS Grid
- 2025-07-30 Price Changed $120,000 Stellar MLS as Distributed by MLS Grid
- 2025-07-14 Price Changed $122,000 Stellar MLS as Distributed by MLS Grid
- 2025-07-02 Price Changed $124,000 Stellar MLS as Distributed by MLS Grid
- 2025-06-23 Price Changed $128,000 Stellar MLS as Distributed by MLS Grid
- 2025-05-31 Listed $154,000 Stellar MLS as Distributed by MLS Grid
- 2015-03-31 Sold (MLS) $19,900 Stellar MLS as Distributed by MLS Grid
- 2015-03-31 Sold (MLS) $19,900 realMLS
- 2015-03-06 Pending — realMLS
- 2014-11-25 Listed $25,900 realMLS
- 2014-11-25 Listed $19,900 Stellar MLS as Distributed by MLS Grid
- 2014-11-25 Price Changed $21,900 realMLS
- 2014-11-25 Price Changed $19,900 realMLS
- 2014-11-25 Price Changed $23,900 realMLS
- 2000-12-18 Sold (Public Records) $25,000 Public Records
Property tax history
+1.4%/yrLatest (2025): $776 · +6.5% YoY. Source: county tax records.
Cash-flow waterfall
monthlySold comps — $/sqft
last 12 mo · ≤1 miLoading sold comps…